

M Pattern in Forex: Spot, Trade & Master the Double-Top Reversal
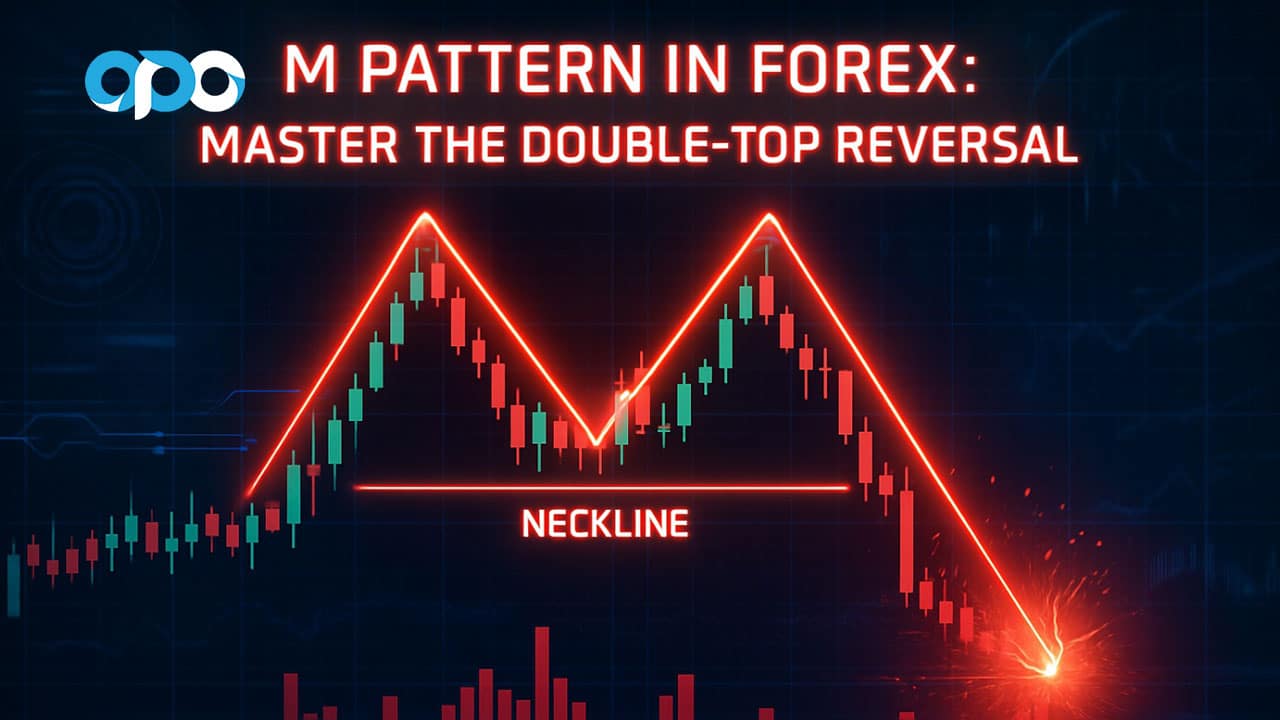
The m pattern in forex is a powerful bearish reversal signal that appears as two consecutive peaks of roughly equal height, forming a shape like the letter ‘M’. This pattern indicates that an existing uptrend is losing momentum and that sellers are beginning to overpower buyers, suggesting a potential trend change from bullish to bearish. Understanding the m pattern in forex trading is crucial for timing short entries. In this guide, we’ll explore how to identify this pattern, implement effective trading strategies, and avoid common pitfalls. For traders looking to apply these strategies, using a regulated online forex broker is essential for reliable execution.
Key Takeaways
- What is the M Pattern?: The m pattern in forex, also known as a double top, is a technical analysis chart pattern that signals a potential trend reversal from an uptrend to a downtrend.
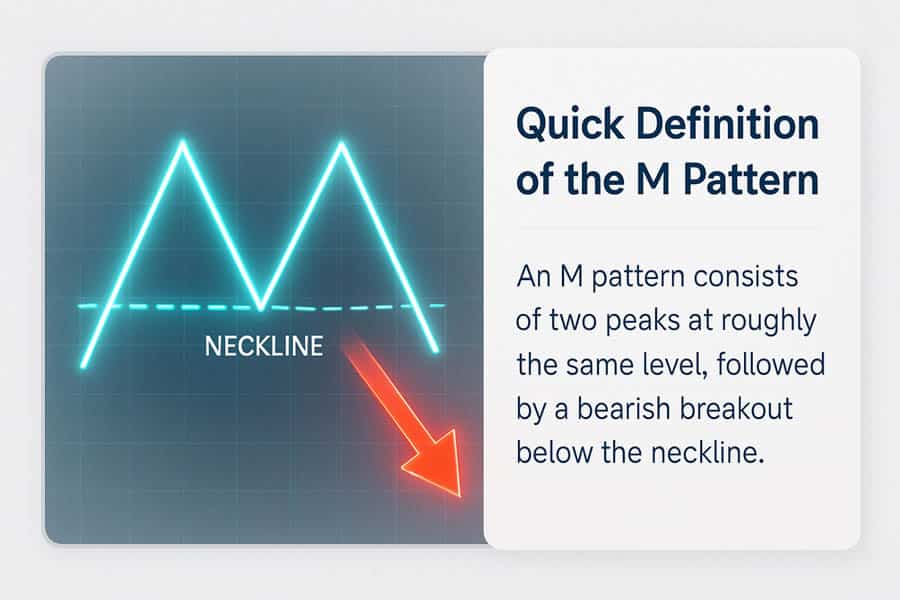
- Identification: It’s characterized by two distinct peaks at a similar price level, separated by a trough. The key confirmation is a price break below the trough’s low, known as the neckline.
- Trading Strategy: The standard approach is to enter a short (sell) position after the price closes decisively below the neckline. Stop-losses are typically placed above the second peak.
- Profit Target: A common method for setting a profit target is to measure the distance from the peaks to the neckline and project that same distance downward from the breakout point.
- Confirmation is Key: Successful trading of the m pattern in forex relies heavily on confirming signals, such as bearish divergence on momentum oscillators (like RSI or MACD) and volume analysis.
Quick Definition of the M Pattern
At its core, the m pattern in forex is a visual map of a failed attempt by the bulls to push prices higher. It tells a story: the price rallies to a peak, pulls back, rallies again to a similar height, but fails to break through, and then reverses downwards. This failure to create a new high is a classic sign of exhaustion in an uptrend, making the M pattern a go-to signal for traders anticipating a market downturn.
How to Identify an M Pattern on a Forex Chart
Spotting an m pattern in forex trading is a skill that blends art with science. It’s more than just finding a shape that looks like the letter ‘M’. From my years watching charts, I’ve learned that the context and the subtleties of its formation are what separate a high-probability setup from a fakeout. It requires a keen eye for detail and an understanding of the underlying market psychology.
Two Equal Highs & Central Trough (Neckline)
The anatomy of a classic m pattern in forex is straightforward. First, you need a clear, established uptrend. The pattern is a reversal signal, so it must have a trend to reverse. The formation begins when the price hits a resistance level, creating the first peak. After this, profit-taking and some selling pressure cause the price to decline, forming a temporary trough or valley.
Next, the buyers make another attempt to push the price higher. This rally forms the second peak, which ideally reaches a similar price level as the first. The inability to surpass the first peak is a critical warning sign—it shows that the bullish momentum is fading. The lowest point of the valley between these two peaks forms the “neckline.” This neckline is the most crucial level in the entire pattern. A confirmed break below this line is the trigger that signals the uptrend is likely over, and a new downtrend is beginning. A true m pattern in forex will have this clear structure.
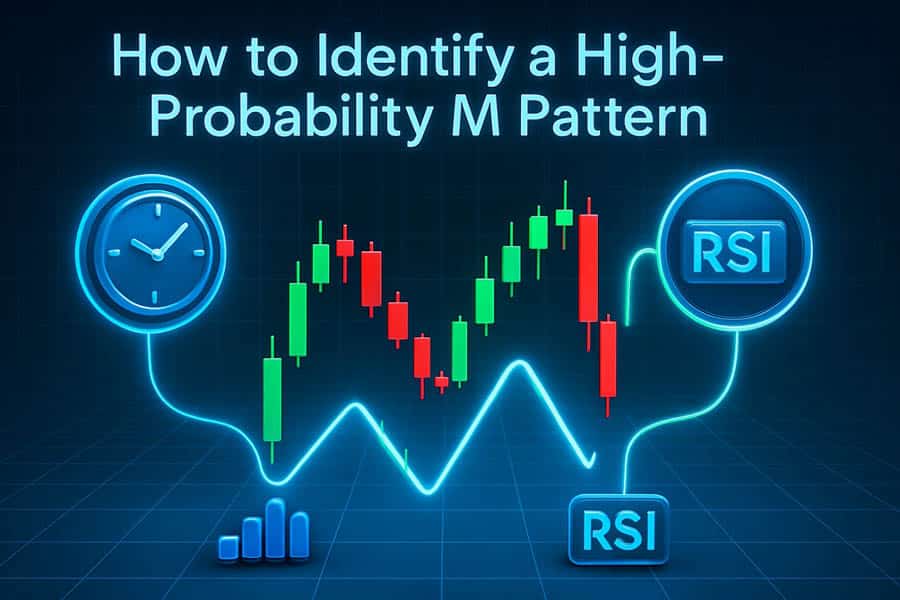
Timeframes That Filter Noise (4-H & Daily)
While the m pattern in forex can appear on any timeframe, its reliability increases significantly on higher timeframes. On shorter charts, like the 5-minute or 15-minute, you’ll see M-like shapes frequently, but many of them are just market noise and not genuine reversal signals. They often lead to false breakouts and unnecessary losses.
In my experience, the 4-hour (H4) and daily (D1) charts are the sweet spots for identifying a robust m pattern in forex trading. These timeframes filter out the intraday noise and show a clearer picture of the market’s true sentiment. A double top forming over several days or weeks on a daily chart carries far more weight than one that forms in under an hour. It represents a more significant, more protracted battle between buyers and sellers where the sellers ultimately win. Trading the pattern on these higher timeframes gives you more confirmation and often leads to more substantial moves.
Volume and Momentum Divergence Checkpoints
Volume is a powerful confirmation tool that many retail traders overlook. For a textbook m pattern in forex, you typically want to see volume behavior that supports the reversal narrative. Ideally, the volume during the formation of the second peak should be lower than the volume on the first peak. This suggests that the enthusiasm behind the second push higher is weak and lacks conviction. Then, as the price breaks below the neckline, a surge in volume is a strong confirmation that sellers are now in control and are entering the market with force.
Another layer of confirmation comes from momentum oscillators like the Relative Strength Index (RSI) or the MACD. What you’re looking for is “bearish divergence.” This occurs when the price makes a higher high or an equal high (the second peak), but the oscillator makes a lower high. This divergence signals that the underlying momentum of the uptrend is weakening, even as the price is still high. When I see bearish divergence aligning with an m pattern in forex, my confidence in the trade setup increases tenfold. It’s a sign that the price action and momentum are out of sync, often a precursor to a reversal.
Step-by-Step M Pattern Trading Strategy
Having a theoretical understanding of what is m pattern in trading is one thing; executing a profitable trade based on it is another. A systematic, step-by-step approach is essential to avoid emotional decisions and manage risk effectively. Here’s a practical framework that I’ve refined over the years to trade the m pattern in forex.
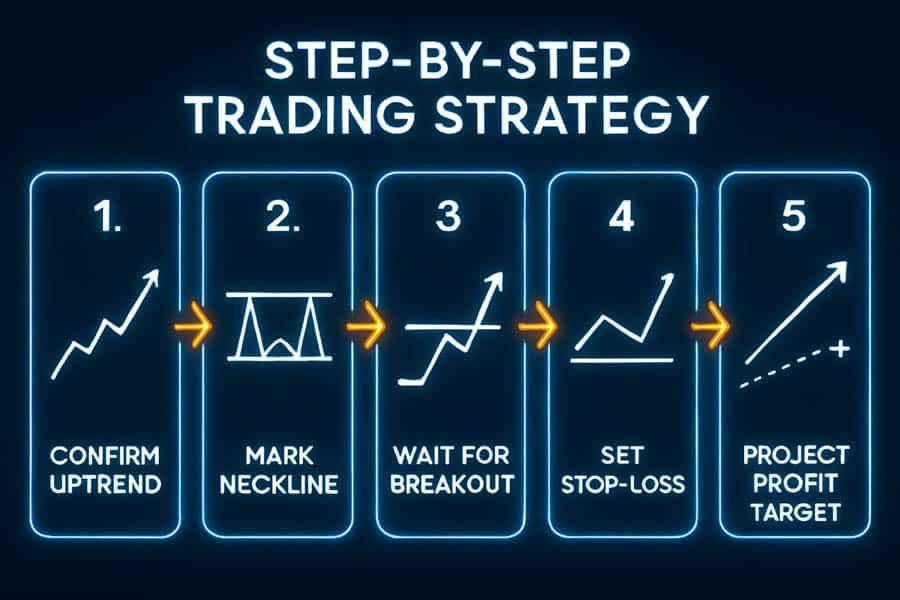
1. Confirm Higher-Timeframe Uptrend First
The first rule of trading any reversal pattern is to ensure there’s a clear trend to reverse. Before you even start looking for the peaks of the ‘M’, zoom out. Look at the daily or weekly chart to confirm that the currency pair has been in a sustained uptrend. An m pattern in forex that forms after a strong, prolonged bullish run is far more significant than one appearing in a choppy, sideways market. The longer and stronger the preceding uptrend, the more potent the potential reversal will be, as more long positions will be trapped and forced to liquidate, adding fuel to the bearish move.
2. Mark Neckline & Wait for Candle Close Below
Once you’ve identified the two peaks and the intervening trough, your most important task is to draw the neckline. This is a horizontal line connecting the lowest point of the trough. This line is your line in the sand. Many novice traders get excited and jump into a short trade as soon as the price touches the neckline. This is a classic mistake. You must wait for a clear, decisive break. My personal rule is to wait for a full candle body (on the timeframe I’m trading, e.g., H4) to close below the neckline. This confirmation helps filter out “false breaks” where the price momentarily dips below the line only to be aggressively bought back up.
[Image: Annotated TradingView chart of GBP/USD on a daily timeframe. The chart shows a clear uptrend followed by an M pattern. The two peaks are circled, the neckline is drawn as a horizontal line, and an arrow points to the bearish candle that closes below the neckline, marking the confirmation.]
3. Entry Triggers: Breakout vs. Conservative Retest
Once you have a confirmed neckline break, you have two primary options for entry:
- The Aggressive Breakout Entry: This involves entering a short position as soon as the confirmation candle closes below the neckline. The advantage is that you’re in the trade early and won’t miss the move if the price drops rapidly. The disadvantage is that you might get caught in a “bear trap” if the breakout fails.
- The Conservative Retest Entry: This is my preferred method. After the price breaks the neckline, it will often pull back to “retest” the neckline from below. The former support level now acts as resistance. You enter your short position when the price touches this new resistance and shows signs of rejection (e.g., forming a bearish pin bar or engulfing candle). This approach offers a better risk-to-reward ratio because your entry point is higher, and it provides a second layer of confirmation that the breakout is genuine. The risk is that sometimes the price doesn’t retest and you miss the trade, but I believe it’s better to miss a trade than to be in a bad one. Successfully trading the m pattern in forex often hinges on patient entry tactics.
4. Stop-Loss: Above Second Peak or ATR Buffer
Risk management is non-negotiable. Your stop-loss protects your capital if the market moves against you. For an m pattern in forex, there are two common placements:
- Above the Second Peak: Placing your stop-loss a few pips above the high of the second peak is the most logical and secure location. A move above this level would invalidate the entire M pattern premise, so it’s a clear signal that your trade idea was wrong.
- Using an ATR Buffer: For a slightly tighter stop, some traders place it above the neckline retest point or use the Average True Range (ATR) indicator. For example, you could place your stop-loss 1x or 1.5x the ATR value above your entry point. This adapts your risk to the current market volatility. I lean towards the more conservative placement above the second peak, especially on volatile pairs, as it gives the trade more room to breathe.
5. Profit Target: Height Projection or Prior Demand Zone
The final step is to define your exit strategy. A common technique for setting a profit target for the m pattern in forex is the “measured move” or height projection method.
To do this, you measure the vertical distance (in pips) from the highest peak of the pattern down to the neckline. Then, you project that same distance downward from the point where the price broke the neckline. This gives you a logical, data-driven target. For instance, if the distance from the peak to the neckline is 150 pips, your initial profit target would be 150 pips below the neckline.
Alternatively, or as a secondary target, you can look left on your chart to identify previous significant support or demand zones. These are areas where the price has previously found strong buying interest. It’s logical to expect some support at these levels again, making them excellent places to take full or partial profits.
Pro Tips to Increase Win-Rate
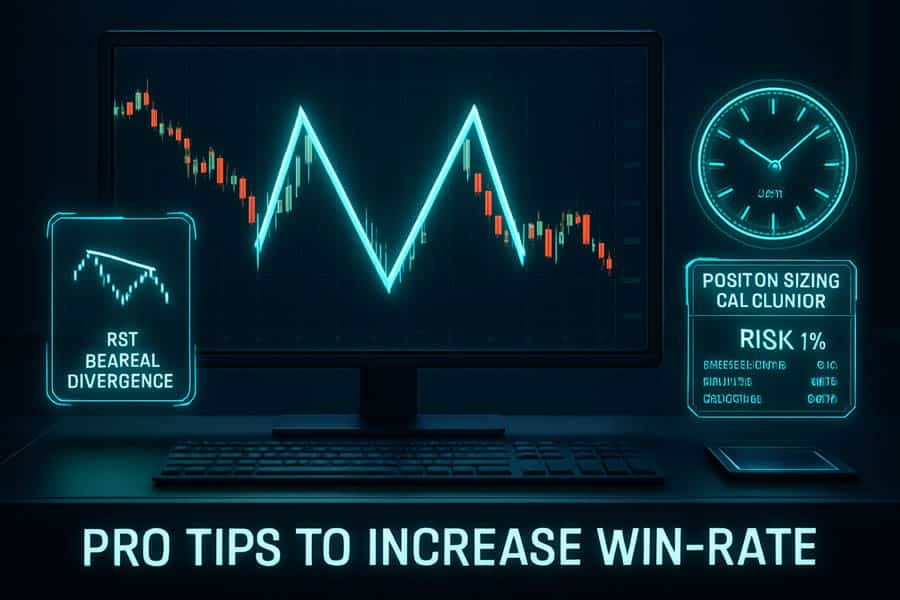
Identifying and executing a trade based on the m pattern in forex is a solid start, but professional traders always look for extra layers of confluence to stack the odds in their favor. These tips are about moving from simply trading the pattern to mastering it. These are the small refinements that can make a significant difference to your bottom line over time.
Combine with RSI/MACD Bearish Divergence
As mentioned earlier, bearish divergence is one of the most powerful confirmation signals to pair with an m pattern in forex trading. I almost never take a double top trade unless I see this signal. It acts as an early warning system, telling you that the engine of the uptrend is sputtering before the car has even stopped. When you see the price chart printing a second peak at the same level as the first, but your RSI or MACD indicator is showing a noticeably lower peak, that’s a significant red flag for the bulls. This divergence between price and momentum is a high-probability sign that the upward thrust is exhausted, making the subsequent neckline break much more likely to succeed.
Check Session Timing: London-to-NY Overlap
Liquidity is the lifeblood of the forex market, and not all trading hours are created equal. The highest liquidity and volume typically occur during the overlap of the London and New York trading sessions (usually from 8 AM to 12 PM EST). An m pattern in forex that completes its neckline break during this high-volume period is often more reliable. Why? Because a breakout on high volume indicates strong participation from institutional players and is less likely to be a false move. A breakout that occurs in the dead of the Asian session on a major pair like EUR/USD might be less trustworthy. Always be aware of the market context and the time of day your setup is forming.
Use Position-Sizing Calculator (Risk ≤1% Per Trade)
This isn’t just a tip; it’s a golden rule of professional trading. You can have the best strategy in the world for trading the m pattern in forex, but if your risk management is poor, you will eventually fail. Before entering any trade, you must know exactly how much of your capital you are willing to lose if the trade goes against you. I strictly adhere to risking no more than 1% of my trading account on any single trade. Use a position-sizing calculator. It will tell you the exact lot size to use based on your account balance, your chosen stop-loss level, and your desired risk percentage. This ensures that a single loss, or even a string of losses, will not devastate your account, allowing you to stay in the game long enough for your edge to play out.
Common Mistakes & How to Avoid Them
Trading the m pattern in forex can be highly profitable, but it’s also fraught with traps for the inexperienced. Recognizing these common pitfalls is the first step to avoiding them. Over the years, I’ve seen countless traders make the same errors, turning a perfectly good setup into a losing trade.
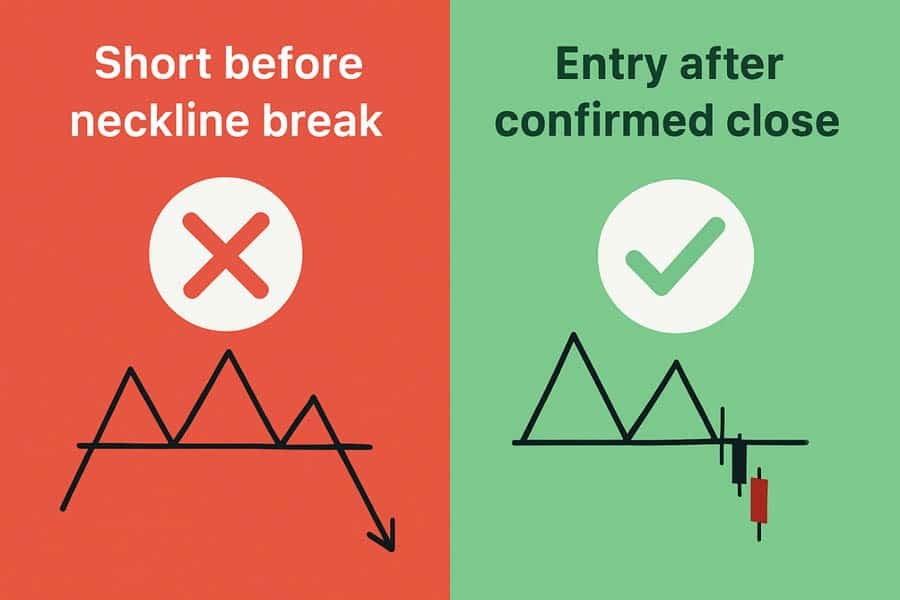
Entering Before Neckline Break
This is by far the most common mistake. A trader identifies what looks like an emerging m pattern in forex. The second peak has formed, and the price is heading down towards the neckline. Driven by a fear of missing out (FOMO), they enter a short position *before* the neckline is broken and confirmed. The pattern is not complete or valid until the neckline is breached. Before that point, it’s just a potential setup. The price could easily bounce off the neckline support and rally to new highs, leaving the premature seller with a significant loss.
How to Avoid It: Patience is your greatest ally. Define your confirmation rule—for example, “a 4-hour candle must close below the neckline”—and stick to it religiously. No exceptions. The market will always offer another opportunity.
Ignoring Central-Bank News
Technical analysis doesn’t happen in a vacuum. A perfect m pattern in forex trading setup can be completely obliterated by a high-impact news event. Imagine you’re shorting EUR/USD based on a beautiful double top on the daily chart, but you’re unaware that the European Central Bank (ECB) is about to release its interest rate decision. A surprise hawkish statement could send the Euro soaring, blowing right through your stop-loss.
How to Avoid It: Always check an economic calendar before placing a trade. Be aware of major events for the currencies you are trading, such as interest rate decisions, inflation reports (CPI), and employment data (like NFP). I personally avoid entering new positions based on a pattern like the m pattern in forex right before such an event. It’s better to wait for the volatility to subside and see if the technical setup is still valid.
Placing Stop-Loss Inside Spread
This is a subtle but costly mistake, especially for those trading with brokers that have wider or variable spreads. The spread is the difference between the bid and ask price. When you place a stop-loss for a short position, it is triggered when the *ask* price touches your stop level. If your stop is too tight and placed just above a resistance level, a momentary widening of the spread (common during news events or low liquidity periods) can trigger your stop, even if the actual market price never reached that level. You get “stopped out” for no reason other than the broker’s spread.
How to Avoid It: Always account for the spread when setting your stop-loss. Check the average spread for the currency pair you are trading and add that amount (plus a small buffer) to your stop-loss calculation. For example, if you want your stop above a peak at 1.1050 and the spread is 2 pips, place your stop at 1.1052 or higher.
When the M Pattern Fails: Managing False Breakouts
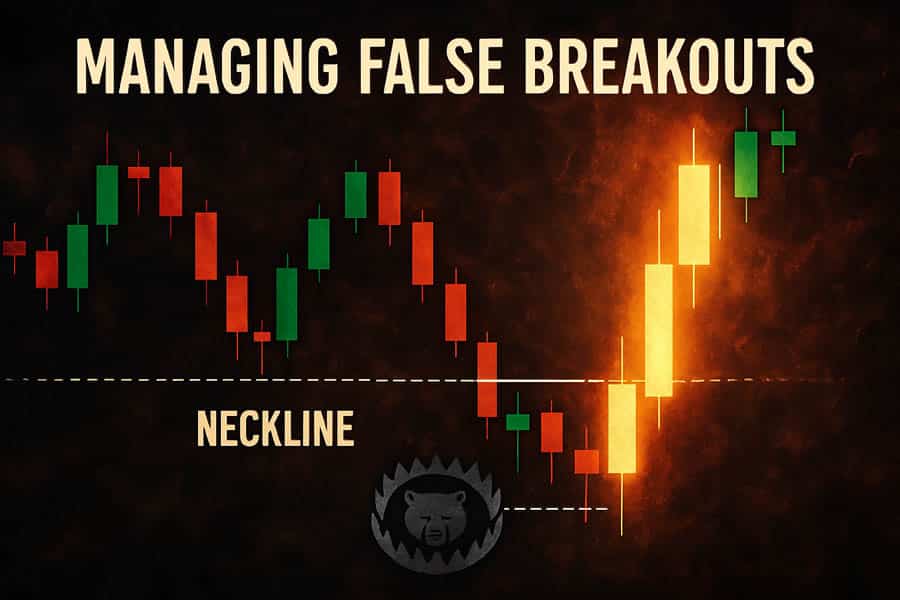
No chart pattern is infallible, including the m pattern in forex. There will be times when the price breaks the neckline, signaling a sell, only to quickly reverse and rally higher. This is known as a failed pattern or a false breakout. Learning to identify the warning signs of a potential failure—and knowing how to react—is just as important as knowing how to trade a successful pattern.
Detecting Low-Volume Breaks
One of the biggest clues that a breakout might fail is a lack of volume. As discussed, a genuine, powerful breakout below the neckline of an m pattern in forex should ideally be accompanied by a surge in selling volume. This shows conviction and participation. If the price drifts below the neckline on very light, anemic volume, be very cautious. It can suggest that there isn’t enough selling pressure to sustain the move. This is often a trap set by institutional players to lure in retail sellers before driving the price in the opposite direction. Always have your volume indicator on your chart and pay attention to its story.
“Failed Double-Top” Bullish Setup
Interestingly, a failed M pattern can become a trading opportunity in itself—for the opposite direction. When the price breaks the neckline and then quickly reclaims it, aggressively moving back up into the pattern’s range, it’s a sign that the bears have failed. This “failed to fail” scenario can be a powerful bullish signal.
The setup is this: The breakout below the neckline is a bear trap. Once the price closes back above the neckline, it shows that the sellers are exhausted and the buyers have regained control. Aggressive traders might look to enter a long (buy) position once the price is firmly back above the neckline, placing a stop-loss below the low of the false breakout. The target could be a retest of the pattern’s peaks or even a new higher high. This demonstrates an important trading principle: you must be able to adapt your market bias when the price action tells you your initial thesis was wrong. Recognizing a failed m pattern in forex can sometimes be more profitable than trading a successful one.
Experience Advanced Trading with Opofinance
Elevate your trading of patterns like the m pattern in forex with a broker built for modern markets. Opofinance, regulated by ASIC, provides the tools and security you need to trade with confidence.
- Advanced Trading Platforms: Choose from MT4, MT5, cTrader, and the exclusive OpoTrade platform.
- Innovative AI Tools: Leverage our AI Market Analyzer, AI Coach, and AI Support for smarter trading decisions.
- Flexible Trading Options: Explore opportunities in Social Trading and Prop Trading.
- Secure & Flexible Transactions: Enjoy safe, convenient deposits and withdrawals, including crypto payments with zero fees.
Join a broker that empowers your trading strategy. Start trading with Opofinance today!
Conclusion
The m pattern in forex is a timeless and reliable tool in a technical trader’s arsenal. Its strength lies in its clear visual structure and the market psychology it represents—a definitive shift from buying pressure to selling pressure. By mastering how to identify the pattern on higher timeframes, confirming it with volume and momentum indicators, and executing with a disciplined strategy for entries, stops, and targets, you can significantly enhance your ability to catch major trend reversals. Remember, the key to successfully trading the m pattern in forex is patience and confirmation.
What is the minimum pip distance between the peaks of an M pattern?
There’s no fixed pip distance. The significance depends on the timeframe. On a daily chart, the peaks might be hundreds of pips apart and weeks in the making, while on an hourly chart, it could be 30-50 pips. The key is that the structure is visually clear and significant relative to recent price action.
Does the M pattern work on crypto or indices?
Yes, absolutely. The M pattern, or double top, is a universal price action pattern based on market psychology. It is effective in any liquid market that is traded, including cryptocurrencies like Bitcoin, stock indices like the S&P 500, and commodities.
Is a perfect M pattern necessary for a valid trade?
No, textbook patterns are rare. The second peak might be slightly higher or lower than the first. The neckline may be slightly slanted. The core principle is the failure to make a significant new high followed by a break of the intervening support. Don’t let minor imperfections invalidate a good setup.
How does a W pattern differ from an M pattern?
The W pattern, or double bottom, is the bullish counterpart to the M pattern. It signals a potential reversal from a downtrend to an uptrend. It looks like the letter ‘W’ and is traded by buying after the price breaks above the neckline (the peak between the two bottoms).
Can I use the M pattern in a scalping strategy?
While possible, it’s generally less reliable on very low timeframes (e.g., 1-minute or 5-minute charts) due to market noise. Scalpers might use it, but the probability of false signals is much higher. It’s most robust on H4 and daily charts.
Related Webpage References:


