In the high-stakes world of forex trading, staying ahead of the curve is essential for success. One powerful tool that traders frequently rely on is the ADX indicator in forex. But how to use ADX indicator in forex effectively to maximize your trading potential? This comprehensive guide delves deep into the ADX indicator, offering valuable insights and strategies tailored for both novice and seasoned traders. Whether you’re searching for a reliable regulated forex broker or looking to enhance your trading strategies, understanding the ADX indicator can significantly improve your decision-making process. Imagine making informed trades with confidence, leveraging a tool trusted by professionals worldwide. Let’s embark on this journey to master the ADX indicator and transform your forex trading experience.
What is the ADX Indicator?
Understanding the Basics
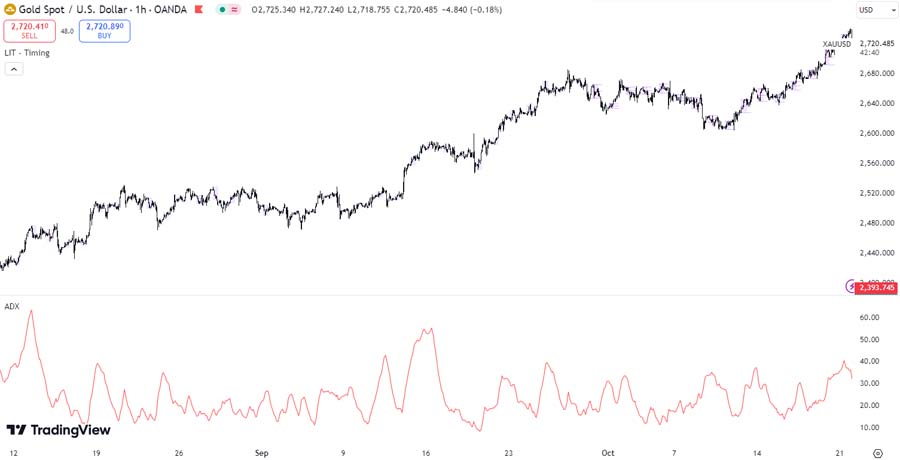
The Average Directional Index (ADX) is a technical analysis tool developed by Welles Wilder. It measures the strength of a trend, whether it’s upward or downward, without considering its direction. The ADX ranges from 0 to 100, where higher values indicate a stronger trend. This non-directional indicator allows traders to assess the intensity of market movements, enabling more informed trading decisions.
Components of ADX
The ADX is part of the Directional Movement System, which includes two other indicators:
- +DI (Positive Directional Indicator): Measures the strength of upward price movements.
- -DI (Negative Directional Indicator): Measures the strength of downward price movements.
By analyzing these components, traders can gauge not only the strength but also the direction of a trend. This dual insight is crucial for making informed trading decisions, ensuring that you enter trades that align with the prevailing market conditions.
Read More: Fractals Indicator in Forex Trading
How the ADX Indicator Works
Understanding how the ADX indicator in forex operates is fundamental to leveraging its full potential. The ADX calculates the difference between the +DI and -DI to determine trend strength. Here’s a step-by-step breakdown:
- Calculation of +DI and -DI:
- +DI assesses the strength of upward movements by comparing current highs to previous highs.
- -DI assesses the strength of downward movements by comparing current lows to previous lows.
- Smoothing the Data:
- The raw differences are smoothed using an exponential moving average to create a more stable indicator.
- Deriving the ADX:
- The ADX is the moving average of the absolute difference between +DI and -DI, divided by the sum of +DI and -DI. This calculation smooths out fluctuations, providing a clear measure of trend strength.
- Interpreting the ADX Line:
- The ADX line itself oscillates between 0 and 100, offering a quantifiable measure of trend strength.
By understanding each step of the ADX calculation, traders can better interpret its signals and integrate them into their trading strategies.
Interpreting ADX Values
Proper interpretation of ADX values is crucial for effective trading. Here’s how to decode what the ADX is telling you:
ADX Value Ranges
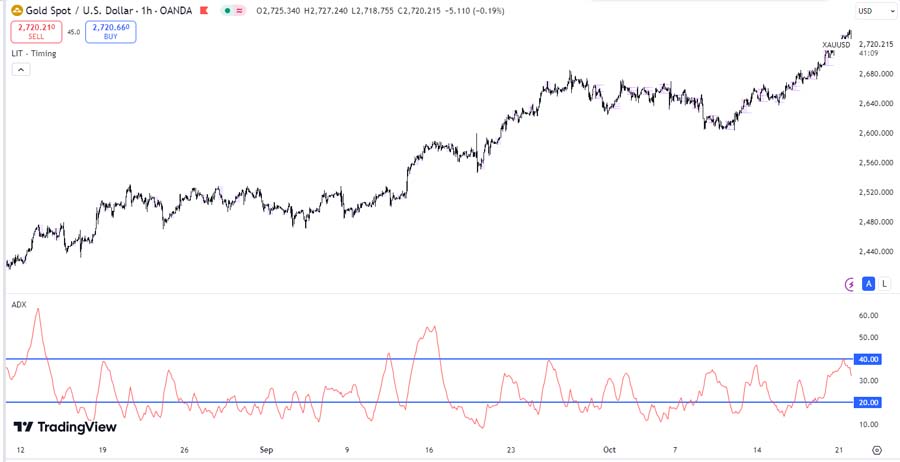
- ADX Below 20:
- Indicates a weak or non-trending market.
- Suitable for range-bound trading strategies.
- ADX Between 20 and 40:
- Signals a moderate trend.
- Offers opportunities for trend-following strategies.
- ADX Above 40:
- Represents a strong trend.
- Ideal for aggressive trend-trading approaches.
Trend Direction
- +DI Above -DI:
- Suggests a bullish trend.
- Traders might look for buying opportunities.
- -DI Above +DI:
- Indicates a bearish trend.
- Traders might consider selling or shorting.
Combining ADX with Price Action
- Rising ADX with Price Movement:
- Confirms the strength of the current trend.
- Reinforces the decision to stay in a trade.
- Falling ADX with Price Movement:
- Suggests weakening trend strength.
- May signal a potential trend reversal or consolidation.
Accurate interpretation of ADX values allows traders to align their strategies with market conditions, enhancing the likelihood of successful trades.
How to Use the ADX Indicator in Forex
Mastering the ADX indicator in forex is essential for traders seeking to enhance their trading strategies and achieve consistent profitability. This section provides a detailed, practical guide on how to effectively utilize the ADX indicator in your forex trading routine. By following these steps and incorporating expert tips, you can leverage the ADX indicator to make informed trading decisions with greater confidence.
Read More: CCI Indicator in Forex
Step-by-Step Guide to Using the ADX Indicator
1. Setting Up the ADX Indicator on Your Trading Platform
Before diving into trading strategies, ensure that the ADX indicator is correctly set up on your preferred trading platform (e.g., MetaTrader 4/5, TradingView):
- Locate the Indicator: Navigate to the indicators section of your platform and search for “Average Directional Index” or “ADX.”
- Apply the Indicator: Add the ADX to your chart, typically found alongside the +DI and -DI lines.
- Customize Settings (Optional): While the default setting is 14 periods, you can adjust this based on your trading style (more on customization below).
Pro Tip: Always ensure that your chart is clear and uncluttered by adjusting the color and thickness of the ADX lines for better visibility.
2. Identifying Trend Strength
The primary function of the ADX indicator is to measure the strength of a trend. Here’s how to interpret the ADX values:
- ADX Above 25:
- Strong Trend: Indicates a strong trending market, whether bullish or bearish.
- Action: Consider trend-following strategies, such as entering trades in the direction of the trend.
- ADX Below 20:
- Weak or Non-Trending Market: Suggests a ranging or consolidating market.
- Action: Opt for range-bound trading strategies, like buying at support and selling at resistance levels.
- ADX Between 20 and 25:
- Moderate Trend: Signals a developing trend.
- Action: Monitor for trend confirmation before committing to trades.
Emotional Trigger: Feel empowered by clearly understanding when the market is ripe for action or when it’s best to wait and watch.
3. Determining Trend Direction with +DI and -DI
The ADX indicator works in conjunction with the +DI and -DI lines to provide insights into the trend’s direction:
- +DI Above -DI:
- Bullish Trend: The market is exhibiting upward momentum.
- Action: Look for buying opportunities or long positions.
- -DI Above +DI:
- Bearish Trend: The market is showing downward momentum.
- Action: Consider selling opportunities or short positions.
Pro Tip: Use the crossover of +DI and -DI as potential entry signals aligned with the trend direction.
4. Generating Entry and Exit Signals
Utilize the ADX, along with +DI and -DI, to pinpoint optimal entry and exit points for your trades:
- Buy Signal:
- Conditions: ADX is rising (above 20) and +DI crosses above -DI.
- Action: Enter a long position, anticipating the continuation of the bullish trend.
- Sell Signal:
- Conditions: ADX is rising (above 20) and -DI crosses above +DI.
- Action: Enter a short position, expecting the bearish trend to persist.
- Exit Signal:
- Conditions: ADX begins to decline (falling below 25) while maintaining the trend direction.
- Action: Exit the trade, as the trend may be weakening or reversing.
Combining ADX with Other Indicators
To enhance accuracy, many traders combine ADX with other indicators such as Moving Averages or the Relative Strength Index (RSI). This multi-indicator approach helps in confirming signals and reducing false positives. For example:
- ADX + Moving Averages:
- Use Moving Averages to identify the trend direction.
- Confirm trend strength with ADX before entering a trade.
- ADX + RSI:
- Use RSI to identify overbought or oversold conditions.
- Confirm the strength of these conditions with ADX.
Practical Example
Imagine the EUR/USD pair is trending upwards with an ADX value of 30. The +DI is above -DI, signaling a strong bullish trend. A trader might decide to enter a long position, anticipating the trend to continue. If the ADX begins to drop below 25 while the +DI crosses below the -DI, it may be time to exit the trade.
This practical application demonstrates how ADX can be seamlessly integrated into trading strategies to optimize entry and exit points.
ADX Settings and Customization
Default Settings
The default setting for ADX is 14 periods, which strikes a balance between sensitivity and reliability. However, depending on your trading style and the specific forex pair, you may need to adjust this setting.
Customizing ADX for Different Trading Styles
- Shorter Periods (e.g., 7):
- Pros: More sensitive, captures trends earlier.
- Cons: May generate more false signals.
- Best For: Day traders or those seeking quick entries.
- Longer Periods (e.g., 21):
- Pros: Smoother indicator, fewer false signals.
- Cons: Delayed response to trend changes.
- Best For: Swing traders or those preferring more reliable signals.
Tailoring ADX to Different Timeframes
- Short-Term Charts (e.g., 1-Minute, 5-Minute):
- Use shorter ADX periods for increased sensitivity.
- Long-Term Charts (e.g., Daily, Weekly):
- Use longer ADX periods to capture major trends.
Practical Tips for Customization
- Backtesting: Always backtest different ADX settings on historical data to find the most effective parameters for your specific trading strategy.
- Combination with Other Indicators: Adjust ADX settings in conjunction with other indicators to create a balanced and responsive trading system.
Customizing ADX settings ensures that the indicator aligns with your unique trading approach, enhancing its effectiveness.
Pro Tips for Advanced Traders

1. Customize ADX Settings
While the default setting for ADX is 14 periods, adjusting this can better suit different trading styles. Shorter periods (e.g., 7) make the ADX more sensitive, capturing trends earlier but possibly increasing false signals. Longer periods (e.g., 21) smooth out the indicator, providing more reliable signals but with a delayed response.
2. Use ADX in Multiple Timeframes
Analyzing the ADX across different timeframes can provide a comprehensive view of the market. For instance, a strong trend on the daily chart backed by a rising ADX on the 4-hour chart can reinforce the trading decision.
3. Identify Range-Bound Markets
A consistently low ADX below 20 indicates a range-bound or consolidating market. Advanced traders can exploit these conditions by using range trading strategies, such as buying at support and selling at resistance.
4. Avoid Overtrading During Sideways Markets
During periods when the ADX signals a weak trend, it’s prudent to stay out of the market or use hedging strategies to minimize risks.
5. Integrate Risk Management Techniques
Regardless of the signals, always implement strict risk management practices. Use stop-loss orders and position sizing to protect your capital against unexpected market movements.
These advanced strategies empower traders to maximize the potential of the ADX indicator while minimizing risks.
Read More: Zigzag Indicator in Forex
Combining ADX with Other Indicators
Enhancing the ADX indicator with other technical tools can significantly improve trading accuracy. Here are some effective combinations:
ADX + Moving Averages
- Purpose: Identify trend direction and confirm trend strength.
- Strategy:
- Use Moving Averages (e.g., 50-day, 200-day) to determine the overall trend.
- Confirm the trend strength with ADX before entering trades.
ADX + Relative Strength Index (RSI)
- Purpose: Identify overbought or oversold conditions alongside trend strength.
- Strategy:
- Use RSI to spot potential reversal points.
- Confirm the strength of the trend with ADX to ensure trades align with market momentum.
ADX + Bollinger Bands
- Purpose: Combine volatility and trend strength for more comprehensive analysis.
- Strategy:
- Use Bollinger Bands to identify price volatility and potential breakout points.
- Use ADX to confirm the strength of the breakout trend.
ADX + MACD (Moving Average Convergence Divergence)
- Purpose: Synchronize trend strength with momentum shifts.
- Strategy:
- Use MACD to identify momentum changes and potential trend reversals.
- Use ADX to confirm the strength of these momentum shifts before executing trades.
By integrating ADX with other indicators, traders can create a robust and multifaceted trading system that enhances decision-making and reduces the likelihood of false signals.
Advantages and Limitations of the ADX Indicator
Advantages
- Trend Strength Measurement:
- Provides a clear measure of trend strength, aiding in informed decision-making.
- Versatility:
- Applicable to any forex pair and various timeframes.
- Complementary Use:
- Enhances the effectiveness of other technical indicators when used in combination.
- Non-Directional:
- Measures trend strength without being biased towards bullish or bearish trends.
Limitations
- Lagging Indicator:
- ADX is based on moving averages, which can introduce a lag in signal generation.
- False Signals:
- In volatile or sideways markets, ADX can produce false signals, leading to potential losses.
- Complexity for Beginners:
- Understanding and interpreting ADX can be challenging for novice traders.
- Dependence on Other Indicators:
- ADX is most effective when used in conjunction with other technical analysis tools.
Recognizing the strengths and weaknesses of the ADX indicator allows traders to use it more effectively and mitigate potential drawbacks.
Opofinance: Your Trusted Partner in Forex Trading
When it comes to leveraging the ADX indicator effectively, having a reliable broker is crucial. Opofinance, an ASIC regulated forex broker, stands out as a premier choice for traders worldwide. Featured on the MT5 brokers list, Opofinance offers a robust social trading service, allowing you to follow and replicate the strategies of successful traders effortlessly. With safe and convenient deposit and withdrawal methods, Opofinance ensures that your trading experience is seamless and secure. Imagine accessing a platform where your trading strategies are supported by top-tier security and exceptional customer service. Join Opofinance today and take advantage of their cutting-edge trading platforms and exceptional customer support to enhance your forex trading journey.

Conclusion
Mastering the ADX indicator in forex is a transformative step toward elevating your trading strategy and achieving consistent success in the dynamic forex market. Throughout this comprehensive guide, we’ve explored the fundamental aspects of the ADX indicator, from its core components and operational mechanics to practical applications and advanced strategies tailored for diverse trading styles.
By understanding how to use ADX indicator in forex effectively, you can accurately assess trend strength, determine market direction, and identify optimal entry and exit points. The ability to interpret ADX values whether signaling a strong trend with an ADX above 25 or indicating a consolidating market with an ADX below 20 empowers you to make informed trading decisions aligned with prevailing market conditions.
Integrating the ADX indicator with other technical tools such as Moving Averages, RSI, Bollinger Bands, and MACD enhances the reliability of your trading signals, reducing the likelihood of false positives and increasing your trading precision. Additionally, customizing ADX settings to match your specific trading style and timeframe ensures that the indicator remains a relevant and powerful component of your trading arsenal.
However, it’s essential to recognize both the advantages and limitations of the ADX indicator. While it excels at measuring trend strength and offers versatility across different forex pairs and timeframes, it is inherently a lagging indicator and can produce false signals in volatile or sideways markets. To mitigate these challenges, combining ADX with robust risk management techniques and other complementary indicators is crucial.
For advanced traders, implementing strategies such as ADX divergence, trend strength confirmation, and range trading can further enhance your trading effectiveness. These sophisticated approaches, coupled with disciplined risk management and continuous learning, position you to navigate the forex markets with greater confidence and success.
Partnering with a reliable forex broker like Opofinance, which offers advanced trading platforms, social trading services, and secure deposit and withdrawal methods, can provide the support and tools necessary to maximize the potential of the ADX indicator in your trading journey.
Embrace the insights and strategies shared in this guide to harness the full power of the ADX indicator. By doing so, you’ll be well-equipped to make strategic, informed decisions that drive your forex trading success.
Key Takeaways
- ADX Indicator: A vital tool to measure the strength of a trend in forex trading.
- Trend Direction: Use +DI and -DI to determine the direction of the trend.
- Trading Signals: ADX helps in identifying optimal entry and exit points.
- Advanced Strategies: Customize settings, use multiple timeframes, and integrate with other indicators for enhanced accuracy.
- Reliable Broker: Partner with a trusted broker like Opofinance for a superior trading experience.
- Risk Management: Always implement strict risk management practices to protect your capital.
- Continuous Learning: Stay updated with market trends and continuously refine your trading strategies.
These key points summarize the essential aspects of mastering the ADX indicator, ensuring you are well-equipped to enhance your forex trading strategies.
Can the ADX indicator predict market reversals?
While the ADX indicator is excellent for measuring trend strength, it doesn’t predict reversals directly. However, changes in the ADX value can signal weakening trends, which may precede reversals. Combining ADX with other indicators like the RSI or candlestick patterns can improve the prediction of potential market reversals.
Is the ADX indicator suitable for all forex pairs?
Yes, the ADX indicator can be applied to any forex pair. However, its effectiveness may vary depending on the volatility and liquidity of the currency pair. It’s essential to backtest the ADX settings on different pairs to determine the most suitable parameters for each.
How does ADX compare to other trend indicators like Moving Averages?
While both ADX and Moving Averages help identify trends, they serve different purposes. Moving Averages primarily indicate the direction of the trend, whereas ADX measures the strength of the trend. Using them together can provide a more comprehensive analysis, confirming the presence and strength of trends for better trading decisions.


