

Finding the most accurate supply and demand indicator is crucial for traders aiming to pinpoint market turning points with precision. The best tools, like the GTF Indicator and Supply Demand Pro, automate the detection of key buying (demand) and selling (supply) zones, saving you from hours of manual charting. These indicators analyze price action, volume, and momentum to highlight high-probability reversal areas. As you navigate the markets with a regulated forex broker, having the right tool is a game-changer. This guide will explore the top 7 indicators, detailing their strengths, weaknesses, and optimal settings to enhance your trading strategy.
Key Takeaways:
- The most accurate supply and demand indicator combines price action, volume, and multi-timeframe analysis to highlight high-probability trading zones.
- Top indicators like GTF Indicator, Supply Demand Pro, and Advanced Supply Demand each offer unique features for different trading styles and needs.
- Customization is essential—adjusting zone strength, sensitivity, and alert settings helps match the indicator to your strategy and market conditions.
- No indicator works alone; the best results come from combining supply and demand zone indicators with other technical tools and price action confirmation.
- Always backtest and demo trade your chosen indicator before using it live to ensure it fits your trading approach and delivers consistent results.
What Makes an Indicator Accurate?
The quest for the most accurate supply and demand indicator isn’t about finding a magic tool that predicts every market move. Instead, it’s about identifying an indicator that consistently and reliably highlights zones where the balance between buyers and sellers is likely to shift. An accurate indicator moves beyond simple lines on a chart and delves into the core mechanics of the market. Its precision is built on a foundation of several key features working in concert.
Truly effective indicators analyze raw price action to see how quickly price leaves a consolidation area, as a strong move often signals a significant imbalance. This is often confirmed with volume; high volume during a breakout from a zone adds a layer of confidence that the zone is significant. Furthermore, the ability to perform multi-timeframe analysis is critical. A demand zone on a daily chart holds far more weight than one on a 5-minute chart, and the best tools allow you to see these higher timeframe zones on your trading chart. They also feature dynamic adjustment, where zones are re-evaluated as new price data comes in, and provide customizable alerts, ensuring you never miss an opportunity when price returns to a key level.
7 Top Supply and Demand Indicators
Navigating the vast sea of trading tools can be overwhelming. To simplify your search, I’ve distilled the options down to seven of the most powerful and reliable supply and demand indicators available to traders in 2025. These have been selected based on their feature sets, user feedback, and their ability to provide a clear, actionable view of the market. Each offers a unique approach to identifying these critical zones, catering to different trading styles from scalping to long-term investing.
GTF Indicator
Description:
Developed by the founders of the GTF stock market institute, the GTF Indicator is frequently cited by users as the best supply and demand indicator due to its comprehensive and user-friendly design. It’s built on a proprietary trading theory that integrates institutional trading patterns with classic technical tools. The indicator automatically plots demand (buying) and supply (selling) zones on your chart, effectively eliminating hours of manual analysis. Its core strength lies in its ability to blend automation with deep customization, making it suitable for both novice and experienced traders.
Pros:
The GTF Indicator is packed with features that go beyond basic zone plotting. It includes built-in moving averages (EMA20, EMA50, DMA200) for trend confirmation, which is a massive plus in my book. It also automatically detects Golden and Death crossovers, providing early warnings of major trend shifts. Another standout feature is its ability to identify “boring candles,” helping traders avoid stagnant markets. The integrated volume analysis, which compares current volume to previous candles, provides crucial context for a zone’s strength.
Cons:
While powerful, the sheer number of features can be a double-edged sword. For an absolute beginner, the interface might feel a bit cluttered at first. It requires some time to understand how to best utilize all the settings, like the body-to-wick marking and custom base candle selection. It’s more of a complete system than a simple plug-and-play indicator, which might not appeal to traders looking for absolute simplicity.
Best Settings:
For a balanced approach, I’ve found that using the default zone detection settings is a great starting point. The real magic happens when you align the built-in moving averages with your trading style. For swing trading, using the SMA50 for overall trend direction and the EMA20/EMA50 crossover signals for entry timing works exceptionally well. When day trading, I tighten the settings and pay close attention to the volume analysis feature on lower timeframes to confirm the strength of newly formed zones.
Read More: ECN vs Standard Account
Supply Demand Pro
Description:
Supply Demand Pro, available on TradingView, markets itself as a leading indicator that forecasts potential reversals before they happen. Its algorithm is designed to identify only the strongest supply and demand zones, filtering out the noise of weaker, less reliable levels. This focus on quality over quantity makes it a contender for the most accurate supply and demand indicator for traders who prefer a clean chart. It provides clear buy/sell signals complete with suggested stop-loss and take-profit levels, which is incredibly helpful for building a structured trading plan.
Pros:
The primary advantage of Supply Demand Pro is its clarity. By focusing only on high-probability zones, it prevents the analysis paralysis that can come from a chart cluttered with too many levels. The inclusion of suggested stop-loss and take-profit targets is a fantastic feature for traders who struggle with risk management. It’s also versatile, working across all markets and timeframes, and comes with timely alerts for new setups.
Cons:
This is a premium, paid indicator, which is an immediate drawback for traders on a budget. While it claims to be a “leading” indicator, it’s essential to remember that no tool can predict the future with 100% certainty. Over-reliance on its signals without additional confirmation could be risky. Some experienced traders might also find the pre-defined stop-loss and take-profit levels too rigid for their dynamic strategies.
Best Settings:
Since the indicator’s core algorithm is designed to find the “strongest” zones, tweaking settings is less about discovery and more about alignment. From my experience, the best approach is to use the default settings for zone detection and focus on the risk-management parameters. Adjust the suggested stop-loss to fit your personal risk tolerance—for example, setting it just beyond the zone’s outer edge plus a small buffer. Use the take-profit levels as primary targets, but be prepared to manage the trade manually if price action suggests a stronger trend.
Read More: Identifying Support and Resistance in Forex
Advanced Supply Demand
Description:
Specifically designed for the MetaTrader 4 (MT4) platform, the Advanced Supply Demand indicator is a favorite among forex traders. It utilizes proprietary algorithms to graphically display both current and historical supply and demand zones. One of its most powerful features is the ability to show nested zones by displaying zones from the current timeframe alongside those from a higher timeframe. This gives traders a much deeper understanding of market structure and is a key reason many consider it a top-tier supply and demand zone indicator.
Pros:
The nested zones feature is a game-changer. Seeing a fresh 1-hour demand zone forming inside a larger 4-hour demand zone gives an incredibly strong confluence for a long trade. The indicator is highly customizable, allowing traders to define the parameters for what constitutes a “strong” zone. It also includes a triple-alert system that notifies you when price enters a zone, breaks a zone, or forms a reversal candle within a zone, offering multiple actionable signals.
Cons:
Its biggest limitation is that it’s exclusive to the MT4 platform, so traders using TradingView or other platforms are out of luck. Like many powerful tools, its extensive customization options can present a steep learning curve. If you don’t take the time to understand and optimize the zone strength settings for your chosen currency pair and timeframe, you may not get the best results.
Best Settings:
To make the most of this indicator, enable the double timeframe zones immediately. I recommend setting the higher timeframe to be 3-5x your trading timeframe (e.g., H4 zones on an H1 chart). For zone strength, start with the default and backtest. For volatile pairs like GBP/JPY, you may need to increase the strength parameter to filter out weaker zones. For range-bound pairs, a lower strength setting might be more effective. Always use the alerts for reversal candles as your primary entry trigger.
Supply & Demand Forex Indicator for MT4/5
Description:
This indicator, often discussed in communities like Forex Factory, uses a ZigZag-based algorithm to identify significant price turning points and then builds supply and demand zones around them. It displays supply levels as red histogram bars and demand levels as green ones, with the height of the bar indicating volume or strength. It’s a more visual and straightforward tool, making it a great supply and demand zone indicator for those who appreciate simplicity.
Pros:
The visual histogram format makes it very easy to gauge the relative strength of supply versus demand at a glance. It clearly distinguishes between active (current) and inactive (broken) zones, which helps in understanding the evolving market structure. It’s highly customizable in terms of color schemes, which is a nice touch for personalizing your charts. Its simplicity makes it less intimidating for newer traders.
Cons:
Because it’s based on the ZigZag indicator, it can be a lagging indicator. The zones are drawn after a significant price move has already occurred. This means it’s better for confirming levels rather than predicting future ones. It lacks some of the advanced features of other indicators, such as nested multi-timeframe zones or automated trend analysis.
Best Settings:
The key setting to adjust here is the ZigZag `Depth` parameter. A lower number will create more zones based on smaller price swings, suitable for scalpers. A higher number will filter for only the most significant turning points, which is better for swing traders. I would suggest starting with a `Depth` of 12 and adjusting from there based on backtesting. Use this indicator primarily to identify strong, established zones to trade from when the price returns, rather than trying to trade the initial formation of the zone.
Supply/Demand Zones (Expo) by Zeiierman
Description:
This is an advanced indicator that processes market data to highlight areas where price is likely to find support (demand) or resistance (supply). It’s known for its robust customization, allowing traders to fine-tune the algorithm’s sensitivity and trend detection to match their specific strategy. The “Significance Threshold” setting is particularly useful, as it lets you filter out minor zones and focus only on the levels that matter.
Pros:
The level of customization is its greatest strength. You can select the price data source (open, high, low, close) for zone calculation and adjust the trend detection period. This makes the indicator incredibly adaptable to different market conditions and trading styles. It’s a precise tool for traders who want to have granular control over how their zones are identified. This is often what separates a good indicator from the most accurate supply and demand indicator.
Cons:
That same level of customization can be its weakness. It’s not a “set and forget” tool. You need a solid understanding of supply and demand principles to configure it effectively. Incorrect settings can lead to either too many false zones or missing significant ones entirely. It’s designed for the serious technical analyst rather than the casual trader.
Best Settings:
Start by setting the `Source Selection` to `Close` for a balanced calculation. The `Trend Period` should be aligned with your trading horizon—a longer period (e.g., 50) for swing trading and a shorter one (e.g., 20) for day trading. The most important setting is the `Significance Threshold`. Backtest different levels; a higher threshold will give you fewer but stronger zones, which is often the best approach for risk-averse traders.
Supply and Demand by HiddenLiquidity
Description:
This innovative TradingView indicator offers a unique twist on a classic concept. Instead of just identifying broad zones, it uses a Fibonacci adjustment to pinpoint institutional order blocks with greater precision. It unconventionally applies the Fibonacci tool not to swing highs and lows, but to the body of the candle preceding a strong impulsive move. This method aims to identify the exact price levels where “Smart Money” has placed orders, making it a very precise supply and demand zone indicator.
Pros:
The Fibonacci integration is a standout feature that can lead to incredibly precise entry points. It’s designed to reflect institutional activity, which is the driving force behind major market moves. The indicator also considers the number of candles in a consolidation phase to determine a zone’s strength, adding another layer of analytical depth. It allows you to see all relevant levels on a single timeframe, reducing the need to constantly switch charts.
Cons:
The methodology is unconventional, which means it requires a leap of faith and thorough testing to trust its signals. It may not align with the traditional supply and demand theory that many traders have learned, creating a potential conflict in analysis. Its precision can also be a flaw if it causes traders to set their entry orders too tightly, potentially missing trades by a few pips.
Best Settings:
Since the core logic is based on its unique Fibonacci application, the “best settings” involve trusting the indicator’s plotted levels but managing your entries around them. Instead of placing a limit order at the exact line it draws, I suggest waiting for the price to enter the zone and looking for a confirmation candlestick pattern (like an engulfing or pin bar) before entering. This combines the indicator’s precision with real-time price action confirmation.
ForexCracked Supply and Demand Indicator
Description:
This is another high-quality tool designed for MT4, known for its proprietary formulas and comprehensive feature set. Like the Advanced Supply Demand indicator, it excels at identifying strong zones and analyzing their historical performance. It also features a triple-alert system and the ability to detect nested supply and demand zones. It’s a robust all-in-one solution for traders who want deep market insights.
Pros:
This tool is packed with professional-grade features. The double timeframe and nested zone detection provide a comprehensive market view. The alert system is highly practical for active traders. A unique feature is its trend analysis support, which informs you how many consecutive zones have been broken, giving a clear signal of trend strength or exhaustion. This combination of features makes it a very strong candidate for the best supply and demand indicator for serious forex traders.
Cons:
Like other MT4-exclusive indicators, its platform limitation is a significant drawback for many. The sheer amount of information it can display, especially with historical and nested zones enabled, can make the chart look busy if not configured properly. It is a tool that demands study and practice to be used to its full potential.
Best Settings:
Activate the `Double Timeframe Zones` feature and set the higher timeframe to at least four times your trading timeframe. Use the `Zone Strength` parameter to filter out noise, especially on lower timeframes. I recommend paying close attention to the `Consecutive Broken Zones` counter. If you see three consecutive demand zones break, it’s a strong signal that the downtrend is powerful, and you should avoid looking for long entries until the momentum shifts.
Read More: Fair Value Gap vs Supply and Demand
How to Choose the Best Supply and Demand Indicators
Selecting the best supply and demand indicator is not a one-size-fits-all decision; it’s a deeply personal choice that hinges on your unique trading style and preferences. The right tool for a fast-paced scalper is vastly different from what a patient swing trader needs. To make the right choice, you must first understand your own approach to the markets.
Consider your trading style first. If you are a scalper, you need an indicator that is highly responsive and provides clear signals on lower timeframes, like the Supply & Demand Forex Indicator with a tight ZigZag setting. Swing traders, on the other hand, will benefit more from tools that excel at multi-timeframe analysis and identifying robust, long-term zones, such as the Advanced Supply Demand or GTF Indicator. Also, assess the importance of features like volume confirmation and customizable alerts. If you can’t be at your screen all day, a reliable alert system is non-negotiable. Finally, consider ease of use versus customization. If you are a “plug-and-play” type of trader, a simpler tool is better. If you are an analyst who loves to fine-tune every parameter, a highly customizable indicator like the one from Zeiierman will be a better fit.
Pro Tips for Effective Use of Supply and Demand Indicators
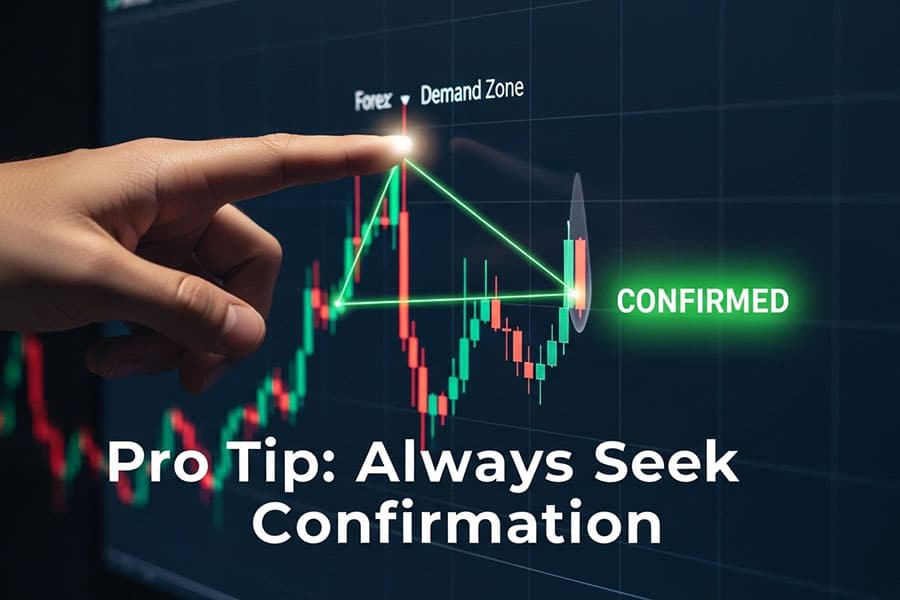
Owning the most accurate supply and demand indicator is only half the battle; using it effectively is what truly separates profitable traders from the rest. These tools provide a map of potential market turning points, but they are not crystal balls. To unlock their full potential, you must integrate them into a holistic trading process built on principles of confirmation, risk management, and continuous adaptation.
First and foremost, never rely on an indicator in isolation. Always seek confirmation. When price enters a demand zone, don’t just blindly buy. Wait for a bullish confirmation signal, such as a bullish engulfing pattern, a pin bar, or a crossover on a momentum oscillator like the RSI. Second, use the alert features proactively. Set alerts slightly before the price reaches a zone so you have time to prepare and analyze the market context. Third, be adaptable. Adjust your indicator’s settings based on market volatility. In a highly volatile market, you may need to widen your zones or increase the strength filter to avoid false signals. Finally, and most importantly, practice rigorous backtesting and demo trading. This is the only way to build confidence in your tool and strategy before putting real money on the line.
Opofinance Services
To effectively use any supply and demand indicator, you need a reliable trading partner. Opofinance, an ASIC-regulated broker, provides the technology and security essential for modern traders. Their platform offerings are designed to enhance your trading experience.
- Advanced Trading Platforms: Seamlessly trade on industry-leading platforms including MT4, MT5, cTrader, and the exclusive OpoTrade.
- Innovative AI Tools: Leverage the AI Market Analyzer, AI Coach, and AI Support to gain an analytical edge and refine your decisions.
- Flexible Trading Options: Engage in social trading to learn from others or explore prop trading to scale your strategies.
- Secure and Convenient Transactions: Benefit from safe and efficient deposits and withdrawals, including crypto payments, with zero fees charged by Opofinance.
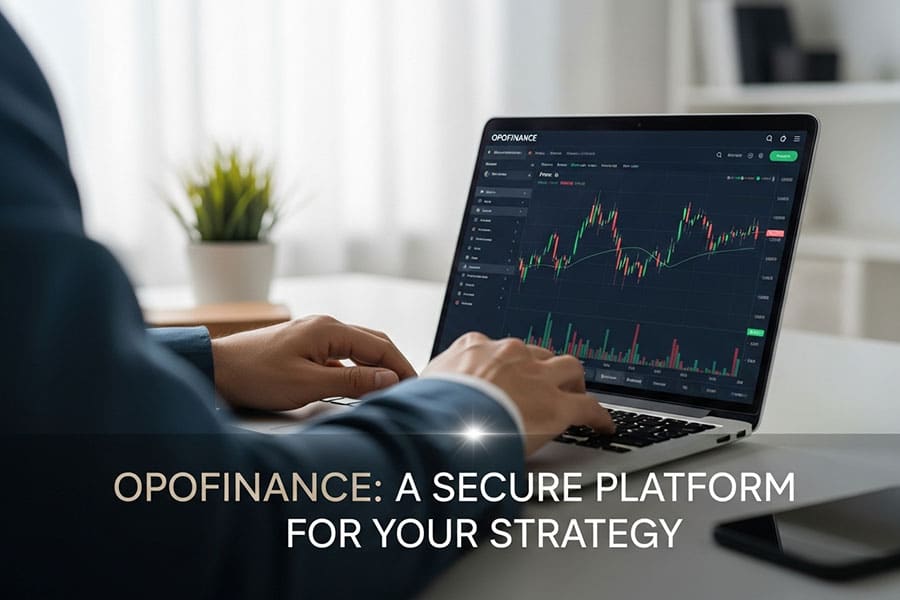
Ready to elevate your trading with advanced tools and a secure environment? Visit opofinance.com to explore their full suite of services.
Conclusion
The journey to find the single most accurate supply and demand indicator ultimately leads back to the trader. While tools like the GTF Indicator or Advanced Supply Demand offer powerful features, their effectiveness is magnified by your skill. The best approach is to select an indicator that aligns with your trading style, then master it through practice. Combine its signals with rigorous price action analysis and sound risk management. This synergy between a high-quality tool and a disciplined trader is the true formula for achieving precision in the markets.
Can supply and demand indicators predict market crashes?
No, they cannot predict crashes with certainty. They can, however, identify large, significant supply zones on higher timeframes where selling pressure is historically overwhelming. A strong rejection from such a zone could be an early warning sign of a major downturn, but it is not a prediction.
Are free supply and demand indicators reliable?
Many free indicators are quite reliable, especially those built into major platforms like TradingView. However, premium indicators often offer more advanced features, deeper customization, dedicated support, and more sophisticated algorithms for filtering out weaker zones.
How do I handle overlapping supply and demand zones?
Overlapping zones, especially from different timeframes (nested zones), often represent very strong areas of confluence. A trade setup in a nested zone is typically considered a higher-probability opportunity. Treat the entire overlapping area as one larger, more significant zone.
What’s the difference between a supply/demand zone and a support/resistance line?
A support or resistance line is a specific price point. A supply or demand zone is a price area or zone. Zones represent a broader region where a cluster of orders caused a price imbalance, making them more robust and realistic than a single line, as institutional orders are placed across a range of prices.
Do these indicators work for cryptocurrency trading?
Yes, the principles of supply and demand are universal and apply to any market driven by human buying and selling, including cryptocurrencies. However, due to the high volatility of crypto, you may need to use higher timeframes (4-hour and above) and adjust the indicator’s sensitivity settings to filter out market noise.


