

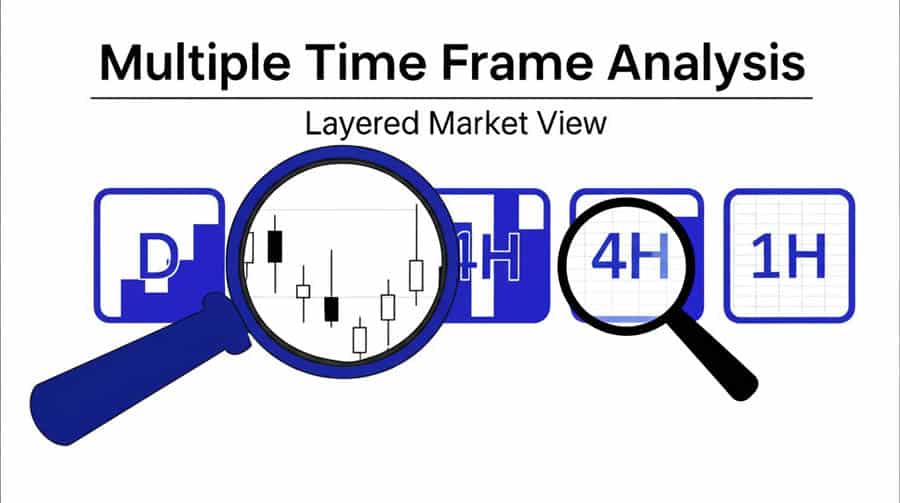
Do you find it difficult to consistently identify market trends? Do you get frustrated entering trades that quickly reverse? This is a common issue when relying solely on a single chart timeframe. A promising move on one chart might conflict with the larger market picture. Fortunately, there’s a structured approach to gain more clarity. A multiple time frame momentum strategy involves analyzing the same financial asset across different chart durations (such as daily, 4-hour, and 1-hour charts).

This provides a layered perspective, helping you better assess market momentum and trend strength. Utilizing this technique, often facilitated by a reliable broker for forex trading, helps align your trades with the broader market direction. This guide explains how this type of multiple time frame momentum strategy works and how you can implement it.
Understanding Multiple Time Frame Analysis
Multiple time frame analysis (MTFA) means examining an asset’s price action across several different chart periods. Instead of focusing on just one timeframe, you look at longer-term, medium-term, and shorter-term charts simultaneously. This approach provides a more comprehensive view of market activity. It helps distinguish significant trends from short-term price fluctuations or ‘noise’. Applying MTFA effectively is crucial for a sound multiple time frame momentum strategy.
Time Frame Categories
Traders typically categorize time frames based on their intended trade duration:
- Higher Time Frames (e.g., Daily, Weekly): These charts indicate the primary, long-term market direction and overall trend. They help determine the dominant market bias.
- Medium Time Frames (e.g., 4-Hour, 1-Hour): These provide context for price movements within the larger trend identified on higher time frames. They highlight potential trade setup areas and intermediate price swings.
- Lower Time Frames (e.g., 15-Minute, 5-Minute): These are used for precise trade execution. Once the trend direction is established on higher frames, traders use lower frames to pinpoint specific entry and exit points.
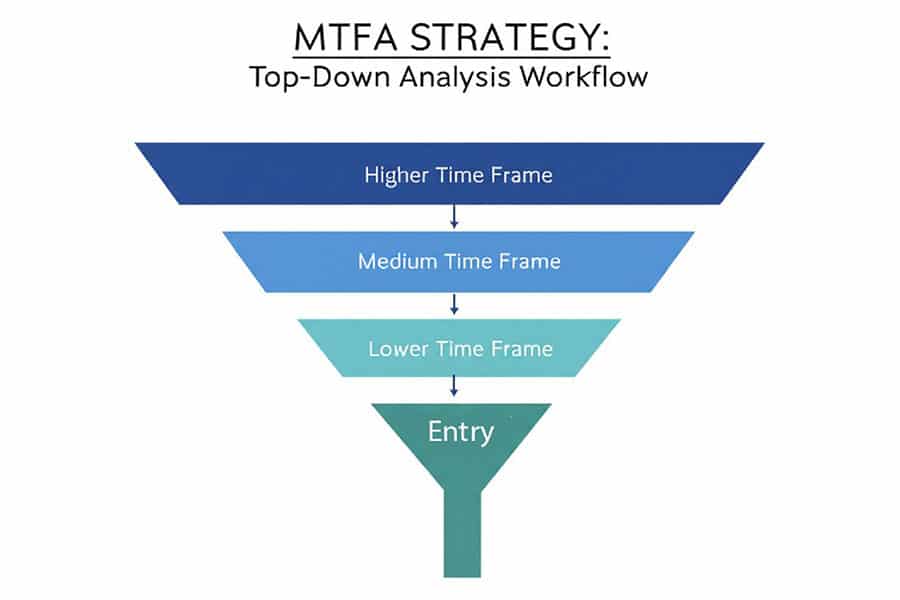
The Top-Down Approach
The most widely used method for MTFA is the top-down approach. This involves starting the analysis on the highest relevant time frame to identify the prevailing trend (uptrend, downtrend, or sideways range). Next, the trader moves to a medium time frame to look for trading opportunities that align with the main trend, often waiting for price pullbacks or consolidations. Finally, the trader uses the lowest time frame to find a specific entry trigger or confirmation signal. This systematic process helps ensure that trades are executed in alignment with the market’s broader directional movement, a core element of any well-defined multiple time frame momentum strategy.
Core Principles of Momentum Trading
Momentum trading strategies focus on participating in established market trends. The central idea is that an asset showing strong price movement in a specific direction is likely to continue that movement for some period. Instead of predicting reversals, momentum traders seek to profit from the continuation of the current trend. Understanding momentum is fundamental to the multiple time frame momentum strategy.

What is Momentum?
In trading, momentum refers to the rate of price change or the strength behind a price movement. High momentum indicates that the price is moving strongly and rapidly in one direction. Low momentum suggests slower or sideways price action. A critical aspect of a multiple time frame momentum strategy involves evaluating this rate of change across different chart durations to confirm the trend’s strength.
Read More: How to Use the Momentum Indicator in Forex
Key Momentum Indicators
Traders employ specific technical indicators, sometimes called a multiple time frame momentum indicator set, to quantify momentum:
- Relative Strength Index (RSI): This oscillator measures the speed and magnitude of recent price changes, helping to identify potential overbought (typically above 70) or oversold (typically below 30) conditions. Momentum traders often look for the RSI to remain above 50 during uptrends or below 50 during downtrends.
- Stochastic Oscillator: Similar to the RSI, this indicator compares a security’s closing price to its price range over a specific period. It is often used to identify potential entry points during pullbacks within a trend.
- Moving Average Convergence Divergence (MACD): This indicator illustrates the relationship between two exponential moving averages and helps identify shifts in momentum through its line crossovers and histogram.
- Moving Averages (MAs): Simple (SMA) or Exponential (EMA) moving averages smooth price data to clarify the underlying trend direction. The slope of an MA and crossovers between different MAs are commonly used momentum signals.
Measuring Momentum Across Time Frames
The effectiveness of a multiple time frame momentum strategy lies in comparing indicator readings across the chosen time frames. Ideally, momentum signals should align: strong momentum confirming the trend on the higher time frame, validating the setup on the medium time frame, and triggering the entry on the lower time frame. This alignment across charts significantly increases the probability of a trade’s success.
How the Multiple Time Frame Momentum Strategy Works
Implementing a multiple time frame momentum strategy requires a structured process. This ensures trade decisions are logical and aligned with market conditions across different perspectives, combining a broad market view with precise execution timing. Building a reliable multiple time frame momentum strategy depends on this methodical approach.
Step-by-Step Breakdown
A typical workflow includes these steps:
- Select Appropriate Time Frames: Choose chart durations that match your trading style (e.g., scalping, day trading, swing trading). The 1:4 to 1:6 ratio (discussed next) provides a useful guideline.
- Identify Trend and Momentum on Higher Time Frames: Begin analysis on your longest chosen time frame. Determine the dominant trend direction using tools like moving averages or trendlines. Assess momentum using indicators like MACD or RSI to confirm the trend’s strength.
- Confirm Signals and Identify Setups on Medium Time Frames: Move to the intermediate time frame. Look for price action confirming the higher time frame trend, such as pullbacks to key support/resistance levels or moving averages. Momentum indicators here should ideally align with the higher frame’s direction.
- Pinpoint Entry Points on Lower Time Frames: Use your shortest time frame for execution. Wait for a specific entry trigger, like a candlestick pattern, a break of a short-term trendline, or a momentum indicator signal confirming movement in the direction of the higher time frames.
- Align Indicators and Price Action: Seek confluence where price action (support/resistance, patterns) and technical indicators (MAs, oscillators) across all chosen time frames indicate the same direction. This alignment is central to the multiple time frame momentum strategy.
Read More: Multiple Timeframe Strategy
The 1:4 or 1:6 Time Frame Selection Rule
A common guideline for selecting time frames is the “Rule of Four” or “Rule of Six.” This suggests choosing time frames where each duration is approximately four to six times shorter than the next higher one. This helps ensure distinct perspectives while maintaining correlation for analysis. Examples include:
- Swing/Position Trading: Weekly / Daily / 4-Hour
- Standard Swing Trading: Daily / 4-Hour / 1-Hour
- Intraday Trading: 1-Hour / 15-Minute / 5-Minute (or 1-Minute)
This ratio helps structure the analysis effectively for the multiple time frame momentum strategy.
Popular Multiple Time Frame Momentum Strategies
Traders often adapt the core principles of MTFA to suit their individual trading styles. Several common structures focus on aligning momentum signals across selected charts.

Dual Time Frame Momentum Strategy
This simplified version uses only two time frames: a higher one for trend direction and a lower one for entry timing. For instance, a swing trader might identify an uptrend on the Daily chart and then use the 1-Hour chart to find buy signals during pullbacks. A dual time frame momentum strategy is less complex but remains effective for filtering trades.
Triple Time Frame Strategy
This is the classic application, employing three time frames (Higher, Medium, Lower) for more thorough confirmation. A trader might establish specific criteria for each timeframe:
- Daily Chart: Confirms the primary trend (e.g., price above 200 EMA, MACD positive).
- 4-Hour Chart: Shows price pulling back to a support area within the trend (e.g., testing the 50 EMA), with RSI remaining bullish.
- 1-Hour Chart: Provides a specific bullish entry signal (e.g., bullish engulfing pattern, Stochastic buy signal).
Achieving confirmation across three distinct time frames provides strong validation for a trade setup. This is a robust implementation of a multi time frame momentum trading strategy.
Adapting to Trading Styles
The choice of time frames directly influences strategy application:
- Scalping: Uses very short time frames (e.g., 15-min / 5-min / 1-min). Requires rapid signal alignment for small, frequent profits.
- Swing Trading: Typically uses Daily / 4-Hour / 1-Hour charts. Aims to capture larger price swings over several days or weeks.
- Position Trading: Employs longer-term charts like Weekly / Daily / 4-Hour. Focuses on major trends, holding positions for weeks or months.
The fundamental logic of aligning momentum for the multiple time frame momentum strategy applies across all styles; only the time scale differs.
Read More: Multi Time Frame Scalping
Key Technical Indicators for MTFA Momentum
While many indicators exist, certain tools are particularly well-suited for identifying and confirming momentum across multiple time frames. Combining them often provides a more robust signal for your multiple time frame momentum strategy.

Moving Averages (EMA/SMA)
Moving averages are fundamental for trend identification on higher time frames and identifying dynamic support/resistance on medium/lower frames.
- Trend Direction: Price consistently above a rising MA suggests an uptrend; below a falling MA suggests a downtrend.
- Crossovers: A faster MA crossing above a slower MA can indicate bullish momentum intensification, and vice-versa.
- Dynamic Support/Resistance: Price often respects key MAs during pullbacks within an established trend.
RSI and Stochastic Oscillator
These oscillators help gauge momentum strength and identify potential overbought/oversold conditions, useful for timing entries on lower time frames.
- Momentum Confirmation: RSI above 50 generally supports bullish momentum; below 50 supports bearish momentum. Seek alignment across time frames.
- Entry Timing: Entering on a Stochastic crossover out of oversold territory (in an uptrend) or overbought territory (in a downtrend) on the lower time frame can refine entries.
- Divergence: Discrepancies between price action and oscillator movement (divergence) can signal potential trend weakness or continuation, depending on the type (regular or hidden).
A reliable multiple time frame momentum indicator set often includes one or both oscillators.
MACD (Moving Average Convergence Divergence)
MACD is effective for visualizing momentum shifts and assessing trend strength.
- Signal Line Crossovers: The MACD line crossing above its signal line is generally considered bullish; below is bearish. Look for these signals in the direction of the higher time frame trend.
- Zero Line Crossovers: The MACD crossing above the zero line indicates strengthening bullish momentum; below zero indicates strengthening bearish momentum.
- Histogram: Bars increasing in height indicate rising momentum; bars decreasing indicate fading momentum.
Fibonacci Retracement
While not a momentum indicator itself, Fibonacci levels are valuable for identifying potential price retracement zones within a trend where momentum might resume.
- Identifying Entry Zones: In an uptrend, traders monitor price pullbacks to key Fibonacci levels (e.g., 38.2%, 50%, 61.8%) and look for lower time frame entry signals near these levels.
Price Action and Candlestick Patterns
Indicator signals should always be interpreted in the context of price action. Candlestick patterns on lower time frames offer concrete entry triggers.
- Confirmation: Bullish patterns (engulfing, pin bar) at support levels or bearish patterns (shooting star, engulfing) at resistance levels add significant weight to indicator signals.
- Market Structure: Confirming sequences of higher highs/lows (uptrend) or lower highs/lows (downtrend) across time frames reinforces the trend analysis necessary for a multiple time frame momentum strategy.
Entry and Exit Criteria
Defining clear entry and exit rules is crucial for the consistent application of any trading strategy, including the multiple time frame momentum strategy. These rules should leverage the layered analysis provided by MTFA.
Confirming Trade Entries Across Time Frames
A high-probability entry requires alignment across your chosen time frames:
- Higher Time Frame: Establishes the dominant trend and momentum bias (e.g., price > 50 EMA, RSI > 50).
- Medium Time Frame: Confirms the setup within the trend (e.g., pullback to a key MA or support zone, MACD histogram improving).
- Lower Time Frame: Provides the specific entry trigger (e.g., bullish candlestick pattern, Stochastic crossover).
The entry is executed only when all selected time frames signal movement in the same direction, validating the multiple time frame momentum strategy setup.
Exit Strategies and Stop-Loss Placement
Effective risk management is essential.
- Stop-Loss Placement: Use price structures on the lower or medium time frame to set logical stop-loss levels. Place stops below recent swing lows (for longs) or above recent swing highs (for shorts), or beyond key support/resistance identified on these frames. Avoid placing stops based solely on the higher time frame, as this often leads to excessively wide stops and larger potential losses.
- Profit Targets: Targets can be determined based on previous highs/lows, key resistance/support levels on medium or higher time frames, Fibonacci extensions, or a predetermined risk-reward ratio (e.g., 1:2 or 1:3).
- Trailing Stops: As a trade moves favorably, consider using a trailing stop (adjusted manually or based on an indicator like ATR or Parabolic SAR) on the medium or lower time frame to secure profits while allowing potential for further trend continuation.
Managing Risk Using Multi-Time Frame Signals
MTFA also aids in ongoing risk management. If momentum begins to weaken or signals start conflicting across time frames (e.g., lower time frame shows divergence against the higher time frame trend), it may be prudent to tighten stops, take partial profits, or exit the trade. Identifying deteriorating conditions early is a key benefit of applying a multiple time frame momentum strategy.
Common Pitfalls and Limitations
While effective, the multiple time frame momentum strategy has potential challenges. Awareness of these can help traders navigate them.

Over-Analysis and Conflicting Signals
Using too many time frames or indicators can lead to indecision (“analysis paralysis”). Conflicting signals are common – for instance, bullish momentum on the Daily chart while the 15-Minute chart shows bearish divergence. It’s important to adhere to a pre-defined set of time frames and core indicators, prioritizing signals from higher time frames. Stick to your analytical plan derived from the multiple time frame momentum strategy.
Waiting for Perfect Alignment
Expecting every single indicator on every time frame to align perfectly might result in missing viable trading opportunities. Markets rarely present textbook setups. Define your essential confluence criteria (e.g., trend confirmation, pullback to a key zone, entry trigger) and accept that minor discrepancies may occur. Develop judgment through practice and reviewing past trades.
Adapting to Different Market Conditions
Momentum strategies generally perform best in trending markets. They tend to struggle in choppy, range-bound markets where momentum signals frequently reverse, leading to unprofitable trades (whipsaws). Identifying the prevailing market condition (trending vs. ranging) on the higher time frame is essential. If the market lacks clear direction, it might be better to wait or employ a different strategy than the multiple time frame momentum strategy.
Best Practices for Multi Time Frame Momentum Trading
To maximize the effectiveness of the multiple time frame momentum strategy, incorporate these best practices into your trading routine.

Selecting Time Frames Based on Trading Style
Ensure your chosen time frames (using the 1:4 to 1:6 rule as a guide) align with your trading horizon. A scalper using Daily/4-Hour/1-Hour is impractical, just as a position trader focusing only on 5-min/1-min charts would be ineffective. Match the analysis window to the typical duration you intend to hold trades. This is crucial for any multiple time frame momentum strategy.
Importance of Patience and Discipline
This strategy often requires waiting for conditions to align across multiple charts. Patience is necessary – avoid forcing trades if the setup doesn’t meet your predefined criteria. Discipline involves consistently adhering to your entry, exit, and risk management rules, regardless of recent outcomes. Avoid impulsive decisions based on lower time frame fluctuations that contradict the analysis from higher time frames within your multiple time frame momentum strategy.
Using Tools and Screeners for Efficiency
Manually monitoring multiple instruments across several time frames can be demanding. Utilize platform features:
- Watchlists: Maintain a list of potential trading candidates.
- Alerts: Set price or indicator alerts on higher/medium time frames to notify you when conditions potentially align, reducing constant screen monitoring.
- Charting Software: Use platforms that allow easy switching between time frames and saving chart templates with your preferred indicators.
These tools help streamline the process of implementing the multiple time frame momentum strategy.
Opofinance Services
Selecting a suitable broker is important for effectively implementing strategies like the multiple time frame momentum strategy. Opofinance, an ASIC-regulated broker, offers a suite of tools and conditions beneficial for contemporary traders:
- Advanced Trading Platforms: Choose from industry standards like MT4 and MT5, or explore the powerful cTrader and the user-friendly OpoTrade platform.
- Innovative AI Tools: Gain potential advantages with unique AI technology, including the AI Market Analyzer for insights, an AI Coach for guidance, and AI Support for assistance.
- Social & Prop Trading: Engage with a community through Social Trading or explore opportunities with Prop Trading programs.
- Secure & Flexible Transactions: Benefit from safe and convenient deposit and withdrawal methods, including popular cryptocurrencies. Opofinance charges zero fees on their side for deposits and withdrawals, allowing more of your capital to be used for trading.
Opofinance provides a secure and technologically advanced environment, supporting traders in optimizing their application of approaches like the multiple time frame momentum strategy.
Explore Opofinance’s features and open an account today!
Conclusion
The multiple time frame momentum strategy offers a structured framework for analyzing markets and making trading decisions. By integrating perspectives from higher, medium, and lower time frames, traders can improve their ability to identify strong trends, time entries with greater precision, and manage risk more effectively. Although it requires patience and discipline, learning this technique can contribute to more consistent trading outcomes. Remember that no strategy guarantees profits. Always backtest thoroughly and adapt the principles of the multiple time frame momentum strategy to your individual trading style and risk tolerance before committing real capital. This methodical approach is key to leveraging its potential.
Key Takeaways
- Layered Analysis: Use higher time frames for trend, medium for setup, and lower for entry.
- Momentum Confirmation: Align momentum indicators (RSI, MACD, Stochastics) across your chosen time frames.
- Time Frame Selection: Use the 1:4 to 1:6 ratio to select appropriate time frames for your trading style (e.g., Daily/4-Hour/1-Hour for swing trading).
- Confluence is Key: Combine indicator signals with price action (support/resistance, patterns) for stronger confirmation.
- Risk Management: Set stop-losses based on lower/medium time frame structure and manage trades based on cross-time frame signals.
- Patience & Discipline: Wait for high-probability setups where signals align and stick to your trading plan.
- Market Context: This multiple time frame momentum strategy works best in trending markets; be cautious in choppy conditions.
How does market volatility affect the multiple time frame momentum strategy?
Volatility can be both beneficial and challenging. Increased volatility often fuels strong momentum, which this strategy aims to capture. However, high volatility also leads to wider price swings, potentially triggering stop-losses prematurely or causing slippage on entries. During very high volatility (e.g., major news events), signals on lower time frames can become erratic. It’s crucial to adjust stop-loss placement (perhaps using ATR-based stops) and potentially reduce position size during extreme volatility. Conversely, very low volatility might not generate enough momentum for the multiple time frame momentum strategy to be effective.
Is the multiple time frame momentum strategy suitable for beginner traders?
While the concept is logical, implementing it effectively requires practice and discipline. Beginners might find coordinating analysis across multiple charts and indicators initially overwhelming. Starting with a simpler dual time frame momentum strategy (e.g., Daily for trend, 1-Hour for entry) can be a good way to learn the methodology. Thorough backtesting and starting on a demo account are highly recommended until a trader feels comfortable with the process before committing real capital. Its structured nature, however, can be beneficial for learning disciplined trading.
Can this strategy be combined with other forms of analysis?
Absolutely. The multiple time frame momentum strategy is often enhanced by incorporating other analytical techniques. For example, traders might use fundamental analysis to select instruments with a strong underlying bias that aligns with the technical trend identified on higher time frames. Identifying key support and resistance levels using tools like Fibonacci retracements or pivot points adds context to pullback zones. Volume analysis can also help confirm the strength behind a momentum move. Combining different non-correlated analysis types can often lead to more robust trading decisions when using a multiple time frame momentum strategy.


One Response
Excellent. Lucid presentation.