

A Regression Channel Trading Strategy is a statistical method that helps traders visualize a trend’s direction and strength. It uses a linear regression line, which is a “best fit” line drawn through price action, and then adds two parallel lines at set standard deviations above and below it. Unlike static trendlines, this dynamic channel adapts to volatility, offering clear potential entry and exit zones. This article will cover everything from the core principles of the regression channel indicator to advanced strategies, helping you effectively use this tool with your preferred online forex broker.
Key Takeaways
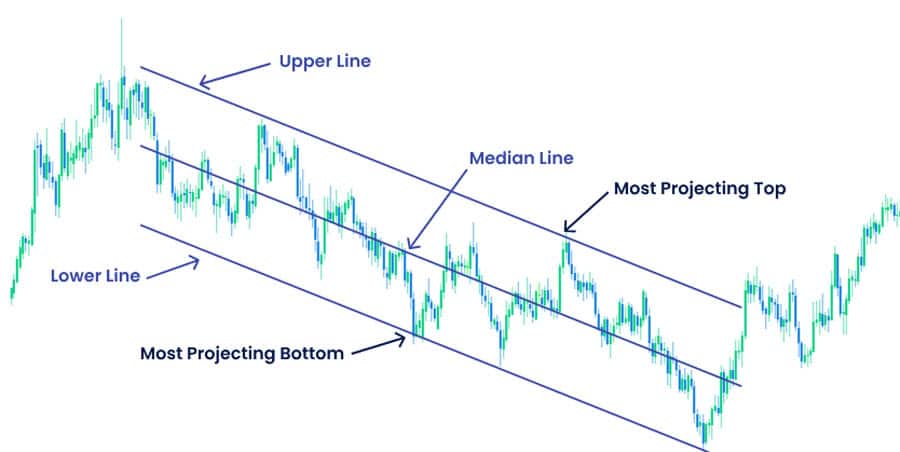
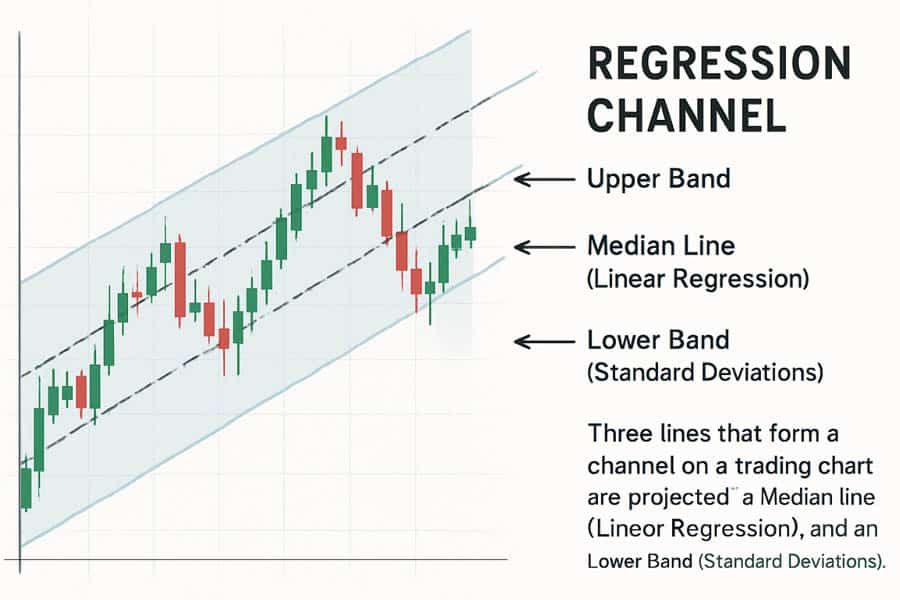
- What it is: The Regression Channel is a technical analysis tool consisting of a median line (linear regression) and two outer lines set at standard deviations, which contain the majority of price action.
- Primary Use: It excels at identifying the dominant trend, potential support and resistance levels, and overbought or oversold conditions.
- Core Strategies: Key approaches include trend-following within the channel, playing mean reversions from the outer bands, and trading breakouts.
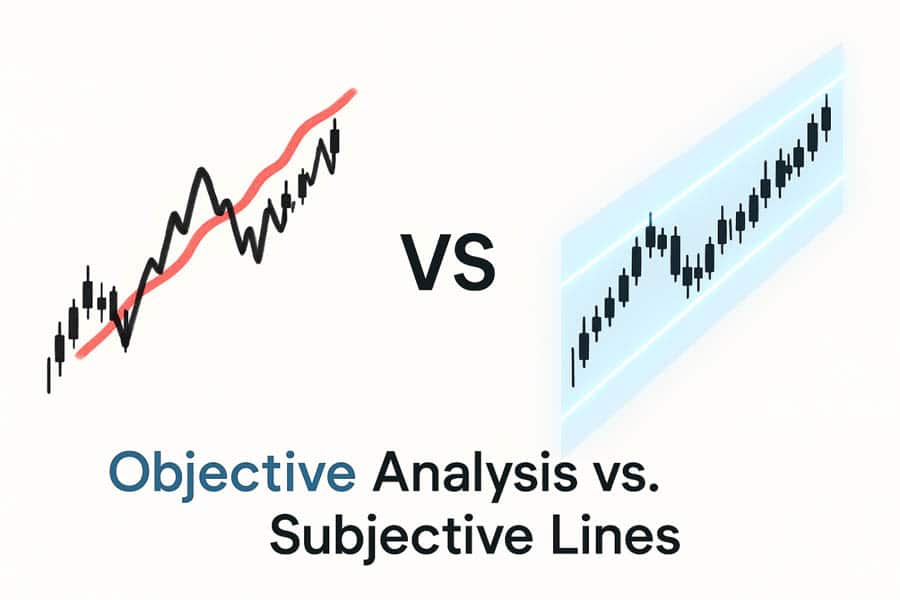
- Key Advantage: Its statistical foundation provides a more objective and adaptive way to view price channels compared to manually drawn trendlines.
- Risk is Key: Success with a regression trading strategy hinges on robust risk management, including proper stop-loss placement and dynamic position sizing.
What Is Regression Channel Trading Strategy?
At its heart, a Regression Channel Trading Strategy is about identifying the path of least resistance for price. It moves beyond simple, subjective trendlines by applying a statistical framework to the chart. Think of it as an intelligent, data-driven channel that automatically calculates the trend’s centerline and its probable boundaries. This provides a clearer, less biased view of market momentum and potential reversal points. For traders, this means more confidence in identifying where to enter, where to place stops, and when to take profits.
Why Use This Strategy?
The main appeal lies in its objectivity. Drawing trendlines can be a subjective art, varying from one trader to the next. The regression channel indicator, however, uses a mathematical formula—linear regression—to find the median price path. The outer bands, based on standard deviation, then map out the expected range of price volatility around that median line. This removes guesswork and provides a statistically significant trading channel.
Read More: Identifying Support and Resistance in Forex
Who Should Use This Strategy?
This strategy is versatile and can be adapted by various types of traders.
- Beginners appreciate it for its clear visual cues for trend direction and support/resistance.
- Swing traders find it invaluable for capturing price swings within an established trend over days or weeks.
- Day traders can apply it to shorter timeframes to trade momentum and mean-reversion setups.
- Systematic traders can use it to build objective, rule-based trading systems.
When Does It Work Best?
From my experience, the Regression Channel Trading Strategy performs exceptionally well in markets that are in a clear, sustained trend—whether up or down. It helps traders stay with the trend and avoid exiting too early. It is less effective in choppy, sideways markets where there is no discernible directional bias. During periods of extremely high volatility, such as major news events, the price can overshoot the channels, so it’s wise to be cautious at those times.
How to Draw Regression Channels Precisely
Understanding the core principles of the regression channel is the first step, but its practical application hinges on setting it up correctly on your charting platform. The tool is designed to do the heavy lifting, but your inputs determine its relevance.
Regression Channels vs. Traditional Trendlines
A traditional trendline is drawn by connecting two or more swing lows in an uptrend or two or more swing highs in a downtrend. It’s a manual process and highly subjective. Two traders can look at the same chart and draw slightly different trendlines. A regression channel, on the other hand, is calculated automatically. You select a starting point and an ending point, and the software computes the linear regression trading strategy line that best fits all the prices in between. The channel lines are then drawn parallel to it. This statistical approach ensures consistency.
The Statistical Foundation
The channel is built on two key statistical concepts:
- Linear Regression: This is the middle line of the channel. It’s essentially the “line of best fit” for the price data over a selected period. It represents the equilibrium or mean price.
- Standard Deviation: This determines the width of the channel. The upper and lower channel lines are typically set at one or two standard deviations away from the central regression line. A setting of two standard deviations, for example, means that statistically, about 95% of the price action should be contained within the channel.
Read More: Trendline Scalping Strategy
Best Settings for Regression Channel Indicator
Setting up a regression channel on platforms like TradingView or MetaTrader 4 (MT4) is straightforward. While the “best” settings can depend on the market and timeframe, here are some common starting points:
- Look-back Period: This defines how much data the indicator should analyze. For swing trading on a daily chart, a look-back period of 100 or 200 bars is common. For intraday trading, you might use 50 bars on a 15-minute chart. The key is to select a period that encapsulates the current, dominant trend.
- Deviation Width: The standard deviation setting controls the channel’s width. A setting of ‘2’ is the most common, as it contains roughly 95% of prices. If you’re trading a very volatile asset, you might increase this to 2.5 or 3 to avoid getting stopped out by noise. For less volatile assets, a setting of 1.5 or 1.75 might be more appropriate.
In my experience, it’s best to start with the default settings and then adjust them based on how well the channel fits the historical price action of the specific asset you are analyzing.
Top Regression Trading Strategies Explained
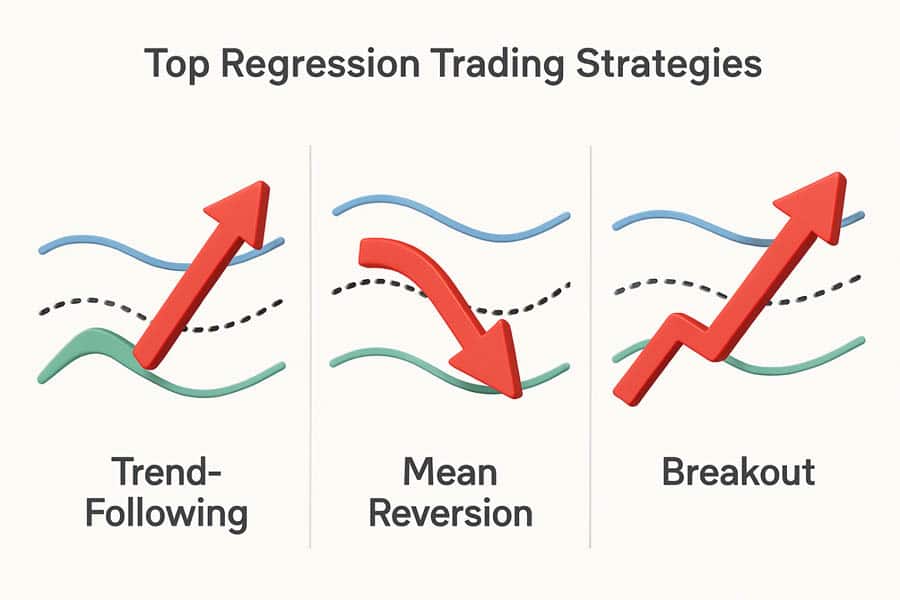
Once you have your channel drawn, you can employ several distinct strategies. The beauty of the Regression Channel Trading Strategy is its adaptability. It can be used for following trends, trading reversals, and even identifying breakouts. Here’s a breakdown of the primary approaches.
Trend-Following within the Channel
This is the most straightforward regression trading strategy. The goal is to trade in the direction of the channel’s slope.
- Entry: In an uptrend (upward-sloping channel), you look for buying opportunities when the price pulls back to touch or approach the lower channel line. In a downtrend (downward-sloping channel), you look for shorting opportunities when the price rallies to the upper channel line.
- Stop Loss: Place your stop loss just outside the channel. For a long trade, it would go below the lower band. For a short trade, it goes above the upper band. This gives your trade room to breathe while defining your risk.
- Profit Target: The profit target is typically the opposite side of the channel. If you buy at the lower band, your initial target would be the upper band. Some traders take partial profits at the median line as well.
Mean Reversion at Channel Extremes
This strategy is based on the principle that price will tend to revert to its mean (the central regression line) after reaching an extreme. It’s essentially a bet that the outer bands will act as support or resistance.
- Entry: When the price touches the upper band in a well-established channel, it’s considered overbought, presenting a potential short (sell) signal. Conversely, when it touches the lower band, it’s considered oversold, offering a potential long (buy) signal.
- Confirmation: It’s wise to wait for confirmation before entering. This could be a bearish candlestick pattern (like an engulfing bar or a pin bar) at the upper band, or a bullish one at the lower band.
- Profit Target: The primary target for a mean reversion trade is the central linear regression line.
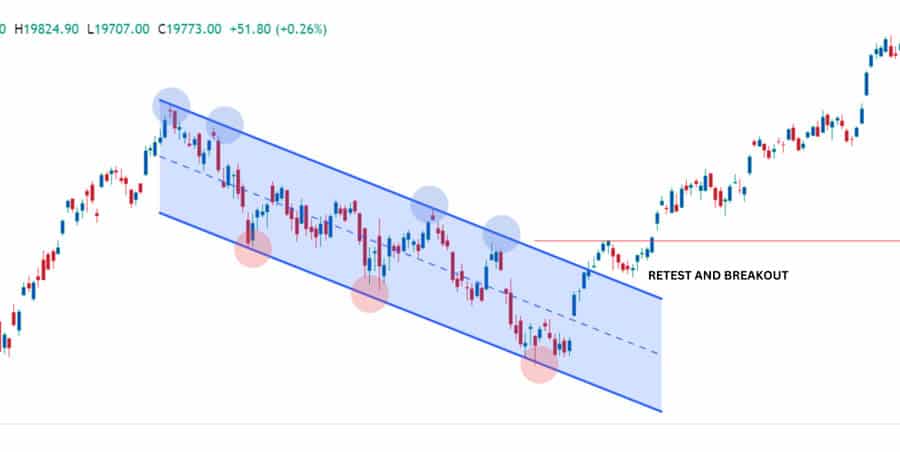
Breakout Plays: Trading Channel Exits
Sometimes, the price doesn’t respect the channel boundaries. A sustained move outside the channel can signal the start of a new, stronger trend.
- Entry: A breakout trade is entered when the price closes decisively outside the channel. For example, a close above the upper channel line could signal a long entry.
- Filtering Fakeouts: Breakouts can be deceptive. A common mistake is trading every breach of the channel. To filter out “fakeouts,” look for confirmation. High volume on the breakout candle is a strong sign of conviction. Another technique is to wait for a pullback to the broken channel line, which should now act as support (in an upside breakout) or resistance (in a downside breakout).
Read More: Trend-Following Strategy
Combining Regression Channels with Other Tools
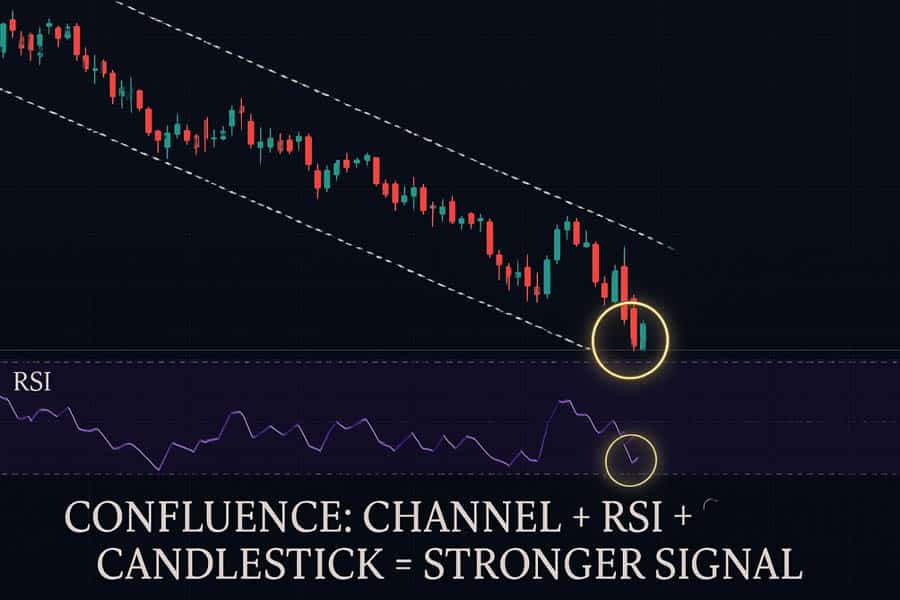
While a Regression Channel Trading Strategy is powerful on its own, its predictive accuracy can be significantly enhanced when used in conjunction with other technical indicators. This practice, known as confluence, involves looking for multiple signals that align, giving you a stronger reason to place a trade.
Confirming Signals with RSI, MACD, or Volume
Confirmation is key to avoiding false signals. Here’s how you can use popular indicators to validate a regression channel setup:
- Relative Strength Index (RSI): The RSI is a momentum oscillator that measures the speed and change of price movements. When the price hits the upper regression channel band, you can check the RSI. If the RSI is in overbought territory (typically above 70), it strengthens the case for a mean reversion (sell) trade. Even more powerful is bearish divergence, where the price makes a new high but the RSI makes a lower high. This suggests that the upward momentum is fading and a reversal is likely. The opposite is true for buys at the lower band.
- Moving Average Convergence Divergence (MACD): The MACD can help confirm trend direction and momentum. In a trend-following setup, if you’re looking to buy a pullback to the lower band of an upward-sloping channel, you would want to see the MACD line above the signal line and preferably above the zero line, confirming bullish momentum. A bearish crossover in the MACD near the upper channel band can serve as a great confirmation for a short trade.
- Volume: Volume is a critical tool for confirming breakouts. A breakout from a regression channel on low volume is often a trap (a fakeout). A genuine breakout, however, is almost always accompanied by a significant spike in volume. This indicates strong participation and conviction behind the move, increasing the probability that the new trend will sustain itself.
Using Multiple Channels for Deeper Analysis
A more advanced technique involves using “nested” regression channels. This means drawing a shorter-term channel inside a longer-term one.
- Intraday vs. Multi-week Analysis: For example, you might have a 200-period regression channel indicator on a daily chart to identify the major trend. Within that, you could use a 50-period channel on a 4-hour chart to time your entries and exits. A buying opportunity would arise when the price pulls back to the lower band of both the daily and the 4-hour channels, creating a high-probability confluence zone.
Regression Channel Risk Management Tactics
No trading strategy is complete without a robust risk management plan. The dynamic nature of the regression channel indicator allows for equally dynamic risk management tactics. Protecting your capital is paramount, and these channels provide a logical framework for doing so.
Dynamic Position Sizing
The width of the regression channel is a direct measure of market volatility. A widening channel indicates increasing volatility, while a narrowing channel suggests volatility is decreasing. You can use this information to adjust your position size.
- Wider Channels: In a wide channel, the distance from your entry point to your stop loss (placed outside the channel) will be larger. To maintain a consistent risk percentage (e.g., 1% of your account per trade), you should use a smaller position size.
- Narrower Channels: In a narrow, low-volatility channel, your stop loss will be much tighter. This allows you to use a larger position size while still risking the same percentage of your capital. This dynamic approach ensures your risk remains constant regardless of market conditions.
Layering Stop Losses
The lines of the regression channel provide clear, logical levels for placing and trailing your stop losses.
- Initial Stop: As discussed, your initial stop loss should always be placed just outside the opposite channel line from your entry.
- Trailing Stop: Once the trade moves in your favor, you can trail your stop loss to reduce risk. For example, in a long trade initiated at the lower band, once the price crosses the median regression line, you can move your stop loss to your entry point, making the trade risk-free. Some traders will then trail their stop just below the median line, or even just below the lower channel line, to ride the trend for as long as possible. This is a core part of a successful linear regression trading strategy.
Advanced Regression Trading: Tips and Traps
To truly master the Regression Channel Trading Strategy, you need to be aware of its nuances and the common pitfalls that can trap inexperienced traders. These advanced tips are based on practical experience and can help you avoid costly mistakes.
When to Redraw or Discard a Channel
A regression channel is not a “set and forget” tool. The market is dynamic, and your channels must be too.
- Redrawing: You should update or redraw your channel when the market structure clearly changes. For example, if the price breaks out of a channel and then starts to form a new trend at a different angle, it’s time to draw a new channel that reflects this new reality. A good rule of thumb is to re-evaluate your channels at the start of each trading week.
- Discarding: If a channel is repeatedly being violated with no clear logic, or if the market has devolved into a directionless, choppy mess, the channel is no longer useful. Trying to force a channel onto a market that isn’t trending is a recipe for losses. In such cases, it’s better to discard the channel and wait for a clearer trend to emerge.
Interpreting the Slope and Width
The channel itself tells a story.
- Slope: The steepness of the channel’s slope indicates the trend’s strength. A steep slope signals strong momentum, while a shallow slope indicates a weaker, slower trend. A flattening slope can be an early warning that a trend is losing steam and may be about to reverse.
- Expansion/Contraction: As mentioned, the channel’s width reflects volatility. A channel that is expanding (getting wider) indicates that volatility is increasing. This often happens in the later stages of a trend. A channel that is contracting (getting narrower) shows that volatility is drying up. This often precedes a significant breakout, as the market coils up before its next major move.
Avoiding Overfitting
A major pitfall in technical analysis is “overfitting” or “curve fitting.” This happens when you adjust an indicator’s settings so that it perfectly explains past price action, but fails miserably in real-time trading. With a regression channel indicator, this means constantly tweaking the look-back period and deviation settings to create the “perfect” channel on historical data. To avoid this, select a set of standard settings and stick with them across different markets and timeframes. The goal is not to create a perfect historical fit, but to find a robust setting that works consistently going forward.
Regression Channel Strategy: Real-World Case Study
Let’s walk through a hypothetical but realistic example of a Regression Channel Trading Strategy in the Forex market.
Asset: EUR/USD
Timeframe: 4-Hour Chart
Setup: The EUR/USD has been in a clear downtrend for several weeks. We apply a 100-period regression channel with a 2-standard deviation setting. The channel is sloping downwards, confirming the bearish trend.
The Trade:
- Signal: The price rallies up and touches the upper band of the regression channel. This is our area of interest for a short entry, in line with the dominant trend.
- Confirmation: We don’t enter immediately. We wait for confirmation. A bearish engulfing candle forms right at the upper channel line. At the same time, we check the RSI, which is showing a reading of 68, near overbought territory. This confluence of signals gives us the confidence to enter the trade.
- Entry: We place a short (sell) order at the close of the bearish engulfing candle.
- Stop Loss: Our stop loss is placed just above the recent swing high and outside the upper channel line. This defines our maximum risk.
- Profit Targets: We set two profit targets. The first is at the median regression line. When the price hits this level, we close half of our position and move our stop loss to our entry price, making the rest of the trade risk-free. Our second profit target is at the lower band of the regression channel.
Outcome: The price moves down, hitting our first target. We secure partial profits. The downtrend continues, and the price eventually reaches the lower channel band, hitting our second target and closing the trade for a significant profit. This case study illustrates a classic trend-following setup using the regression trading strategy, enhanced with candlestick and oscillator confirmation.
Trade with an Edge at Opofinance
Elevate your trading with a broker that provides superior tools and security. Opofinance, regulated by ASIC, offers a premium trading environment for all levels of traders.
- Advanced Trading Platforms: Choose from MT4, MT5, cTrader, and the proprietary OpoTrade platform.
- Innovative AI Tools: Gain insights with our AI Market Analyzer, get personalized guidance from an AI Coach, and receive instant help from AI Support.
- Flexible Trading Options: Explore opportunities in Social & Prop Trading.
- Secure & Flexible Transactions: Enjoy safe and convenient deposits and withdrawals, including crypto payments with zero fees.
Start Trading with Opofinance Today
Conclusion
The Regression Channel Trading Strategy offers a robust, statistical, and visually intuitive way to engage with the financial markets. By moving beyond subjective trendlines, it provides a more objective framework for identifying trend direction, volatility, and high-probability entry and exit points. Whether you prefer trend-following, mean reversion, or breakout trading, this versatile tool can be adapted to your style. Remember, its effectiveness is magnified when combined with other indicators and, most importantly, a disciplined approach to risk management.
Is linear regression good for day trading?
Yes, a linear regression trading strategy can be very effective for day trading. By applying the channel to shorter timeframes (like the 5-minute or 15-minute charts), it can help identify intraday trends and key levels for scalping or mean reversion trades.
What is the difference between a regression channel and Bollinger Bands?
While both create channels based on volatility, a regression channel’s centerline is a linear regression trendline, making it directional. Bollinger Bands use a simple moving average as their centerline, which is less responsive to the trend’s direction and more focused on volatility breakouts.
How do I automate a regression channel strategy?
Automation is possible on platforms like MT4/MT5 or TradingView using their respective programming languages (MQL4/MQL5 and Pine Script). You can code an expert advisor or script to automatically identify channel touches or breakouts and execute trades based on your predefined rules.
Can this strategy be used for stocks and crypto?
Absolutely. The Regression Channel Trading Strategy is universal and can be applied to any market that trends, including individual stocks, indices, and cryptocurrencies. The principles of trend, volatility, and mean reversion are consistent across all asset classes.
How reliable are the signals from a regression channel?
The reliability of the signals is highest in clearly trending markets. In sideways or chaotic markets, its reliability decreases. That’s why it is crucial to first assess the overall market condition and to use confirmation from other indicators to filter out lower-probability signals.


