

If you’re an active trader, you know the quest for a reliable trading strategy can feel endless. You jump from one indicator to the next, hoping for that ‘aha’ moment. Let me tell you, the most robust systems aren’t magic formulas; they’re a smart fusion of proven concepts. The RSI and Fibonacci strategy is exactly that—a powerful, rules-based system designed to pinpoint high-probability pullback trades.
It’s not about predicting; it’s about reacting to market psychology with a precise framework. For traders like us who demand clarity, especially when working with a regulated forex broker, this specific RSI and Fibonacci strategy provides a clear blueprint. In this guide, we’ll deconstruct it piece by piece, turning it into a checklist you can execute with confidence.
Key Takeaways
- Trade with the Trend: The 200-period SMA is your non-negotiable trend filter. Only hunt for long trades above it and short trades below it. This is the first rule I never break.
- Identify the “Golden Zone”: The 50% to 61.8% Fibonacci retracement levels are your high-probability entry map. This is where you patiently wait for the price to come to you.
- Use an Extreme Trigger: A 2-period RSI is your entry signal. An RSI reading below 10 in an uptrend or above 90 in a downtrend screams that a “snap-back” is imminent.
- Systematic Execution: This RSI and Fibonacci strategy is built on a strict, four-rule system. It’s designed to remove your guesswork and emotional baggage from trading.
- Defined Risk and Exits: Every trade has a pre-planned stop-loss and a primary take-profit target. This ensures you have a complete plan before you ever risk a single dollar.
A Tested Mean-Reversion Strategy
At its heart, this entire RSI and Fibonacci strategy is a mean-reversion system. From my experience, some of the most reliable trades come from this concept. Mean reversion is built on a simple observation: prices, after making an extreme move, tend to snap back toward their long-term average. We aren’t trying to be heroes by catching the absolute bottom or top. Instead, we’re strategically waiting for a healthy correction within a bigger trend and joining the party right when the pullback shows signs of exhaustion. It’s a much smarter way to trade.
Introducing the RSI-2 Strategy (Larry Connors)
The momentum trigger for our strategy comes from the brilliant work of quantitative trader Larry Connors. He championed the use of a hyper-sensitive 2-period RSI. Forget the standard 14-period RSI you might be used to; the RSI(2) has a different job. Its purpose is to find those extreme, short-term flashes of panic or euphoria. Connors discovered that in a strong uptrend, a violent two-day drop that slammed the RSI(2) below 10 was often the perfect precursor to a powerful “snap-back” rally. We’ve adopted this potent trigger for our own RSI and Fibonacci strategy.
Why This Strategy Works: The Psychology of Pullbacks
To really trust a strategy, you have to understand the ‘why’ behind it. Markets don’t move in straight lines because they are driven by fear and greed. During a strong uptrend, you’ll see periods of profit-taking and fear that cause pullbacks. This is where weak-handed traders get scared and sell, creating a dip. Meanwhile, the patient, strong-handed traders who missed the first move are seeing a discount and waiting to pounce. This dynamic creates a battleground where selling momentum eventually fizzles out, and the primary trend powerfully resumes. Our entire fibonacci and rsi strategy is engineered to give us a signal right at that turning point.
Supercharging the Strategy with Fibonacci for Precision
The RSI(2) is fantastic at telling us when a pullback is overextended, but it doesn’t tell us where this is likely to happen. This is the missing piece of the puzzle for many traders, and it’s where the Fibonacci retracement tool becomes our best friend. By overlaying Fibonacci levels, we give the RSI-2 concept a crucial layer of context. We are no longer just reacting to an oversold RSI anywhere on the chart. We are demanding that this signal occurs at a mathematically significant support zone. This fusion is what elevates a good idea into a great, high-probability RSI and Fibonacci strategy.
Read More: The Fibonacci Strategy In Forex
The Strategic Roles of Our Tools
For this system to work like a well-oiled machine, each tool has a specific, non-negotiable job. I want you to think of it like a special ops team: the General sets the overarching strategy, the Mapmaker identifies the target location, and the Scout on the ground gives the final “go” signal. When every part does its job, the mission is a success. This is how you should view the components of this RSI and Fibonacci strategy.
The 200-Period SMA: The Trend Filter

The 200-period Simple Moving Average (SMA) is our “General.” Its role is singular and absolute: it tells us which way the war is going, and we only fight in that direction. If the price is above the 200 SMA, the primary trend is up, and we are only authorized to look for BUY setups. Period. If the price is below the 200 SMA, the market is bearish, and we only have permission to seek SELL setups. In my trading, trying to fight the 200 SMA is a losing proposition. This one rule keeps you on the right side of the market’s powerful momentum.
Fibonacci Retracement: The Entry Zone Map

The Fibonacci retracement tool is our “Map.” Once our General (the 200 SMA) has given us our direction, we use Fibonacci to pinpoint the high-probability ambush point. We focus on what I call the “golden pocket” between the 50% and 61.8% retracement levels. After a strong move up or down, we draw the tool to map the resulting correction. This zone isn’t magic, but it represents a deep enough pullback to attract value buyers (or sellers) without jeopardizing the overall trend structure. It’s the location where we expect the battle to turn.
The 2-Period RSI: The Extreme Momentum Trigger
The 2-period RSI is our “Scout.” This is our boots-on-the-ground trigger that gives us the final go-ahead. Its extreme sensitivity is exactly what we need. In an uptrend, as price pulls back into our Fibonacci “golden zone,” we wait for our Scout to yell that the sellers are exhausted. That signal is the RSI(2) dropping below 10. For a short trade, we need the RSI(2) to spike above 90. This is the final, critical confirmation that makes this RSI and Fibonacci strategy so precise.
The Core Strategy: A Rules-Based Blueprint
Alright, this next part is where the rubber meets the road. I’m going to lay out the non-negotiable, sequential rules for executing trades. For this RSI and Fibonacci strategy to deliver results, you must follow every single rule, in order, every single time. There are no “maybes.” Think of this as the pre-flight checklist that a pilot runs through. It’s what ensures discipline and keeps emotion out of the cockpit.
The High-Probability BUY Setup
This is our bread-and-butter setup for catching a dip in a powerful, long-term uptrend.
Rule 1 (The Trend):
Price must be trading above the 200-period SMA. This is your first go/no-go filter. If it’s not met, you close the chart and walk away.
Rule 2 (The Pullback Zone):
Identify the most recent clear swing low and swing high to draw your Fibonacci retracement. Price must then correct downwards to touch or trade within the zone between the 50% and 61.8% levels.
Rule 3 (The Extreme Trigger):
While the price is trading inside that Fibonacci zone, the 2-period RSI must plunge below 10. This is the confirmation that the pullback is at a point of extreme panic.
Rule 4 (The Entry):
Once rules 1-3 are ticked off, enter a LONG (buy) position near the close of the candle where the RSI(2) registered its sub-10 reading.
The High-Probability SELL Setup
This is the mirror image, designed to capitalize on a short-lived “sucker rally” in a dominant downtrend.
Rule 1 (The Trend):
Price must be trading below the 200-period SMA. This confirms the bears are in control and gives you permission to look for short entries.
Rule 2 (The Pullback Zone):
Identify the most recent clear swing high and swing low to draw your Fibonacci retracement. The price must then rally upwards to touch or trade within the 50%-61.8% resistance zone.
Rule 3 (The Extreme Trigger):
While the price is in this Fib resistance zone, the 2-period RSI must spike above 90. This signals extreme, unsustainable greed within the context of a downtrend.
Rule 4 (The Entry):
With all three conditions met, enter a SHORT (sell) position near the close of the candle where the RSI(2) registered its 90+ reading.
Read More: Fibonacci retracement in forex
Execution Blueprint: A Step-by-Step Trade Walkthrough
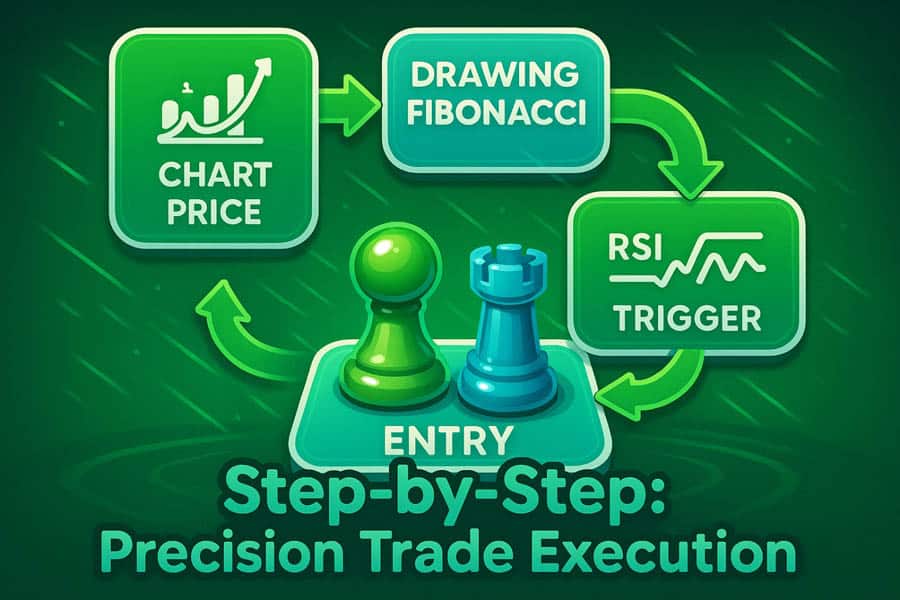
Let’s make this real. I’ll walk you through a hypothetical BUY setup on a daily chart so you can visualize how this fibonacci and rsi strategy unfolds in real-time. Let’s pretend we’re looking at the GBP/JPY pair.
Chart: Confirming the Long-Term Uptrend
First things first, we apply the 200 SMA to our daily chart. We see that GBP/JPY is cruising comfortably above the 200 SMA, which is pointing upwards. Rule #1 is a check. Our bias is now “buys only.” We spot that the price just hit a new high at 191.00 after a strong run up from a low of 185.00.
Chart: Identifying the Pullback to the Fibonacci “Golden Zone”
Now, we grab our Fibonacci retracement tool. We click on the 185.00 swing low and drag it up to the 191.00 swing high. The tool instantly plots our key levels. The 50% level comes in at 188.00, and the 61.8% level is at 187.29. This 71-pip area is our “golden zone.” We now sit back and patiently watch as the price starts its inevitable pullback over the next few days, heading right for our zone.
Chart: The RSI(2) Drops Below 10 – The Signal is Armed
Our eyes are now glued to the 2-period RSI window below the price chart. The price enters our Fib zone. On the third day of the pullback, the candle pushes down to 187.80. At that exact moment, we see the RSI(2) line take a nosedive, hitting a value of 7.2. That’s it. That’s our signal. The price is in the zone, and the momentum trigger confirms extreme selling pressure. All our conditions for a high-probability trade are met.
Chart: Executing the Entry, Stop-Loss, and Take-Profit
With our trigger confirmed, we execute. Near the close of that daily candle, we enter a long position. The very next thing we do—before anything else—is set our risk parameters. A conservative stop-loss goes just below the 61.8% level, maybe at 187.15. Our primary profit target, following the rules of this mean-reversion RSI and Fibonacci strategy, is set at the current level of the 200 SMA. The entire trade is now planned and managed.
Essential Risk and Exit Strategy
Let me be blunt: a great entry signal is worthless if you don’t know how to manage the trade and when to get out. This part is not optional. The exit plan for this RSI and Fibonacci strategy is just as important as the entry. Remember, we are here to capture a specific, high-probability move, not to marry the trade.
Stop-Loss Placement
Your stop-loss is your get-out-of-jail-free card. It’s the point where you admit the trade idea was wrong and you live to fight another day. The logic here is tied directly to the Fibonacci levels that got you into the trade in the first place.
Rule: Place your stop-loss just below the low of the entry candle. For a more conservative stop, which I often prefer, place it just below the 61.8% Fibonacci level. A clean break of that 61.8% level tells you the pullback isn’t a pullback anymore; it’s a potential reversal, and your reason for being in the trade is gone.
Take-Profit Strategy
You must match your exit strategy to your entry strategy. We entered because we expected a “snap back” to the average. So, that’s where we should be looking to exit. Greed is a killer in this game.
Rule (Mean Reversion Exit): The primary take-profit target is the 200-period SMA itself. Once the price rallies (on a long trade) or drops (on a short trade) back to touch that moving average, the trade has done its job. I’ve seen too many traders get greedy, hoping for more, only to watch the price reverse again. Close the position, bank the profit, and look for the next clean setup.
Read More: What is RSI Indicator
Mastering the Strategy: Discipline and Nuance
Knowing the rules of the RSI and Fibonacci strategy is the easy part. Executing them flawlessly, especially when the market is trying to psych you out, is where mastery is forged. From my years of trading and mentoring, I can tell you that success with any system, including this one, boils down to a few core principles.
Why Patience is Key: Waiting for the “A+” Setup
The single biggest threat to this strategy’s profitability is impatience. I see it all the time. A trader sees two of the three conditions align and they jump the gun. An RSI below 10 means nothing if the price is miles away from the Fib zone. A perfect touch of the 61.8% level is not a signal without the RSI trigger confirming exhaustion. You must have the discipline to wait for the perfect confluence of Trend, Zone, and Trigger. These A+ setups are the only ones worth your capital.
The Importance of Backtesting This System Yourself
Please do not take this strategy (or any strategy) and immediately start trading it with real money. The most critical step is to do your own homework. Go back in time on your charts. Manually find every single setup where the rules of this fibonacci and rsi strategy were met. Log the results. This builds something far more valuable than profit: it builds unshakeable confidence in your system, so you won’t hesitate when a real A+ setup appears.
Common Pitfalls: Taking signals against the 200 SMA trend, ignoring Fibonacci levels.
Let me save you some pain by highlighting the two cardinal sins of this system. The first is fighting the 200 SMA. You’ll get a low RSI reading in what looks like a pullback, but if the price is below the 200 SMA, you’re trying to catch a falling knife. Don’t do it. The second sin is taking an RSI signal without the Fibonacci confirmation. The RSI(2) will give many extreme readings; the ones that matter for this RSI and Fibonacci strategy are those that occur inside our golden zone. Avoid these two mistakes, and you are already ahead of the pack.
Opofinance Services
To effectively execute a precise methodology like the RSI and Fibonacci strategy, your choice of broker matters immensely. You need a partner that provides professional tools in a secure environment. For traders seeking that combination, Opofinance is a standout choice.
- ASIC Regulated Security: Trade with the confidence that comes from using a broker regulated by a top-tier authority, ensuring a foundation of safety for your funds.
- Advanced Trading Platforms: Whether you’re a fan of MT4, MT5, cTrader, or the intuitive OpoTrade platform, you have access to the industry’s best charting and execution tools.
- Innovative AI Tools: Get a serious edge with a suite of AI-driven features. Use the AI Market Analyzer for opportunity scanning, the AI Coach to refine your skills, and AI Support for quick help.
- Social & Prop Trading: Broaden your horizons with integrated social trading to learn from others, and explore their prop trading program for a chance to trade with firm capital.
- Secure & Flexible Transactions: Enjoy hassle-free banking with safe and convenient deposit/withdrawal methods, including modern options like crypto payments, all with zero fees from Opofinance.

Explore the Opofinance Platform Today!
Conclusion
The RSI and Fibonacci strategy, when you commit to its rules, is a truly formidable framework for active trading. By methodically layering a macro trend filter (200 SMA), a precision entry zone (Fibonacci 50%-61.8%), and an extreme momentum trigger (RSI(2)), you effectively strip the emotion and guesswork from your decisions. Its power isn’t in one indicator, but in the disciplined confluence of all three. While no system wins 100% of the time, this robust RSI and Fibonacci strategy gives you a clear, repeatable edge. Your success will ultimately be a mirror of your patience and your discipline.
What is the best timeframe for the RSI and Fibonacci strategy?
This strategy is highly adaptable. I’ve seen it work effectively on everything from 15-minute charts for day trading to daily charts for swing trades. The key isn’t the timeframe itself, but your consistency in applying all the tools (SMA, Fib, RSI) to that one timeframe.
Can this trading strategy be fully automated?
Absolutely. Because the rules are so black-and-white, this is a perfect candidate for automation. If you have the skills, you could code an Expert Advisor (EA) or a script that scans and executes trades the moment all four rules are met, removing the human element entirely.
How do I draw the Fibonacci retracement correctly for this strategy?
It’s simple. In an uptrend (price > 200 SMA), find the last major swing low and draw up to the most recent swing high. In a downtrend (price < 200 SMA), find the last major swing high and draw down to the most recent swing low. You’re always drawing in the direction of the primary trend.
What if the RSI(2) hits an extreme level before the price reaches the Fibonacci zone?
In my playbook, that’s not a valid signal. The sequence is critical. The price must first enter our 50%-61.8% zone. Then, while it’s in that zone, the RSI must hit its extreme level. Any other order is a no-trade.
Does this strategy work well in all market conditions?
This strategy is a trend-trader’s tool. It thrives in markets with a clear direction and healthy pullbacks. It will struggle in choppy, sideways markets where the price is just tangled around the 200 SMA. Knowing when to apply the strategy is as important as knowing the rules.


