

The forex market, known for its high liquidity and dynamic nature, offers numerous opportunities for traders. Among the various strategies used to navigate this complex landscape, the Fibonacci strategy in forex trading stands out for its simplicity and effectiveness. Rooted in the mathematical principles of the Fibonacci sequence, this strategy leverages key retracement levels to identify potential entry and exit points in the market. In this comprehensive guide, we will delve deep into the Fibonacci strategy in forex trading, explore its foundations, applications, and limitations, and provide practical examples to help traders of all experience levels effectively implement it in their trading plans with the support of a trusted forex broker.

Understanding the Fibonacci Sequence
What is the Fibonacci Sequence?
The Fibonacci sequence is a series of numbers where each number is the sum of the two preceding ones, typically starting with 0 and 1. This sequence was introduced to the Western world by the Italian mathematician Leonardo of Pisa, known as Fibonacci, in his 1202 book “Liber Abaci.” The sequence is as follows: 0, 1, 1, 2, 3, 5, 8, 13, 21, 34, 55, 89, 144, and so on.
Mathematical Properties of the Fibonacci Sequence
One of the most intriguing aspects of the Fibonacci sequence is its relationship with the golden ratio, approximately 1.618. As the numbers in the sequence increase, the ratio of consecutive numbers approaches the golden ratio. For instance, dividing a number in the sequence by its preceding number (e.g., 144/89) yields a value close to 1.618.
The Fibonacci sequence and the golden ratio have numerous applications in nature, art, architecture, and financial markets. In forex trading, these principles are applied to identify potential support and resistance levels, helping traders predict price movements.
Fibonacci in Forex Trading
The Role of Fibonacci Retracement Levels
The Fibonacci strategy in forex trading involves using Fibonacci retracement levels to identify potential reversal points in the market. These levels are derived from the Fibonacci sequence and are represented as percentages of the price move: 23.6%, 38.2%, 50%, 61.8%, and 100%. By analyzing these levels, traders can determine where the price is likely to retrace before resuming the direction of the prevailing trend.
Applying Fibonacci Retracement Levels
To apply Fibonacci retracement levels effectively, traders follow these steps:
- Identify the Trend: Determine the direction of the prevailing trend. This can be done using trendlines, moving averages, or other trend-following indicators.
- Select Significant High and Low: Choose a significant high and low point that represents a major movement in the market.
- Draw Fibonacci Levels: Use the Fibonacci retracement tool available in most trading platforms to draw levels from the high to the low (for a downtrend) or from the low to the high (for an uptrend).
- Analyze Price Action: Observe how the price reacts to these levels. If the price retraces to a Fibonacci level and then continues in the direction of the trend, it indicates that the level is significant.
Read More: Fundamental Analysis in Forex
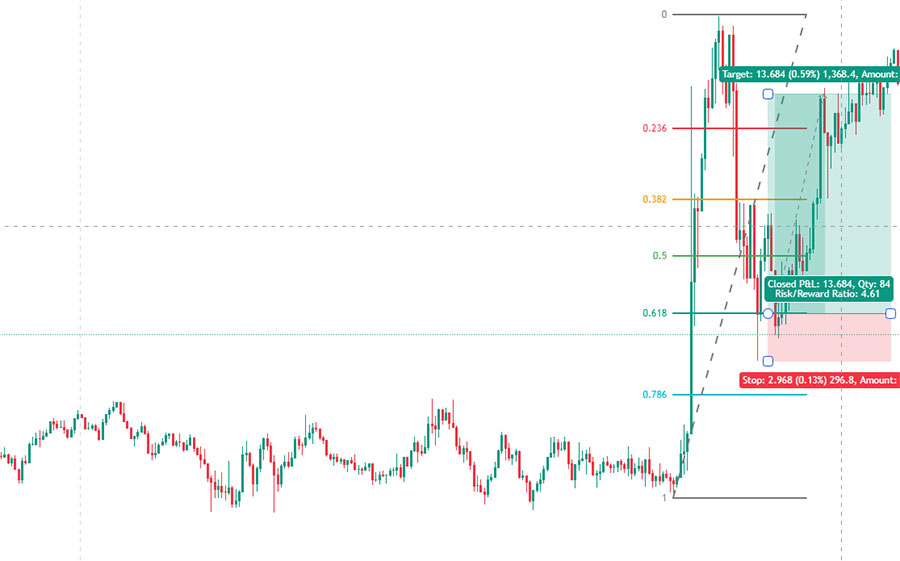
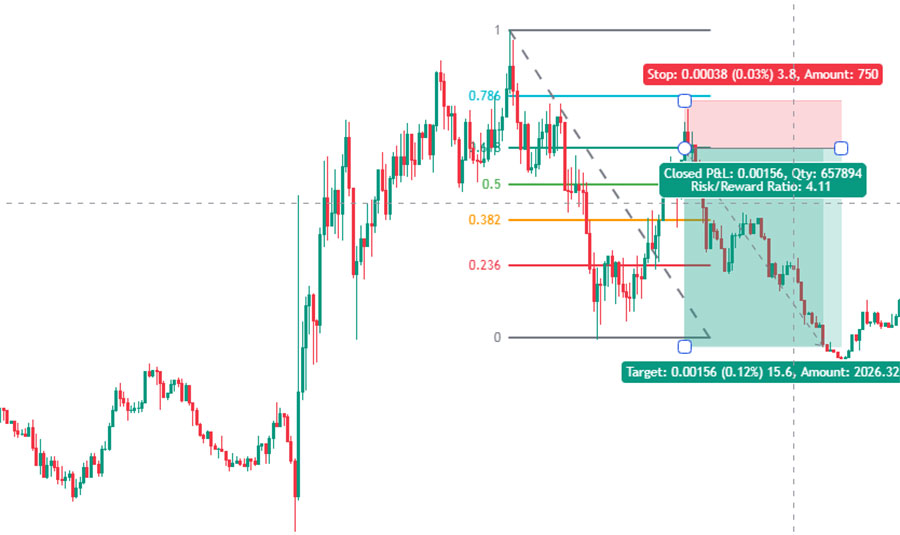
Key Fibonacci Retracement Levels
Fibonacci retracement levels are key technical analysis tools used to identify potential reversal points in the market. These levels are derived from the Fibonacci sequence and are expressed as percentages of the price move: 23.6%, 38.2%, 50%, 61.8%, and 100%. Traders use these levels to determine where the price might retrace before resuming the direction of the underlying trend.
23.6% Retracement Level
This level suggests a shallow retracement, indicating that the trend is strong. Traders might expect minor pullbacks to this level before the price continues in the direction of the trend.
38.2% Retracement Level
This moderate retracement level often acts as significant support or resistance. A retracement to this level indicates a healthy correction within the trend, providing potential entry points.
50% Retracement Level
Although not a Fibonacci number, the 50% level is widely used by traders. It represents a significant psychological point where traders often expect a reversal. This level is also aligned with the Dow Theory’s assertion that markets often retrace half of their prior movement.
61.8% Retracement Level
Known as the “golden ratio,” this deep retracement level often serves as strong support or resistance. A retracement to this level indicates a significant pullback, but the trend may still be intact.
100% Retracement Level
This level signifies a complete reversal of the initial move. If the price reaches this level, it suggests that the trend may have reversed entirely.
Identifying Support and Resistance with Fibonacci
Fibonacci retracement levels are instrumental in identifying potential support and resistance zones in the forex market. These levels can be plotted by selecting a significant high and low on a price chart and drawing the Fibonacci retracement tool between these two points. The resulting horizontal lines at the key Fibonacci levels indicate where the price might find support during a downtrend or resistance during an uptrend.
Read More: Techniques for Timely Entry and Exit in Forex
Practical Application
To apply Fibonacci retracement levels effectively, traders can follow these steps:
- Identify the Trend: The first step is to determine the prevailing trend direction by analyzing the price action. Traders can use trendlines, moving averages, or other trend-following indicators to confirm the trend.
- Select Significant High and Low: Choose a significant high and low point that represents a major movement in the market. This could be a swing high and swing low or the highest and lowest points over a specific period.
- Draw Fibonacci Levels: Use the Fibonacci retracement tool available in most trading platforms to draw levels from the high to the low (for a downtrend) or from the low to the high (for an uptrend).
- Analyze Price Action: Observe how the price reacts to these levels. If the price retraces to a Fibonacci level and then continues in the direction of the trend, it indicates that the level is significant. Traders should look for confirmation signals such as candlestick patterns or other technical indicators.
Read More: Trading in Forex
Integrating Fibonacci with Fundamental Analysis
While Fibonacci retracement levels are a powerful tool for technical analysis, integrating them with fundamental analysis can provide a more comprehensive trading strategy. Fundamental analysis involves evaluating economic indicators, geopolitical events, and other factors that can impact the forex market.
Trading with Fibonacci
Going Long with Fibonacci
Going long involves entering a buy position in anticipation of the price rising. To go long with Fibonacci, traders look for retracement levels during an uptrend where the price is likely to find support before continuing higher.
- Identify the Uptrend: Confirm the uptrend using trend-following indicators such as moving averages or trendlines.
- Apply Fibonacci Levels: Draw Fibonacci retracement levels from the low to the high of the recent uptrend.
- Watch for Retracement: Monitor the price action as it retraces to one of the key Fibonacci levels (23.6%, 38.2%, 50%, 61.8%).
- Confirmation: Look for bullish confirmation signals such as candlestick patterns (e.g., bullish engulfing, hammer) or other technical indicators.
- Enter Long Position: Enter a long position at the retracement level with a stop-loss placed below the next significant Fibonacci level or a recent low.
- Set Profit Target: Set a profit target based on the next resistance level or use a trailing stop to lock in profits as the price moves in favor.
Going Short with Fibonacci
Going short involves entering a sell position in anticipation of the price falling. To go short with Fibonacci, traders look for retracement levels during a downtrend where the price is likely to find resistance before continuing lower.
- Identify the Downtrend: Confirm the downtrend using trend-following indicators such as moving averages or trendlines.
- Apply Fibonacci Levels: Draw Fibonacci retracement levels from the high to the low of the recent downtrend.
- Watch for Retracement: Monitor the price action as it retraces to one of the key Fibonacci levels (23.6%, 38.2%, 50%, 61.8%).
- Confirmation: Look for bearish confirmation signals such as candlestick patterns (e.g., bearish engulfing, shooting star) or other technical indicators.
- Enter Short Position: Enter a short position at the retracement level with a stop-loss placed above the next significant Fibonacci level or a recent high.
- Set Profit Target: Set a profit target based on the next support level or use a trailing stop to lock in profits as the price moves in favor.
Combining Fibonacci with Moving Averages
Enhancing Signals with Moving Averages
Moving averages are widely used in technical analysis to smooth out price data and identify trends. When combined with Fibonacci retracement levels, moving averages can provide additional confirmation for potential entry and exit points.
Example: Combining Fibonacci and Moving Averages
Suppose the EUR/USD pair is in an uptrend, moving from 1.1000 to 1.2000. The price retraces to the 38.2% Fibonacci level at 1.1764, which coincides with the 50-day moving average.
- Entry Point: 1.1764 (38.2% retracement level and 50-day moving average).
- Stop-Loss: 1.1700 (below the next Fibonacci level at 50% or recent low).
- Profit Target: 1.2000 (previous high) or use a trailing stop to capture further gains.
Using Moving Averages for Trend Confirmation
- Identify Trend Direction: Use moving averages to confirm the direction of the trend. A rising moving average indicates an uptrend, while a falling moving average indicates a downtrend.
- Align with Fibonacci Levels: Look for confluence between the moving average and Fibonacci retracement levels. When both align, it strengthens the signal.
- Enter Trade: Enter a trade when the price retraces to the Fibonacci level and finds support or resistance at the moving average.
- Set Stop-Loss and Take-Profit: Set stop-loss and take-profit levels based on the next significant Fibonacci level or recent high/low.
Practical Application of Moving Averages and Fibonacci
Combining moving averages with Fibonacci retracement levels can enhance the reliability of trading signals. For example, if the price of the USD/JPY pair retraces to the 50% Fibonacci level and coincides with the 200-day moving average, it indicates a strong support level. Traders can enter a long position with greater confidence, anticipating that the price will resume its upward movement.
Read More: Forex Trading Methods
Finding Premium and Discount Levels with Fibonacci
Understanding Premium and Discount Levels
In forex trading, premium and discount levels are used to determine whether the price of an asset is overvalued (premium) or undervalued (discount). These levels help traders make informed decisions about entering or exiting trades.
Applying Fibonacci to Identify Premium and Discount Levels
Fibonacci retracement levels can be used to identify these premium and discount zones:
- Identify the Range: Determine the high and low points of the recent price move.
Apply Fibonacci Levels: Draw Fibonacci retracement levels from the low to the high (for an uptrend) or high to low (for a downtrend) of the range.
- Analyze Retracement Levels: Look for key Fibonacci retracement levels such as 23.6%, 38.2%, 50%, 61.8%, and 78.6%. These levels often indicate potential premium (overvalued) or discount (undervalued) zones.
- Evaluate Price Action: Monitor how the price behaves around these Fibonacci levels. A bounce off a retracement level may indicate that the market perceives the current price as fair (premium or discount level).
- Confirm with Other Indicators: Use additional technical indicators or fundamental analysis to confirm whether the identified level is indeed a premium or discount zone.
Understanding the Limitations
Not a Self-Fulfilling Prophecy
While Fibonacci retracement levels are widely used by traders, they are not a guaranteed predictor of price action. Market dynamics, economic events, and other factors can influence price movements, making it essential to use Fibonacci retracement levels as part of a broader trading strategy rather than relying on them exclusively.
Importance of Risk Management
Effective risk management is crucial for long-term success in forex trading. Using Fibonacci retracement levels can help traders set precise stop-loss and take-profit levels, thereby managing risk more effectively.
Setting Stop-Loss and Take-Profit Levels
- Stop-Loss Placement: Place stop-loss orders below the next significant Fibonacci retracement level (for long positions) or above the next significant Fibonacci retracement level (for short positions). This helps limit potential losses if the trade moves against the trader.
- Take-Profit Placement: Set take-profit orders at key Fibonacci extension levels or previous support/resistance levels. This helps lock in profits at strategic points.
Common Mistakes and How to Avoid Them
Overreliance on Fibonacci Levels
While Fibonacci retracement levels are powerful tools, relying solely on them without considering other factors can lead to poor trading decisions. Traders should always combine Fibonacci analysis with other technical and fundamental analysis tools to get a comprehensive view of the market.
Ignoring Trend Confirmation
Entering trades based solely on Fibonacci levels without confirming the trend can be risky. Traders should use trend-following indicators to confirm the direction of the trend before entering trades based on Fibonacci retracement levels.
Failing to Set Stop-Loss Orders
Not setting stop-loss orders is a common mistake that can lead to significant losses. Traders should always set stop-loss orders at appropriate levels to manage risk effectively.
Conclusion
The Fibonacci strategy in forex trading offers a robust framework for identifying potential entry and exit points in the market. By understanding the Fibonacci sequence and applying retracement levels, traders can gain valuable insights into market dynamics and improve their trading performance. Integrating Fibonacci analysis with other technical indicators, such as moving averages, and considering fundamental factors can further enhance the reliability of trading signals.
While the Fibonacci strategy has its limitations, effective risk management and a comprehensive trading plan can help traders navigate the forex market with greater confidence and success. By avoiding common mistakes and continually refining their approach, traders can leverage the power of Fibonacci retracement levels to achieve consistent profitability in forex trading.
FAQs
What is the significance of the 61.8% Fibonacci retracement level?
The 61.8% Fibonacci retracement level is known as the “golden ratio” and is often considered a strong support or resistance level. In the context of forex trading, a retracement to this level suggests a deep pullback, yet the prevailing trend may still be intact. Traders often look for confirmation signals at this level to enter trades.
How can Fibonacci retracement levels be used in conjunction with trendlines?
Fibonacci retracement levels can be used with trendlines to identify potential reversal points more accurately. By drawing a trendline that aligns with the Fibonacci levels, traders can confirm the strength of support or resistance zones and enhance their trading strategy.
What are the common pitfalls of using Fibonacci retracement levels in forex trading?
Common pitfalls include overreliance on Fibonacci levels without considering other technical indicators, failing to confirm the trend direction, and neglecting to set stop-loss orders. Traders should use Fibonacci retracement levels as part of a broader trading strategy and employ effective risk management practices.
Can Fibonacci retracement levels be applied to any financial market?
Yes, Fibonacci retracement levels can be applied to various financial markets, including forex, stocks, commodities, and cryptocurrencies. The principles of Fibonacci analysis are universal and can help traders identify potential support and resistance levels across different markets.


One Response
Hello! This is my first visit to your blog! We are a team of volunteers and starting a new project in a community in the same niche. Your blog provided us useful information to work on. You have done a wonderful job!