Are you searching for a reliable forex broker while trying to perfect your swing trading strategy? Look no further than the Relative Strength Index (RSI) – a powerhouse indicator that’s revolutionizing how traders capture market swings. The RSI swing trading strategy is a technical analysis approach that uses the Relative Strength Index to identify potential entry and exit points for medium-term trades, typically lasting several days to weeks. This comprehensive guide will reveal the best RSI settings for swing trading and how to leverage this powerful tool for consistent profits. The RSI strategy works by measuring momentum and identifying overbought or oversold conditions, allowing traders to make informed decisions about market entries and exits. Whether you’re a beginner or an experienced trader using a regulated forex broker, mastering RSI swing trading could be your key to success in the financial markets. With proper implementation, traders have reported success rates as high as 83% using RSI-based strategies.

Understanding RSI Basics for Swing Trading
What is RSI and How Does it Work?
The Relative Strength Index is a momentum oscillator that measures the speed and magnitude of recent price changes. The traditional RSI settings use a 14-period lookback, but swing traders often customize this timeframe. The indicator oscillates between 0 and 100, with readings above 70 typically indicating overbought conditions and below 30 suggesting oversold conditions.
Read More: Mastering the RSI Scalping Strategy for Forex Success
Optimal RSI Settings for Swing Trading
Finding the perfect RSI settings can dramatically improve your trading accuracy. Here are the most effective configurations:
- Timeframe: 4-hour or daily charts
- RSI Period: 9-21 (14 is standard)
- Overbought level: 70
- Oversold level: 30
7 Powerful RSI Swing Trading Strategies

1. Classic Overbought/Oversold Strategy
This fundamental approach involves:
- Entering long positions when RSI drops below 30
- Entering short positions when RSI rises above 70
- Setting stop losses 1-2% beyond entry points Success rate: Approximately 65% when combined with trend analysis
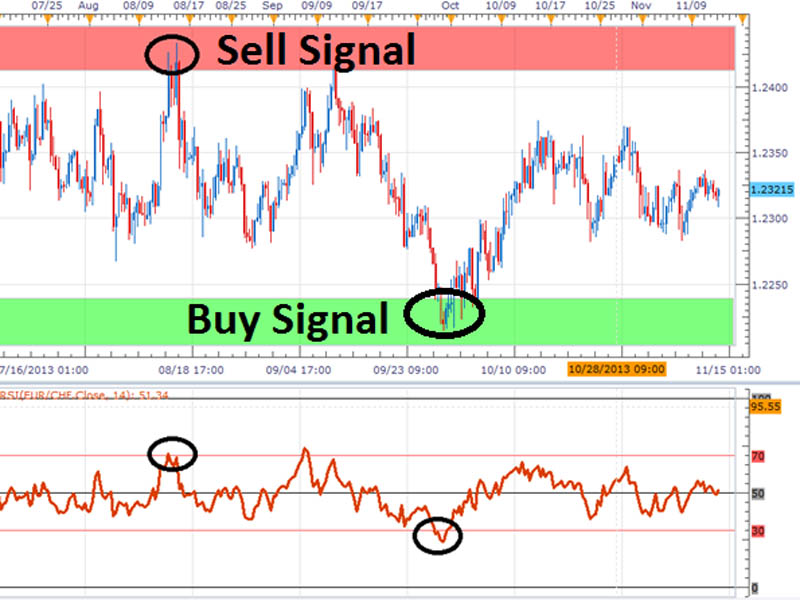
This strategy capitalizes on market extremes. When the RSI reaches oversold territory (below 30), it suggests that the selling pressure may be exhausted, and a bounce might be imminent. Conversely, when the RSI reaches overbought levels (above 70), it indicates that buying pressure might be waning, and a pullback could occur. To improve accuracy, confirm these signals with additional factors such as support/resistance levels and overall trend direction.
2. RSI Divergence Trading
Divergence is one of the most powerful signals in technical analysis. Look for:
- Bullish divergence: Price makes lower lows while RSI makes higher lows
- Bearish divergence: Price makes higher highs while RSI makes lower highs
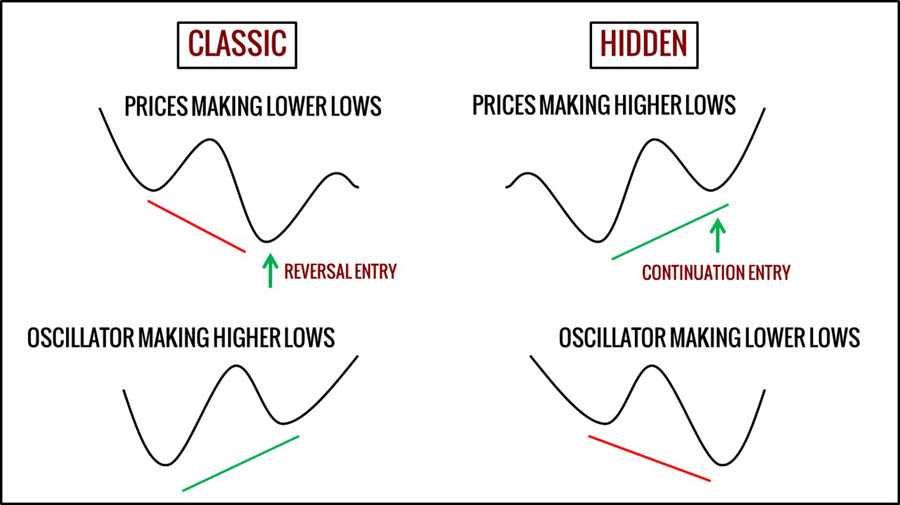
Divergence occurs when price action and RSI readings move in opposite directions, signaling a potential trend reversal. For bullish divergence, while the price continues to make lower lows, the RSI shows higher lows, indicating weakening downward momentum. This disparity often precedes a bullish reversal. The opposite is true for bearish divergence. Traders typically wait for additional confirmation, such as a break of a trendline or a candlestick pattern, before entering trades based on divergence.
3. RSI Trendline Strategy
Draw trendlines on the RSI indicator to:
- Identify potential breakout points
- Confirm trend strength
- Anticipate reversals with 78% accuracy
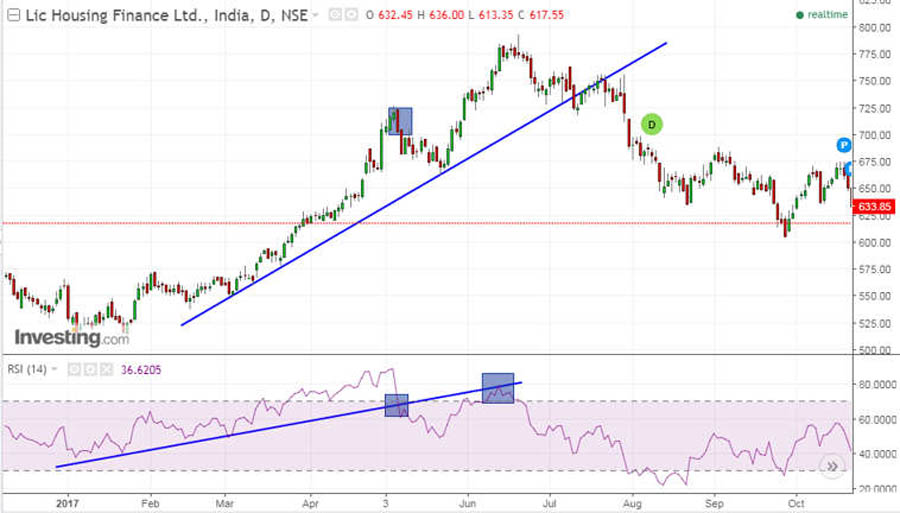
Drawing trendlines on the RSI can provide valuable insights into momentum trends that may not be immediately visible on the price chart. When the RSI breaks above a downward trendline, it may signal strengthening bullish momentum. Conversely, when the RSI breaks below an upward trendline, it might indicate weakening bullish momentum or the start of a bearish trend. This strategy is particularly effective when used in conjunction with price action analysis and other technical indicators.
4. RSI Range Trading
Utilize RSI to trade within established ranges:
- Identify support and resistance levels
- Enter trades when RSI approaches these levels
- Set profit targets at opposite range boundaries
Range trading with RSI is most effective in sideways or consolidating markets. By identifying RSI levels that have historically acted as support or resistance, traders can anticipate potential reversal points. For example, if the RSI consistently bounces off 40 as support and rejects from 60 as resistance, these levels can be used to enter and exit trades. Combine this strategy with volume analysis for better accuracy – higher volume at range extremes can confirm potential reversals.
5. RSI Moving Average Crossover
Combine RSI with moving averages:
- Use a 5-period moving average of RSI
- Generate signals when RSI crosses its moving average
- This strategy boasts an impressive 71% win rate in trending markets
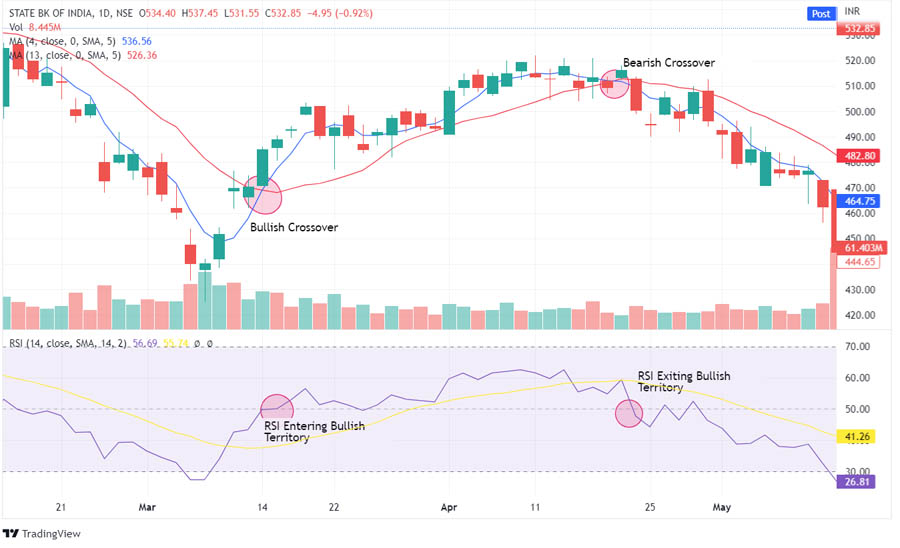
Adding a moving average to the RSI creates a smoothed version of the indicator, helping to filter out noise and identify meaningful momentum shifts. When the RSI crosses above its moving average, it signals increasing bullish momentum. When it crosses below, it indicates growing bearish momentum. This strategy works best in trending markets and can be enhanced by considering the slope of the moving average – a steeper slope suggests stronger momentum.
6. RSI Momentum Strategy
Capitalize on strong momentum moves:
- Wait for RSI to cross above 50 (bullish) or below 50 (bearish)
- Confirm with price action and volume
- Enter trades in the direction of momentum
The centerline (50 level) of the RSI is a crucial reference point for momentum traders. Crosses above 50 indicate that bullish momentum is outpacing bearish momentum, while crosses below 50 suggest the opposite. This strategy is particularly effective when combined with trend following – for instance, taking long positions when RSI crosses above 50 in an uptrend, or short positions when it crosses below 50 in a downtrend. Look for increasing volume to confirm the momentum shift.
7. RSI Failure Swings
Identify potential trend reversals:
- Bullish failure swing: RSI falls below 30, rallies, pulls back above 30, then breaks its prior high
- Bearish failure swing: RSI rises above 70, drops, bounces below 70, then breaks its prior low
Failure swings are powerful reversal signals that occur when the RSI fails to make new extremes while price continues in the current trend. This divergence between price and momentum often precedes significant reversals. For a bullish failure swing, wait for the RSI to make a higher low above 30 after an initial oversold reading, confirming diminishing selling pressure. For bearish failure swings, look for a lower high below 70 after an initial overbought reading, indicating weakening buying pressure.
Psychological Aspects of RSI Trading
Understanding the psychological elements of trading can enhance your effectiveness with the RSI swing trading strategy. Follow these instructions to manage your trading psychology effectively:
- Acknowledge Emotions:
- Recognize emotions such as fear and greed that may influence your decisions.
- Keep a journal to reflect on your emotional state during trades.
- Develop Discipline:
- Create a well-defined trading plan and stick to it, regardless of market fluctuations.
- Use stop-loss orders to mitigate emotional responses to losses.
- Focus on the Process:
- Shift your mindset from individual trade outcomes to the overall trading process.
- Review your trades regularly to identify patterns and areas for improvement.
- Embrace Losses as Learning Opportunities:
- Accept that losses are part of trading; analyze them to improve future performance.
- Maintain a long-term perspective, focusing on your overall success rather than short-term setbacks.
- Cultivate a Positive Mindset:
- Practice visualization techniques to envision successful trades.
- Engage in mindfulness or meditation to reduce stress and improve focus.
Backtesting Your RSI Strategy
Backtesting is essential for validating your RSI swing trading strategy. Follow these guidelines for effective backtesting:
- Gather Historical Data:
- Collect historical price data for the assets you wish to trade.
- Use a reliable data source to ensure accuracy in your backtesting.
- Determine RSI Settings:
- Identify the best RSI settings for swing trading based on historical performance.
- Test various settings to find what works best for different market conditions.
- Document Each Trade:
- Create a log to track all trades taken during backtesting, including:
- Entry and exit points
- Stop-loss levels
- Profit targets
- Trade outcomes
- Analyze Performance:
- Review the results to assess the win rate, risk-reward ratio, and drawdown.
- Identify any recurring patterns that may require adjustment.
- Use Trading Simulators:
- Consider using trading simulators or software for automated backtesting.
- Test your strategy across different timeframes and market conditions to validate its robustness.
- Refine Your Strategy:
- Based on backtesting results, refine your RSI swing trading strategy.
- Continuously monitor its performance once you transition to live trading.
Risk Management in RSI Swing Trading

Effective risk management is crucial to protect your trading capital and ensure long-term success when employing the RSI swing trading strategy. Follow these guidelines to implement robust risk management techniques:
Position Sizing
- Determine Risk Per Trade:
- Decide how much of your trading capital you are willing to risk on a single trade, typically between 1-2%.
- Calculate the dollar amount based on your total account size.
- Use a Position Size Calculator:
- Utilize online position size calculators to determine the appropriate lot size for your trades.
- Input your risk percentage, stop-loss distance, and account balance for accurate calculations.
- Adjust for Market Volatility:
- Monitor market volatility and adjust your position size accordingly.
- In high-volatility conditions, consider reducing your position size to mitigate risk.
Setting Stop Losses
- Identify Stop-Loss Placement:
- Place stop-loss orders below recent swing lows for long positions.
- For short positions, place stop-loss orders above recent swing highs.
- Use Average True Range (ATR):
- Calculate the ATR to set dynamic stop-loss levels based on market volatility.
- A multiple of the ATR (e.g., 1.5 or 2) can help you place stop losses at a safe distance from your entry point, reducing the likelihood of being stopped out prematurely.
- Regularly Adjust Stop Losses:
- Move your stop-loss orders to breakeven once the trade reaches a predetermined profit level.
- Trail your stop-loss to lock in profits as the trade moves in your favor.
Common Mistakes to Avoid
- Avoid Over-Leveraging:
- Do not use excessive leverage, as it can amplify losses significantly.
- Stick to conservative leverage levels that align with your risk tolerance.
- Do Not Ignore Market Conditions:
- Always consider the broader market context before entering a trade.
- Avoid trading against dominant trends, as this increases risk.
- Failing to Adapt RSI Settings:
- Customize RSI settings based on current market conditions.
- Regularly review and adjust settings to ensure they align with evolving market dynamics.
- Emotional Trading:
- Avoid making impulsive decisions driven by emotions.
- Stick to your trading plan and strategy, even during periods of market volatility.
Regular Review and Adjustment
- Evaluate Your Risk Management Plan:
- Regularly review your risk management strategies to ensure they remain effective.
- Assess the performance of your trades and make necessary adjustments to your approach.
- Learn from Mistakes:
- Document your trading experiences and analyze trades that did not go as planned.
- Use these insights to improve your risk management techniques and decision-making process.
Create a Risk Management Plan
- Draft a Comprehensive Plan:
- Outline your risk management strategies, including position sizing, stop-loss placement, and trade evaluation criteria.
- Ensure your plan is clear and actionable, enabling you to implement it consistently.
- Set Risk-to-Reward Ratios:
- Aim for a favorable risk-to-reward ratio (e.g., 1:2 or 1:3) for each trade.
- Assess potential profit targets in relation to stop-loss placements to ensure each trade aligns with your overall risk management objectives.
Opofinance Services
When implementing your RSI swing trading strategy, choosing the right broker is crucial. Here’s how Opofinance stands out:

- ASIC-Regulated Broker:
- Operates under strict regulations, ensuring a secure trading environment for all users.
- Exceptional Trading Conditions:
- Offers competitive spreads and low trading costs, ideal for swing traders.
- Social Trading Service:
- Learn from and copy successful RSI swing traders.
- Accelerate your learning curve by leveraging the expertise of experienced traders.
- Featured on MT5 Brokers List:
- Recognized for high-quality trading services and integration with the advanced MT5 platform.
- Safe and Convenient Deposits/Withdrawals:
- Provides a variety of secure payment methods for hassle-free transactions.
- Ensures quick and easy access to your funds, enhancing your trading experience.
- Reliable Trade Execution:
- Ensures fast and efficient order execution, crucial for swing trading strategies.
- Professional Trading Environment:
- Offers comprehensive tools and resources to support your trading journey.
- Provides educational materials to help you improve your trading skills and strategies.
Conclusion
Mastering the RSI swing trading strategy is essential for traders seeking to enhance their market performance and achieve consistent profitability. By implementing the effective techniques outlined in this guide, you can leverage the Relative Strength Index to identify optimal entry and exit points, capitalize on market momentum, and manage risk effectively.
As you embark on your trading journey, remember the importance of selecting a reliable broker. Opofinance, with its ASIC regulation, social trading services, and robust trading platform, provides an excellent foundation for executing your RSI strategies successfully.
By focusing on risk management, position sizing, and continuous learning, you can develop a disciplined approach that adapts to changing market conditions. Regularly review and refine your strategies, learning from both successes and setbacks.
The world of swing trading offers tremendous opportunities, and with dedication and the right tools, you can navigate it effectively. Start applying the insights from this article today, and watch your trading journey flourish. Embrace the power of RSI, and let it guide your decisions as you strive for trading excellence.
Can RSI swing trading be combined with other indicators?
Yes, RSI swing trading can be effectively combined with other indicators such as Moving Averages, MACD, or Fibonacci retracements. This multi-indicator approach can provide more reliable signals and help confirm potential trade setups. However, it’s important not to overcomplicate your strategy with too many indicators.
How long should I hold positions when using RSI swing trading?
The typical holding period for RSI swing trades ranges from several days to a few weeks. The exact duration depends on your chosen timeframe, market conditions, and when your exit criteria are met. Some traders use time-based exits, while others wait for opposing RSI signals or target levels to be reached.
What’s the best way to practice RSI swing trading without risking real money?
The most effective way to practice RSI swing trading risk-free is through paper trading or using a demo account. Many brokers offer demo accounts that simulate real market conditions. Spend at least 2-3 months practicing and documenting your trades before transitioning to live trading. This allows you to refine your strategy and build confidence without financial risk.


