Imagine you’re trading in the fast-paced world of forex, closely monitoring the charts. You spot a shooting star candlestick pattern forming, and immediately, you know this could be the signal for a potential market reversal. But how can you be sure? How do you know when to act, and when to hold back? Understanding the shooting star candlestick pattern could be the game-changer in your trading strategy, especially if you’re working with a reliable forex broker that gives you access to powerful tools for technical analysis.

The shooting star pattern is a highly effective bearish reversal signal in the world of forex trading. Whether you’re using an online forex broker or relying on a regulated forex broker, mastering this pattern can help you navigate market trends and predict price movements with confidence. In this guide, we’ll break down the key characteristics of the shooting star, how to effectively use it in your trading strategy, and the common mistakes traders make when trying to capitalize on this pattern.
Ready to unlock the potential of the shooting star and take your trading to new heights? Let’s dive in and explore the essentials of this powerful candlestick formation.
What is the Shooting Star Candlestick Pattern?

Discover the significance of the shooting star candlestick pattern in market analysis.
Definition and Importance in Trading
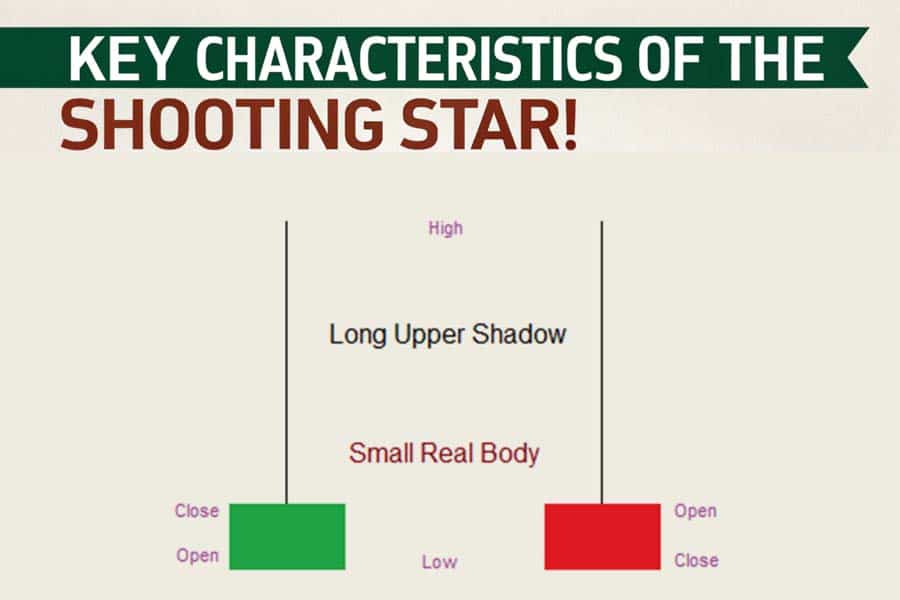
The shooting star candlestick pattern is a critical and widely recognized formation in technical analysis, particularly in forex trading. This single candlestick pattern is known for its ability to signal a potential reversal in market sentiment, especially after an uptrend. It consists of a small real body, a long upper shadow, and little or no lower shadow, which together create a distinct visual appearance on the price chart.
When the shooting star pattern emerges after a significant upward price movement, it indicates that the uptrend may be losing strength. The pattern suggests that while buyers initially pushed the price higher during the trading session, sellers took control by the close of the trading period, causing the price to fall sharply. This shift from bullish momentum to bearish sentiment is a signal that the market may soon reverse direction, making the shooting star pattern an important tool for traders seeking to capitalize on trend reversals.
In forex trading, recognizing the shooting star candlestick pattern is vital for identifying entry points for short trades or other strategies. It can also provide valuable insights when combined with other technical indicators like moving averages or RSI. For traders using a regulated forex broker, understanding this pattern’s significance enhances their ability to make informed decisions and effectively manage risk.
By accurately interpreting the shooting star candlestick, traders can make more calculated decisions, predicting market turns before they happen, and potentially improving their overall trading performance.
Read More: Evening Star Candlestick Pattern
Key Characteristics of the Shooting Star Pattern

Understand the essential traits of the shooting star pattern to enhance your trading strategy.
The shooting star pattern has a few critical and distinct features that traders look for in the market. Understanding these characteristics is essential for identifying the pattern correctly and using it effectively in a trading strategy. Here’s a detailed breakdown of the key traits:
- Small Real Body: The small real body of the shooting star is located near the bottom of the candlestick. This suggests market indecision, where the price action starts near the open but ends closer to the close, often after a battle between buyers and sellers. This small body signifies that the market couldn’t maintain the buying pressure, potentially leading to a reversal.
- Long Upper Shadow: The long upper shadow is a key feature of the shooting star pattern. It shows that buyers initially managed to push the price higher during the session. However, the long upper shadow indicates that they were unable to sustain this momentum, and by the end of the period, sellers took control, pushing the price back down. This indicates market exhaustion from the buyers, which is a strong signal for a trend reversal.
- Little or No Lower Shadow: The absence or minimal presence of a lower shadow further confirms the reversal potential of the shooting star. A small or nonexistent lower shadow means that selling pressure emerged quickly after the open, preventing the price from advancing further and suggesting that bearish momentum is gaining strength.
- Appears After an Uptrend: For the pattern to be valid and signal a bearish reversal, it must appear after a strong uptrend. The presence of the shooting star at the top of an uptrend signals that the bullish momentum has reached its peak, and market participants are now likely to turn bearish, anticipating a price correction or trend reversal.
By understanding these characteristics, you’ll be able to effectively spot the shooting star candlestick pattern and incorporate it into your trading strategies. Whether you are trading stocks, forex, or other markets, recognizing this pattern can provide a crucial edge in identifying potential reversals before they happen.
How to Identify a Shooting Star Candlestick

Follow these essential steps to accurately identify the shooting star candlestick pattern.
Read More: Morning Star Candlestick Pattern
Steps to Recognize the Shooting Star
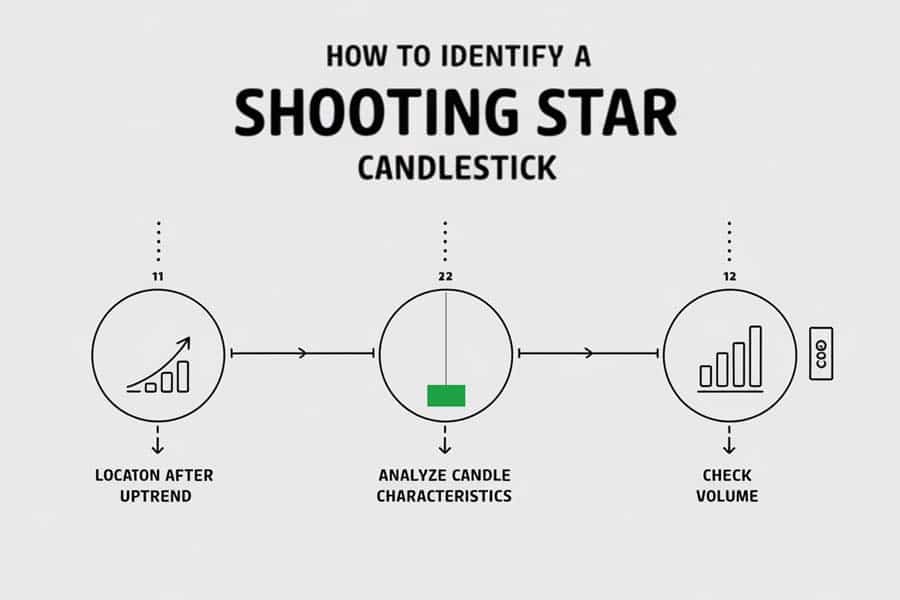
Identifying a shooting star candlestick pattern is essential for traders looking to spot potential trend reversals. This bearish reversal pattern appears after an uptrend and can serve as a key signal for a change in market direction. To recognize a shooting star candlestick correctly, follow these key steps:
- Location: Identifying the Pattern After an Uptrend
The shooting star pattern must appear after a sustained uptrend. This is crucial because the pattern indicates a potential shift in sentiment from bullish to bearish. The uptrend sets the stage for a reversal, and without a prior upward movement, the shooting star would not have the same significance as a trend reversal signal. The appearance of this candlestick at the top of an uptrend is a key indicator that the price may soon move downward. - Candle Characteristics: Analyzing the Real Body, Upper Shadow, and Lower Shadow
To verify that a candlestick is indeed a shooting star, look for the following visual characteristics:
- Small Real Body: A small body located near the bottom of the candlestick indicates market indecision. The small body shows that buyers initially pushed the price higher, but were unable to maintain control.
- Long Upper Shadow: A long upper shadow signifies that the price was pushed up significantly during the trading period, but eventually sellers took control, causing the price to drop back down. This is the essence of a shooting star—buyers try to push higher but fail, and the bearish momentum starts to take over.
- Little or No Lower Shadow: The absence of a lower shadow is another crucial feature. A small or nonexistent lower shadow shows that the price did not dip lower than the open, reinforcing the idea that sellers overwhelmed buyers during the session.
- Volume: Confirming the Reversal with Volume Patterns
Volume is a powerful confirmation tool for spotting a shooting star candlestick pattern. While the shooting star can be an important reversal signal, higher trading volume increases its reliability. When the pattern forms with above-average volume, it suggests a stronger and more significant reversal, with sellers actively driving the price lower after the brief bullish push. If volume is unusually low, the reversal signal may be less reliable.
Tools and Indicators to Confirm the Pattern
While the shooting star candlestick pattern can stand alone as a bearish reversal signal, it is most effective when confirmed by additional technical indicators. By combining the shooting star with other tools, traders can improve their chances of success and make more informed trading decisions. Here are some of the most useful indicators for confirming a shooting star pattern:
- RSI (Relative Strength Index): The RSI is a widely used indicator in forex trading to measure the strength of an asset. When the RSI is above 70, it indicates that the asset is overbought. If the shooting star pattern forms when the RSI is in the overbought zone, this further confirms the likelihood of a reversal. The RSI acts as a momentum oscillator, helping traders to identify when the market may be reaching an extreme point, supporting the shooting star’s signal of a downturn.
- Moving Averages: Moving averages are one of the most fundamental tools for confirming price trends. If a shooting star appears near a significant moving average level—such as the 50-day or 200-day moving average—it adds validity to the reversal signal. For example, if the shooting star forms after a price test of a key moving average resistance, this further increases the probability that the pattern will lead to a bearish move.
- MACD (Moving Average Convergence Divergence): The MACD is another essential tool for confirming the shooting star candlestick. The MACD histogram can indicate a shift in momentum, which complements the reversal signal given by the shooting star pattern. A bearish crossover on the MACD, where the MACD line crosses below the signal line, occurring after the shooting star forms, can strongly confirm that the market is turning bearish.
Example of How to Spot a Shooting Star Pattern
To make the identification process clearer, let’s consider a real-world example of a shooting star candlestick in forex trading:
Imagine a currency pair has been in a steady uptrend for several days, with higher highs and higher lows. On the fifth day of the uptrend, a shooting star forms on the chart. This candlestick has a small real body near the bottom, a long upper shadow, and little or no lower shadow. Additionally, the volume is higher than the previous day, signaling that sellers are gaining control.
Traders would recognize this shooting star as a potential signal for a bearish reversal. To further confirm the signal, they might look for the following:
- A subsequent bearish candlestick (such as a red candle or a long bearish bar) to confirm that the selling pressure is real and the price is starting to move lower.
- An RSI reading above 70, signaling an overbought market.
- A MACD crossover, showing a shift in momentum towards the downside.
Once these confirmations are in place, traders can enter a short position, anticipating that the price will move lower following the shooting star’s signal.
The Psychology Behind the Shooting Star Pattern
Understanding Market Sentiment
The shooting star candlestick pattern is essentially a reflection of the market’s psychology. When the pattern forms, it tells us that despite the bullish sentiment that drove the price higher, there is now a shift in control from buyers to sellers. The long upper shadow shows that while buyers tried to push the price higher, they were unable to sustain the movement, and the price was eventually pushed back down by sellers.
This sudden shift in sentiment can often signal the end of the current uptrend, making the shooting star an important pattern for traders looking to capitalize on potential trend reversals.
Why the Shooting Star Signals a Reversal
The appearance of a shooting star at the top of an uptrend suggests that the market is exhausted. The buyers who were driving the market higher have lost their strength, and the sellers are beginning to take control. If the market closes near the low of the candlestick, it confirms that sellers have overwhelmed the buyers, and a bearish trend may soon follow.
How to Trade the Shooting Star Candlestick Pattern

Master effective trading strategies with shooting star patterns.
Step-by-Step Guide for Trading the Shooting Star Pattern
Trading the shooting star candlestick pattern requires a disciplined approach to ensure that the pattern’s reversal signal is both valid and profitable. Follow this step-by-step guide to effectively trade the shooting star and maximize the chances of success:
- Wait for Confirmation: Don’t Jump the Gun
One of the most important steps in trading the shooting star pattern is to wait for confirmation. A shooting star alone is not sufficient to enter a trade. It is essential to wait for the next candlestick to confirm the reversal signal. Typically, a bearish candlestick following the shooting star reinforces the idea that the price is starting to trend downward. This confirmation helps you avoid entering trades based on false signals, which can lead to unnecessary losses. Always ensure that the reversal is supported by market sentiment before making a move. - Ideal Entry Point: Positioning Your Short Trade
After waiting for confirmation, enter a short position at the market price, or slightly below the low of the shooting star candlestick. This strategy allows you to capture the downward movement that follows the reversal. Entering slightly below the low of the shooting star gives you a safer entry point, minimizing the risk of being caught in a false reversal. Additionally, placing your trade at this level helps to confirm that the market has indeed started moving lower. - Stop-Loss Placement: Protect Your Capital
Placing a stop-loss order is a crucial aspect of managing your risk when trading the shooting star. To protect yourself from unexpected market movements or false signals, place your stop-loss just above the high of the shooting star candlestick. This ensures that if the market unexpectedly reverses in the opposite direction, your position will be closed automatically, preventing significant losses. A stop-loss is essential in controlling risk and adhering to sound risk management strategies. - Take-Profit Targets: Setting Realistic Profit Goals
Setting take-profit targets is vital for maximizing the reward of your trade. After entering a short position, aim to take profits at the next significant support level or the previous lows. These levels serve as logical points where the price may reverse or consolidate. Ideally, aim for a risk-to-reward ratio of 2:1 or higher, meaning your potential profit should be at least double your risk. This ensures that even if some trades result in a loss, your profitable trades will outweigh the risks over time.
Combining the Shooting Star with Other Indicators
To increase the probability of success and reduce the chances of a false signal, consider combining the shooting star pattern with other technical analysis tools. By using a multi-indicator approach, traders can filter out weaker signals and make more informed decisions. Here are a few powerful tools to use alongside the shooting star:
- Bollinger Bands: When a shooting star appears near the upper Bollinger Band, it often signals that the market is overbought. This creates a strong reversal signal, as the price is likely to fall back into the middle of the Bollinger Bands. Using this strategy in conjunction with the shooting star can help confirm that a market correction is on the way.
- Pivot Points: Pivot points are popular levels of support and resistance, which help traders identify potential turning points in the market. If a shooting star forms near a significant pivot point, it strengthens the reversal signal. A shooting star near key support or resistance levels is more likely to lead to a price reversal, making it a more reliable setup for entering trades.
Common Pitfalls to Avoid When Trading the Shooting Star
While the shooting star candlestick pattern is a powerful tool for identifying bearish reversals, traders must avoid several common pitfalls to ensure consistent success. Below are some of the key mistakes traders make and how to avoid them:
- Failing to Wait for Confirmation
Entering a trade based solely on the appearance of a shooting star without waiting for confirmation can lead to significant losses. A shooting star is a reversal signal, but it requires further validation from the next candlestick to confirm that the price is truly reversing. Always wait for the bearish confirmation candle before taking action. This helps avoid jumping into trades prematurely. - Ignoring Market Context
The reliability of the shooting star is greatly enhanced when it appears within the context of a strong uptrend. Avoid using the shooting star pattern in sideways or choppy markets because its predictive power is reduced. In trending markets, the shooting star can act as a reliable signal of momentum loss and a potential reversal. Ensure that the market’s overall trend supports the shooting star’s signal for the best results. - Emotional Trading
Emotional trading is a major pitfall for many traders, leading to poor decision-making and unnecessary losses. Panic selling after a shooting star or greed when setting unrealistic profit targets can result in missed opportunities or failed trades. Always stick to your trading plan, follow your strategy, and use risk management techniques such as stop-losses and proper position sizing to avoid emotional reactions in the market.
Using Shooting Stars in Different Time Frames

Learn how to apply shooting stars effectively across various trading time frames.
Best Time Frames for Trading the Shooting Star
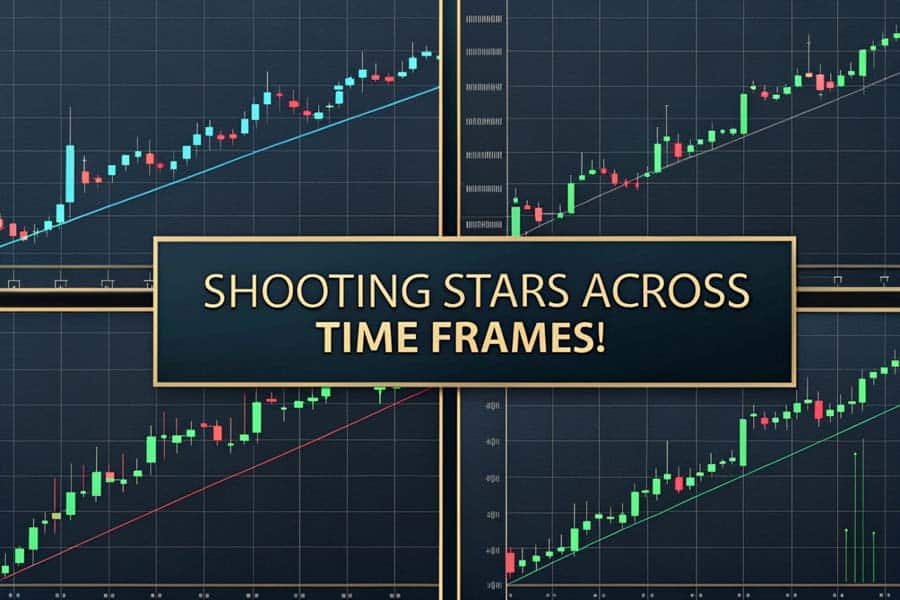
The shooting star pattern can be used across different time frames, but it is most effective on longer time frames like the daily or weekly charts. This allows the pattern to filter out noise and focus on major trend changes. However, shorter time frames such as the 1-hour or 4-hour charts can also be used, but the pattern’s reliability may be lower.
Time Frame Considerations for Scalping and Swing Trading
- Scalping: For short-term traders, the shooting star can be used to identify quick reversal points on lower time frames. However, it is crucial to wait for confirmation before entering a trade.
- Swing Trading: Swing traders can use the shooting star pattern on daily charts to identify potential price reversals and capitalize on medium-term moves.
Case Studies of Shooting Star Patterns in Real Trading
Historical Example
Let’s consider a real-world example where the shooting star played a crucial role in signaling a price reversal. Imagine a stock that has been in an uptrend for several weeks. On the last day of the uptrend, a shooting star forms at the top of the trend. The next day, the stock opens lower and continues its descent, confirming the reversal. Traders who used the shooting star pattern as part of their strategy would have successfully profited from the downtrend.
Success Rate of the Shooting Star Pattern
Studies show that the shooting star pattern has an approximate success rate of 60-70% when used with proper confirmation. While no trading pattern is 100% accurate, this percentage makes the shooting star a highly valuable tool in a trader’s arsenal, especially when combined with other technical indicators and sound risk management practices.
Why Choose Opofinance for Trading the Shooting Star?
Opofinance is a regulated forex broker offering a wide range of tools and services for traders. With ASIC regulation, it ensures transparency, security, and trust in its operations. Whether you are a beginner or experienced trader, Opofinance provides a user-friendly interface and advanced trading tools to help you navigate the forex market with ease.

Key Features of Opofinance
1. ASIC Regulation
Opofinance is ASIC regulated, ensuring a high level of security and compliance. This regulatory oversight protects traders’ funds and guarantees that the broker operates with full transparency.
2. MT5 Platform
Opofinance offers the MT5 trading platform, known for its advanced charting tools, market analysis, and automated trading features. It’s a perfect platform for both beginner and professional traders.
3. Social Trading
Opofinance’s social trading service allows traders to copy the strategies of successful traders, making it easier to learn and execute profitable trades.
4. Secure Transactions
Opofinance provides safe deposit and withdrawal methods, ensuring that all financial transactions are processed securely.
Why Choose Opofinance?
- ASIC regulation for secure and trustworthy trading.
- MT5 platform for professional-grade tools.
- Social trading for learning from successful traders.
- Secure payment methods for hassle-free transactions.
Opofinance is a solid choice for forex traders looking for a regulated and reliable broker with advanced trading tools and secure transaction methods.
Conclusion
The shooting star candlestick pattern is a powerful tool for traders looking to identify potential market reversals. By understanding its key characteristics, combining it with other technical indicators, and applying solid risk management strategies, you can increase your chances of success in the markets. Whether you’re a beginner or a seasoned trader, incorporating the shooting star pattern into your trading plan can significantly improve your ability to spot trend changes and make more informed decisions. Always remember to use proper confirmation before acting on the pattern and manage your trades with discipline.
Key Takeaways
- Shooting Star Definition: The shooting star candlestick pattern signals a potential bearish reversal and appears at the top of an uptrend. It features a small real body, a long upper shadow, and little to no lower shadow.
- Confirmation is Crucial: Always wait for confirmation from the next candlestick (preferably a bearish one) before entering a trade based on the shooting star pattern to avoid false signals.
- Combine with Other Indicators: Enhance the reliability of the shooting star by combining it with technical indicators like RSI, MACD, and moving averages to confirm the reversal.
- Risk Management: Use a stop-loss above the high of the shooting star to protect against false signals and set take-profit targets at significant support levels for a favorable risk-to-reward ratio.
- Avoid Emotional Trading: Stick to your trading plan, avoid making impulsive decisions based on fear or greed, and always ensure proper risk management to maintain consistent profitability.
- Market Context Matters: The shooting star is more reliable in strong uptrends and should be avoided in sideways or choppy markets where its predictive power may be reduced.
What market conditions make the shooting star pattern more effective?
The shooting star pattern is most effective when it appears at the peak of a strong uptrend. It signals potential reversal when market conditions show signs of exhaustion. Using it in choppy or sideways markets reduces its reliability.
How can I confirm a shooting star candlestick pattern?
Confirmation for a shooting star pattern comes from the subsequent candlestick. Ideally, a bearish candle following the shooting star validates the potential reversal. Additional indicators like RSI, MACD, or volume spikes can further support this signal.
What is the best stop-loss strategy when trading the shooting star pattern?
A commonly recommended stop-loss strategy is to place your stop just above the high of the shooting star candlestick. This helps protect you from false breakouts while giving the trade room to develop.
Can the shooting star pattern work in all timeframes?
Yes, the shooting star pattern can appear in any timeframe, but it is generally more reliable in higher timeframes like daily or weekly charts. Shorter timeframes may lead to more false signals due to market noise.
Should I combine the shooting star pattern with other candlestick patterns?
Yes, combining the shooting star with other candlestick patterns like engulfing or doji can improve its accuracy. These combinations can provide a stronger confirmation of a potential trend reversal.


