The smart money concept time frame is a crucial aspect of successful forex trading that often eludes novice investors. This powerful approach focuses on identifying and capitalizing on the actions of institutional traders and large financial entities, who are considered the “smart money” in the market. Many traders leverage insights from their preferred forex broker to better understand the time frames in which these influential players operate, enabling retail traders to gain a significant edge in their trading strategies.

In this comprehensive guide, we’ll delve deep into the smart money concept time frame, exploring its intricacies and providing actionable insights to help you navigate the forex market with confidence. We’ll uncover the secrets of how to find order blocks in forex and align your trading decisions with the movements of institutional players. Whether you’re a beginner looking to grasp the fundamentals or an experienced trader seeking to refine your approach, this article will equip you with the knowledge and tools to elevate your forex trading game.
Understanding the Smart Money Concept
What is Smart Money Concept?
The Smart Money Concept refers to a trading approach that aims to identify and capitalize on the actions of institutional investors, market makers, and other financial professionals in the forex market. This concept is based on the idea that these entities, collectively known as “smart money,” possess superior knowledge, resources, and influence that drive significant market movements and trends. The Smart Money Concept includes:
- Identifying key levels where large players are likely to enter or exit positions
- Recognizing price manipulation tactics used by institutions
- Understanding order flow and liquidity dynamics
- Analyzing market structure to predict potential trend reversals
- Aligning trading decisions with the probable intentions of major market participants
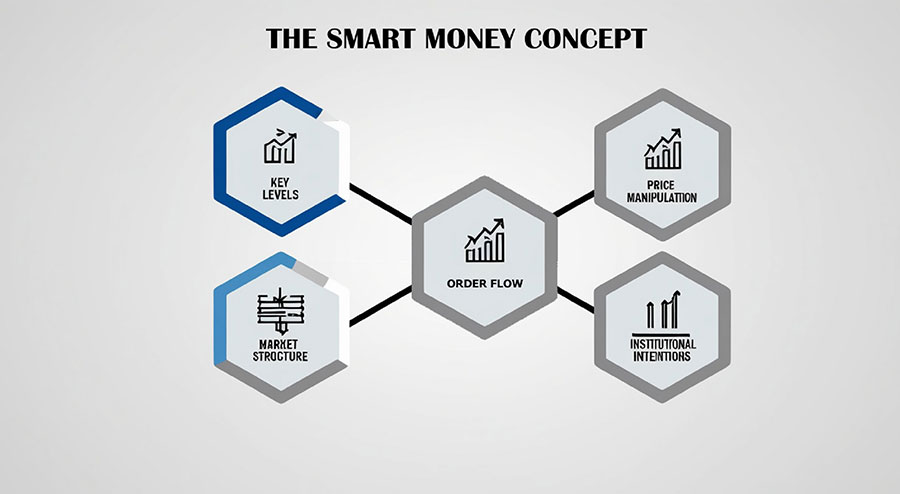
By studying and applying the Smart Money Concept, retail traders aim to improve their trading outcomes by “following the footsteps” of these influential market players.
The Importance of Time Frames
Time frames play a crucial role in the smart money concept. Different market participants operate on various time horizons, from short-term scalping to long-term position trading. Understanding these time frames is essential for:
- Identifying key support and resistance levels
- Recognizing trend reversals
- Timing entries and exits effectively
- Managing risk and setting appropriate stop-loss levels
Read More: 5 EURUSD Trading Opportunities
Smart Money Time Frames: A Comprehensive Breakdown
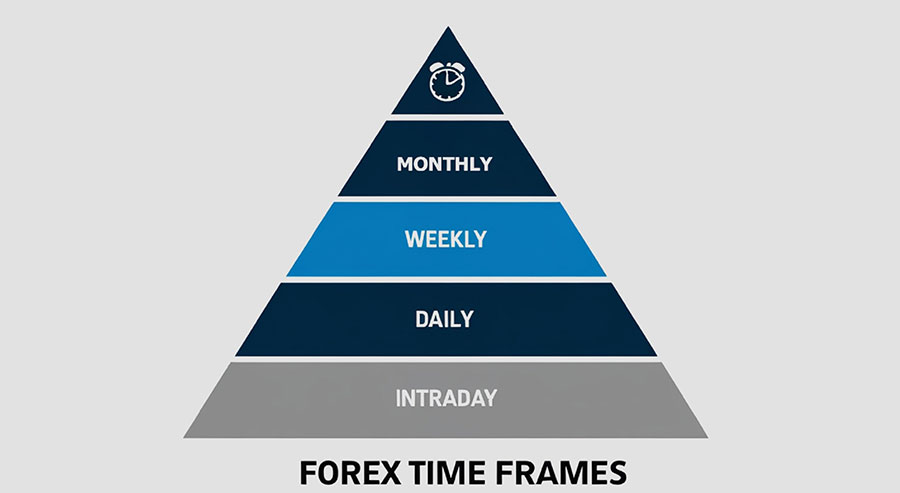
1. Intraday Time Frames (1-minute to 4-hour charts)
Intraday time frames are popular among day traders and scalpers. While smart money can influence these shorter time frames, their impact is often less pronounced. Key points to consider:
- Increased volatility and noise
- Suitable for quick trades and scalping strategies
- Requires constant monitoring and quick decision-making
- Higher risk of false signals and whipsaws
Traders focusing on intraday time frames should be aware that they may be more susceptible to market noise and short-term fluctuations. While it’s possible to profit from these shorter time frames, it’s crucial to have a solid understanding of market dynamics and robust risk management strategies in place.
2. Daily Time Frame
The daily time frame is often considered the sweet spot for retail traders looking to align with smart money movements. Benefits include:
- Clearer market structure and trends
- Reduced noise compared to intraday charts
- Easier identification of key support and resistance levels
- Better balance between analysis time and trading opportunities
Many successful traders find that the daily time frame provides an optimal balance between capturing significant market moves and maintaining a healthy work-life balance. It allows for thorough analysis without requiring constant market monitoring.
3. Weekly Time Frame
Weekly charts provide a broader perspective on market trends and are favored by many institutional traders. Advantages of this time frame include:
- Clearer long-term trends and market cycles
- Reduced impact of short-term volatility
- Easier identification of major support and resistance levels
- Better alignment with fundamental factors
The weekly time frame is particularly useful for identifying overarching market trends and potential turning points. It can help traders avoid getting caught up in short-term market noise and focus on more significant price movements.
4. Monthly Time Frame
Monthly charts offer the widest view of market movements and are often used by large institutions for strategic decision-making. Key benefits:
- Clearest representation of long-term trends
- Ideal for identifying major market cycles
- Reduced noise and false signals
- Best alignment with macroeconomic factors
While monthly charts may not be suitable for determining precise entry and exit points, they provide invaluable insights into long-term market direction and major support and resistance levels that have held over extended periods.
Read More: The Smart Money Concept
How to Find Order Blocks in Forex
Order blocks are areas on the chart where significant buying or selling activity has occurred, often driven by smart money. These zones can act as strong support or resistance levels in the future. Here’s a step-by-step guide to finding order blocks:
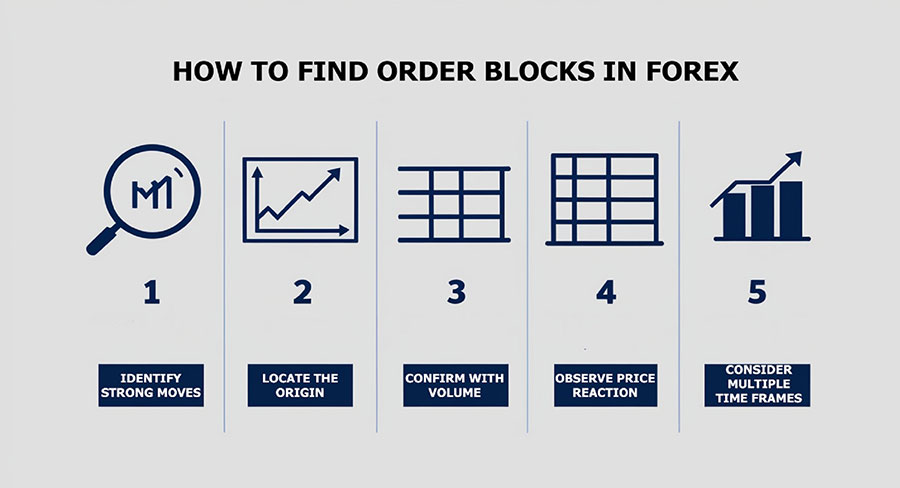
- Identify strong moves: Look for sharp, impulsive price movements on your chosen time frame. These moves often indicate smart money activity and can lead to the formation of order blocks.
- Locate the origin: Find the area where the strong move originated. This is often characterized by a consolidation phase followed by a breakout. The origin of the move is crucial as it represents the point where smart money likely entered or exited the market.
- Mark the zone: Draw a rectangle around the area where the move started. This is your potential order block. Be sure to encompass the entire zone of interest, including any wicks or tails on the candles.
- Confirm with volume: Check if there was a significant increase in volume during the formation of the order block. High volume can indicate strong institutional interest and increase the significance of the order block.
- Observe price reaction: Watch how price reacts when it returns to the order block. Strong rejection or continuation from this level confirms its significance. Multiple tests of the order block can further validate its importance.
- Consider multiple time frames: Combine order blocks from different time frames to increase the probability of successful trades. Order blocks that align across multiple time frames are often more powerful and reliable.
When identifying order blocks, it’s important to remember that not all potential zones will be equally significant. Focus on those that show clear evidence of smart money activity and have been respected by price action multiple times.
Read More: Smart Money Concepts Terminology
Strategies for Trading with Smart Money Time Frames
1. Multi-Time Frame Analysis
Combining multiple time frames allows you to align your trades with smart money movements across different horizons. For example:
- Use monthly charts for overall trend direction
- Weekly charts for key support and resistance levels
- Daily charts for entry and exit points
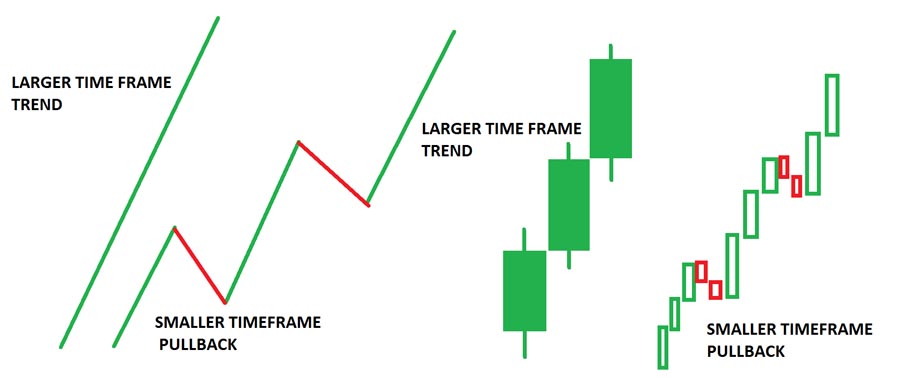
This approach helps you avoid trading against the larger trend while still capitalizing on shorter-term opportunities. It provides a more comprehensive view of market dynamics and can significantly improve your trading decisions.
2. Institutional Candle Patterns
Look for specific candle patterns that often indicate smart money activity:
- Engulfing patterns: These can signal a potential reversal and are often used by institutions to enter or exit large positions.
- Pin bars (especially on higher time frames): These can indicate rejection of certain price levels and potential reversals.
- Inside bars followed by breakouts: These patterns can signal accumulation or distribution by smart money before a significant move.
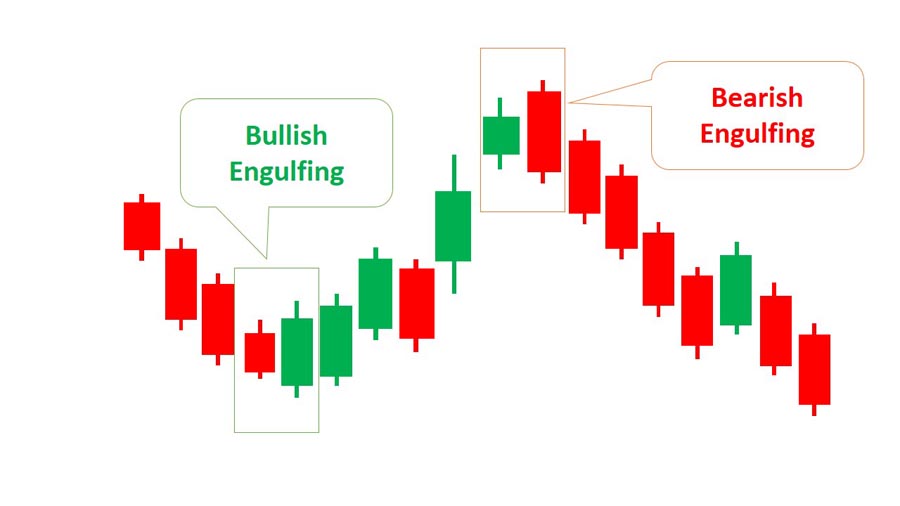
Understanding and recognizing these patterns can provide valuable insights into potential smart money actions and upcoming market moves.
3. Liquidity Hunting
Smart money often targets areas of high liquidity to execute large orders. Identify these zones by looking for:
- Clusters of stop-loss orders above key resistance or below support levels
- Round numbers (e.g., 1.3000, 1.3500)
- Previous swing highs and lows
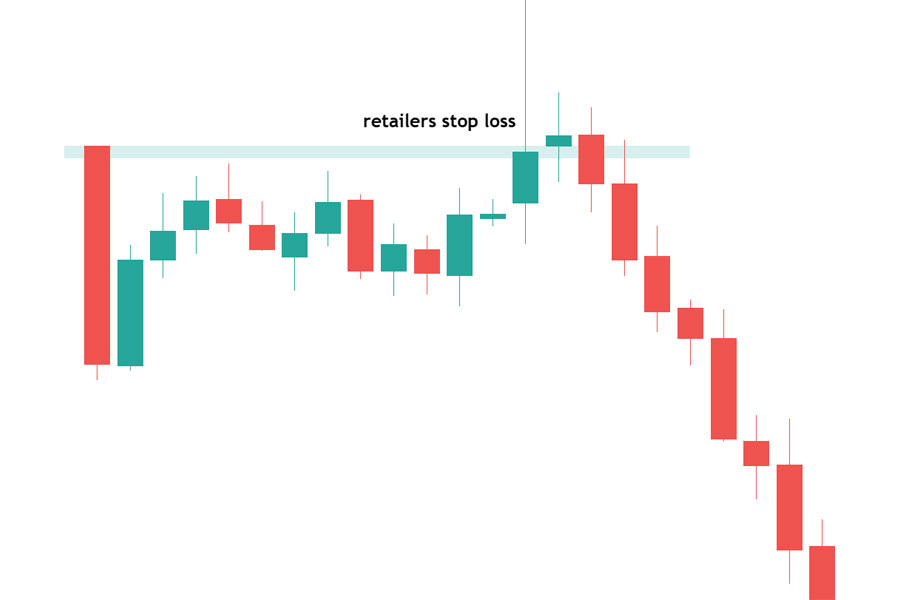
By anticipating these liquidity zones, you can position yourself to benefit from the price movements that often occur when smart money targets these areas.
4. Order Flow Analysis
Study the order flow to gain insights into smart money actions:
- Use depth of market (DOM) tools to visualize order book imbalances
- Look for large limit orders that may indicate institutional interest
- Pay attention to sudden increases in volume, which may signal smart money entries or exits
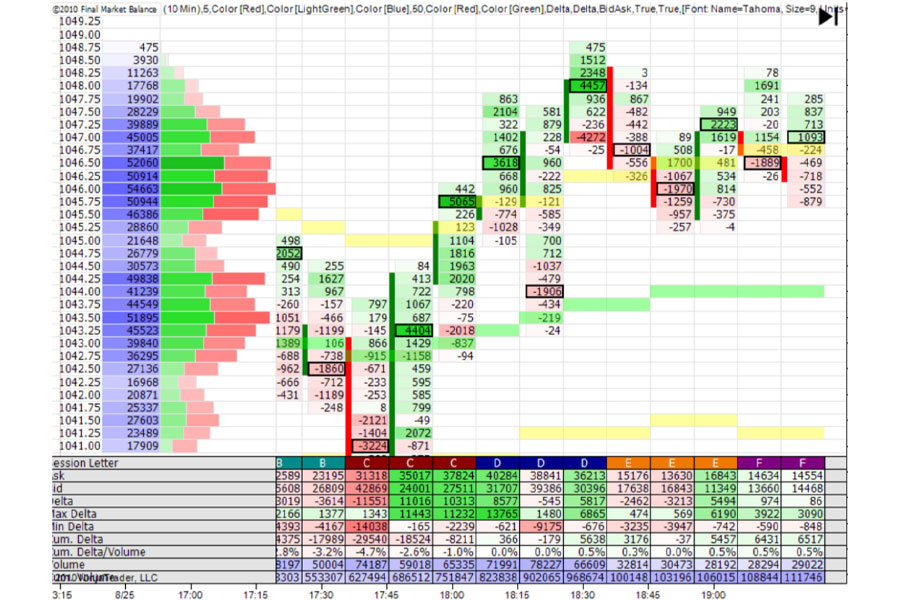
Order flow analysis can provide real-time insights into market dynamics and potential smart money movements, allowing you to make more informed trading decisions.
5. Correlation with Economic Data
Smart money often anticipates and reacts to major economic events. Incorporate fundamental analysis by:
- Monitoring economic calendars for high-impact events
- Studying central bank policies and statements
- Analyzing long-term economic trends and their potential impact on currency pairs

Understanding the broader economic context can help you align your trades with potential smart money reactions to fundamental factors.
Common Pitfalls and How to Avoid Them
- Overtrading: Stick to your chosen time frame and avoid the temptation to take too many trades. Quality over quantity is key when following smart money concepts.
- Ignoring risk management: Always use appropriate position sizing and stop-loss orders, even when following smart money movements. No trading approach is foolproof, and proper risk management is essential for long-term success.
- Chasing moves: Enter trades at optimal levels rather than jumping in after a significant move has already occurred. Patience is crucial when waiting for the right setups.
- Neglecting fundamentals: While technical analysis is crucial, don’t ignore the broader economic picture that drives smart money decisions. A balanced approach considering both technical and fundamental factors often yields the best results.
- Failing to adapt: Market conditions change, and smart money strategies evolve. Stay flexible and continuously educate yourself to remain effective in your trading approach.
Conclusion
Mastering the smart money concept time frame is a powerful way to enhance your forex trading strategy. By understanding how institutional players operate across different time horizons, you can better align your trades with market-moving forces. Remember to combine this knowledge with solid risk management practices and continuous learning to maximize your potential for success in the forex market.
As you apply these concepts, always remain vigilant and adaptable. The forex market is dynamic, and even smart money strategies require regular refinement. With practice and patience, you’ll develop a keen sense for identifying smart money movements and leveraging them to your advantage.
Ultimately, success in forex trading comes from a combination of knowledge, discipline, and experience. The smart money concept time frame provides a valuable framework for understanding market dynamics, but it’s up to you to apply these insights consistently and responsibly in your trading journey.
How long does it typically take to master the smart money concept time frame?
Mastering the smart money concept time frame is a gradual process that can take several months to years, depending on your dedication and learning curve. It requires consistent practice, analysis, and refinement of your trading strategies. Many successful traders report that it took them at least 6-12 months of focused study and practice to gain a solid understanding of smart money concepts and effectively apply them to their trading.
Can the smart money concept be applied to other financial markets besides forex?
Yes, the smart money concept can be applied to various financial markets, including stocks, commodities, and cryptocurrencies. While the specific dynamics may differ, the core principle of identifying and following the actions of large, institutional players remains relevant across different asset classes. However, it’s important to note that the liquidity and regulatory environment of each market can affect how smart money operates, so some adaptation may be necessary.
Are there any software tools or indicators specifically designed for smart money concept analysis?
While there are no universal tools exclusively for smart money concept analysis, several indicators and software packages can aid in this approach. Some popular tools include:
Volume Profile indicators
Order flow analysis software
Market Profile charts
Institutional candle pattern indicators
Liquidity zone identification tools
It’s important to remember that these tools are aids and should be used in conjunction with a thorough understanding of market dynamics and smart money principles. Relying solely on software without proper knowledge and interpretation can lead to misguided trading decisions.


