

Ever feel lost trying to understand why the market moves the way it does? It’s a common frustration for traders when price action seems unpredictable. But what if you could learn to read the story the charts are telling? Smart Money Concepts (SMC) offer a way to look at the market through the lens of institutional activity. At the heart of this approach lies SMC market structure mapping. This technique helps you interpret price movements to understand potential institutional intentions, turning chaos into clarity. Accurate SMC market structure mapping is a vital skill. This article will guide you through identifying, mapping, and utilizing market structure effectively using SMC principles.

Identifying Basic Market Structure
Before we get into the advanced stuff, let’s nail down the basics of market structure. Price action isn’t random noise; it moves in waves, creating patterns that give clues about market sentiment. Getting these fundamentals right is key for accurate SMC market structure mapping.

Reading Price Action: Impulse and Retracement
Think of price movement like breathing – it pushes out (impulse) and pulls back (retracement). Impulse moves are the strong, energetic pushes that drive the price in a clear direction, covering ground relatively quickly. Retracements are the smaller counter-moves, like catching a breath, where the market corrects slightly against the main push. These often happen as traders take profits or as temporary counter-flow enters the market. Spotting the difference between a powerful impulse and a weaker retracement is your first step in reading the chart’s narrative and essential for good SMC market structure understanding.
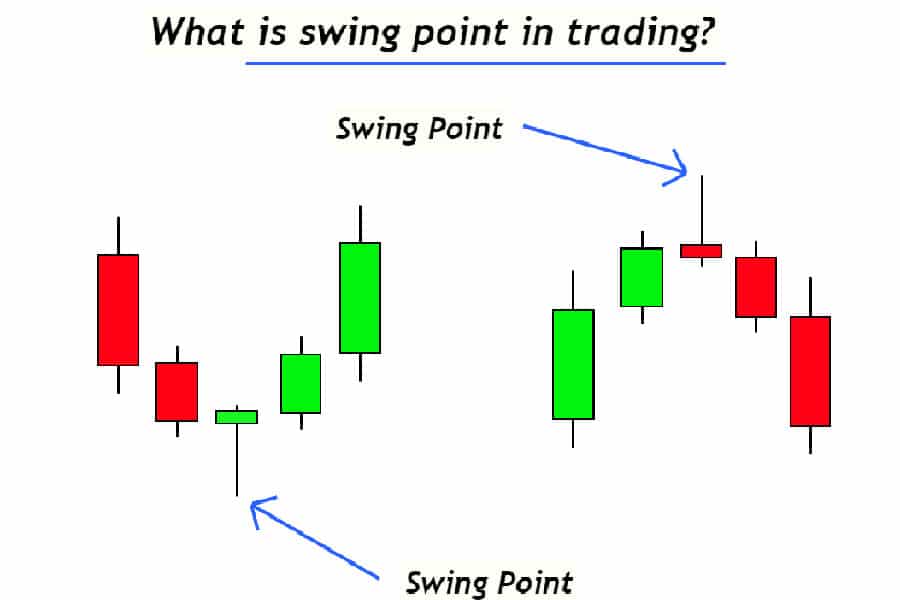
Spotting Highs and Lows (Swing Points)
Swing points are simply the peaks and valleys you see on the chart – the turning points. A swing high is a peak with lower highs on either side, and a swing low is a trough with higher lows beside it. Why do these matter? Because they mark the start and end points of those impulse and retracement legs we just talked about. Identifying these accurately is crucial because, in SMC market structure, these aren’t just random points; they often signify areas where significant buying or selling took place, laying the foundation for mapping the market’s direction.
Identifying Uptrends: Higher Highs & Higher Lows
So, how do you know if the market is trending up? Look for a specific pattern: higher highs (HH) and higher lows (HL). Each impulse pushes price past the previous peak (creating a new HH), and the following pullback finds support above the previous valley (forming an HL). As long as price keeps making this HH-HL sequence, the market structure is considered bullish, telling you buyers are generally in control. Mapping these points helps you visualize the uptrend’s strength and is part of the SMC market structure mapping process.
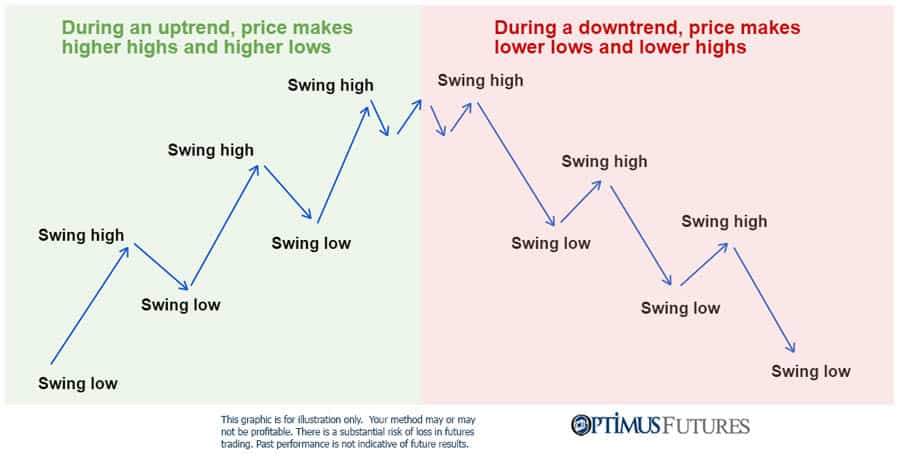
Identifying Downtrends: Lower Lows & Lower Highs
The opposite is true for a downtrend. Here, you’re looking for a sequence of lower lows (LL) and lower highs (LH). Each downward impulse breaks below the previous valley (creating an LL), and the subsequent pullback runs into resistance below the previous peak (forming an LH). This pattern signals that sellers are dominating. Recognizing and mapping these LLs and LHs is essential for understanding the bearish flow within the SMC market structure.
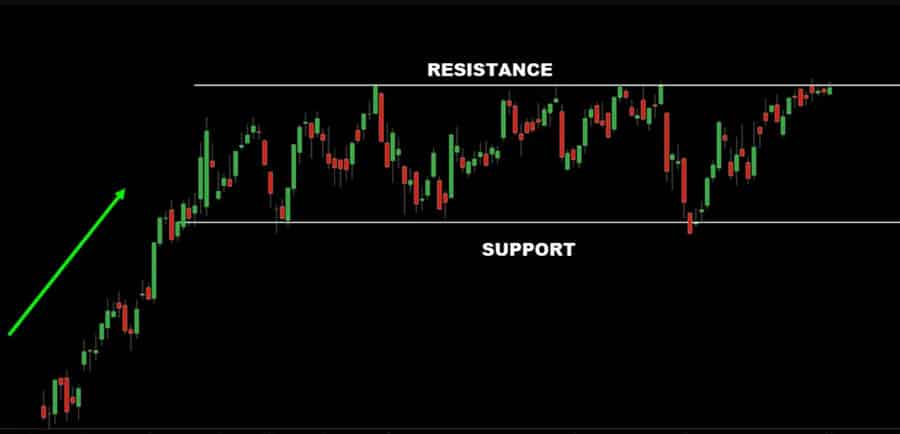
Recognizing Ranging/Consolidation Phases
Markets don’t trend forever. Sometimes, they take a break and move sideways – this is called ranging or consolidation. You’ll notice price bouncing between a defined upper level (resistance) and lower level (support), failing to make consistent higher highs/lows or lower lows/highs. It looks like price is stuck in a box. Recognizing these phases is important because the eventual breakout from a range often kicks off a strong new impulse move. In SMC, these ranges are often seen as periods where institutions might be quietly accumulating or distributing positions, impacting the overall SMC market structure.
The Core Signals: BOS & CHoCH
Once you can spot the basic structure (trends and ranges), you need to understand the signals that tell you if a trend is likely continuing or if it might be changing. For SMC market structure mapping, two critical signals are the Break of Structure (BOS) and the Change of Character (CHoCH).
Read More:Market Structure Break (MSB)
Break of Structure (BOS)
Think of a Break of Structure (BOS) as a confirmation vote for the current trend. It happens when price makes a strong move in the direction of the trend and breaks past a key structural point.
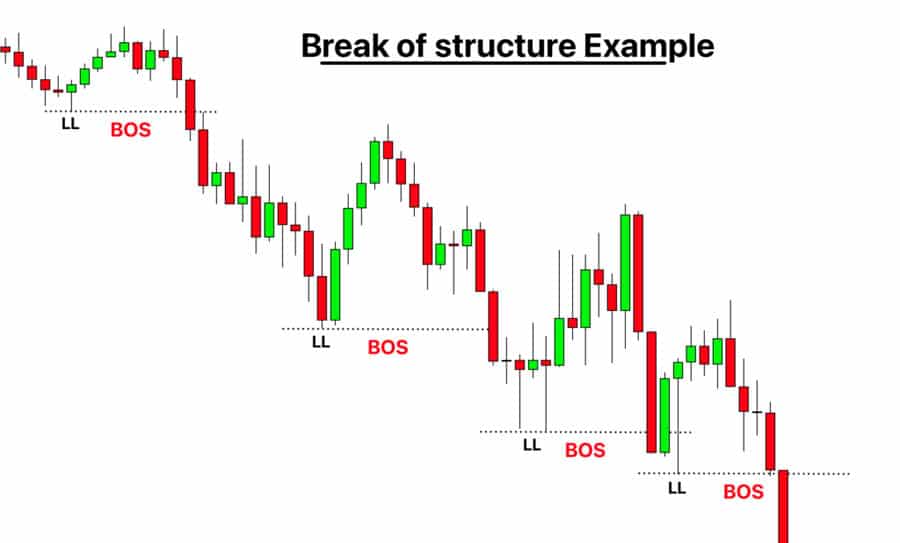
What it looks like: In an uptrend, a BOS occurs when price pushes decisively above the most recent higher high. In a downtrend, it’s when price breaks decisively below the most recent lower low. We’re generally looking for a candle body close beyond the level, not just a quick spike (wick).
Confirming trend continuation: A BOS tells you that the forces driving the trend are still in charge. After seeing a BOS in an uptrend, SMC traders often expect a pullback (to form a new higher low) before price potentially heads higher again. After a BOS in a downtrend, the expectation is a pullback (to form a new lower high) before potentially continuing down.
Practical identification tips: Look for convincing closes beyond the structure point. Sometimes, increased volume on the breakout candle can add extra confirmation. A BOS essentially rubber-stamps the current SMC market structure direction.
Change of Character (CHoCH)
A Change of Character (CHoCH, sometimes pronounced “chock”) is like an early warning flare. It signals that the current trend might be running out of steam and could be about to reverse or at least pull back more significantly. It’s the first real sign that the opposing side is showing some strength within the existing SMC market structure.
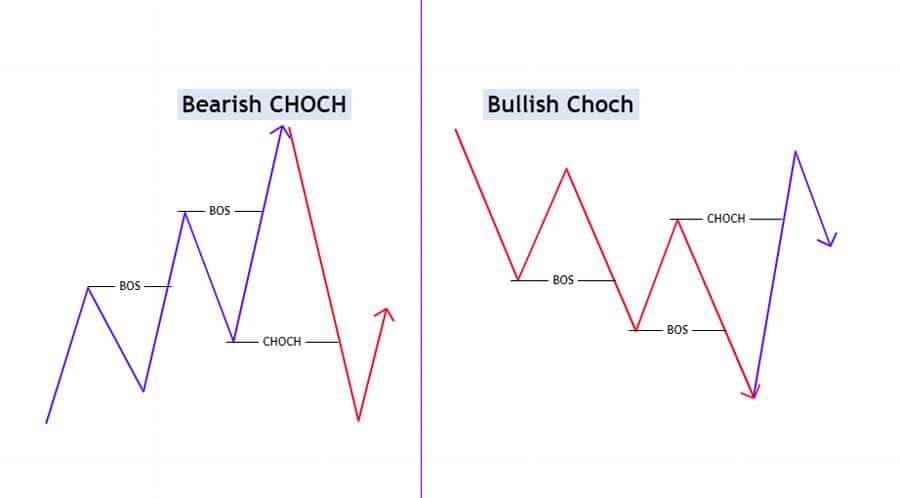
What it looks like: In an ongoing uptrend, a CHoCH happens when price breaks below the most recent higher low (the low that was formed just before the last high was made). In a downtrend, it’s when price breaks above the most recent lower high.
Signaling potential reversals or pullbacks: A CHoCH doesn’t automatically mean the whole trend is over, but it’s a significant event in SMC market structure mapping. It means the structural point that was protecting the trend (the last HL in an uptrend or LH in a downtrend) has failed. This could lead to a much deeper correction against the trend or even be the very beginning of a complete reversal.
Distinguishing CHoCH from a simple pullback: This is super important! A normal pullback in an uptrend respects the previous low; it doesn’t break it. A CHoCH violates that key structural low (or high in a downtrend). Context is key here – looking at higher timeframes helps judge if a CHoCH is likely minor or major when doing your SMC market structure analysis.
Practical Step-by-Step Guide to Mapping Structure
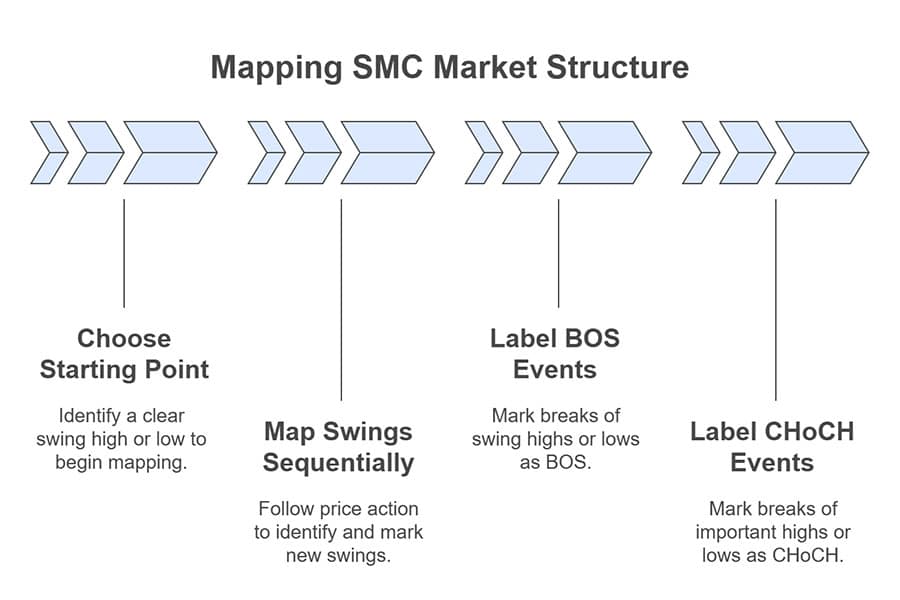
Alright, let’s get hands-on. Mapping SMC market structure isn’t about complex formulas; it’s about systematically observing and marking what price is doing. Here’s how you can approach it step-by-step:
Choosing Your Starting Point
Find a clear, obvious swing high or swing low on your chart to begin your SMC market structure mapping. Pick a point that stands out – a major peak or valley is usually a good place. Don’t stress about getting it perfect immediately; your map will evolve as price action unfolds.
Mapping Swings Highs and Lows Sequentially
From your starting point, follow the price forward. Identify each new swing high and swing low as it forms. Remember the definitions: uptrends make higher highs (HH) and higher lows (HL), while downtrends make lower lows (LL) and lower highs (LH). Mark these points clearly on your chart (you can use simple labels or drawing tools). Connecting the dots helps visualize the flow of the SMC market structure.
Labeling BOS and CHoCH Events As They Occur
This is where you actively interpret the structure. As price moves during your SMC market structure mapping: If it breaks a swing high during an uptrend, label that break as a BOS. If it breaks a swing low during a downtrend, label that as a BOS. If price was trending up but then breaks below the last important higher low, label that as a CHoCH. If price was trending down but then breaks above the last important lower high, label that as a CHoCH. Doing this in real-time helps you understand the market’s story as it happens.
Multi-Timeframe Structure Analysis

Looking at just one chart timeframe is like seeing only one piece of a puzzle. To truly grasp SMC market structure mapping, you absolutely need to look at multiple timeframes. It gives you the bigger picture and helps refine your decisions.
Read More:Multiple Timeframe Strategy
Why Multiple Timeframes Are Non-Negotiable
Think of it like this: market structure exists on all levels, from the yearly chart down to the 1-minute. A strong uptrend on the 15-minute chart might just be a small pullback within a massive downtrend on the Daily chart. If you only watch the 15-minute, you could easily end up trading against the real, dominant market flow controlled by bigger players. Multi-timeframe analysis helps you align your trades with the higher probability direction derived from a thorough SMC market structure mapping.
Using the Higher Timeframe (HTF)
Your Higher Timeframe (HTF) – maybe the Daily or 4-Hour chart – sets the stage. It tells you the main story: Is the market generally bullish, bearish, or just chopping sideways? Mapping the major swing points, BOS, and CHoCH on the HTF identifies the most significant levels where price is likely to react. The HTF dictates the overall direction you should probably be focusing on for your SMC market structure perspective.
Using the Intermediate Timeframe (ITF)
The Intermediate Timeframe (ITF) – perhaps the 1-Hour or sometimes the 15-Minute – acts as a bridge. It helps you zoom in on the structural legs within the larger swings you saw on the HTF. On the ITF, you can identify potential areas of interest (like Order Blocks or Fair Value Gaps, which we’ll cover next) that fall in line with the HTF trend. It helps confirm the shorter-term flow that supports the bigger picture revealed by the broader SMC market structure.
Using the Lower Timeframe (LTF)
Finally, the Lower Timeframe (LTF) – like the 15-Minute, 5-Minute, or even lower – is where you look for your precise entry triggers. Once the HTF gives you the direction and the ITF points to a specific zone, you drill down to the LTF. Here, you watch for small-scale structural shifts (like an LTF CHoCH confirming a reaction at your HTF zone) or an LTF BOS showing that momentum is picking up in your desired direction. This allows for tighter stop losses and pinpoint timing, confirming the SMC market structure shift exactly where it matters most.
Integrating Key SMC Elements Within Structure
SMC market structure mapping gives you the skeleton, but the real magic happens when you layer other key SMC elements onto this framework. These concepts become much more powerful when you find them at important structural locations.
Read More: Identify liquidity in forex
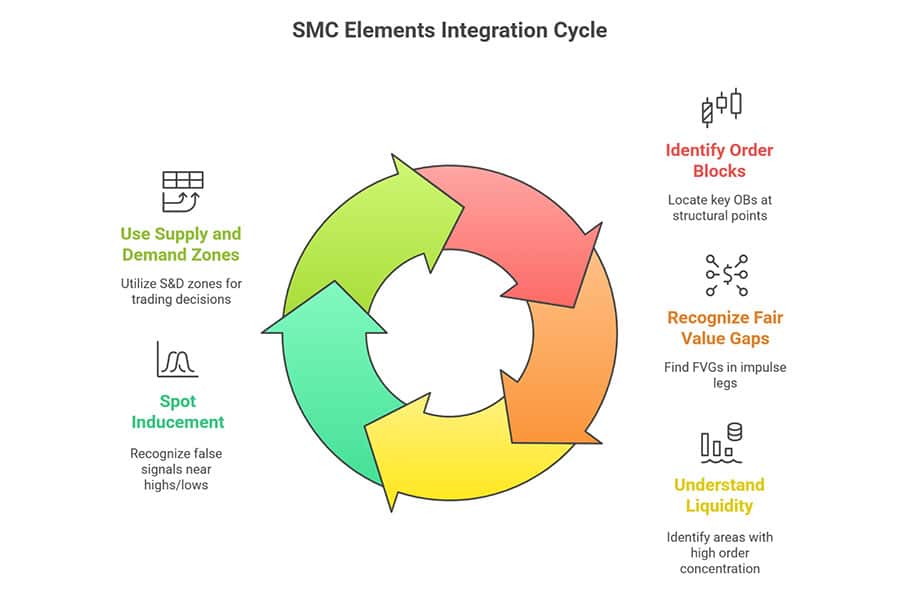
Finding Order Blocks (OBs) at Key Points
Order Blocks (OBs) are basically specific candle(s) showing where a large chunk of orders likely entered the market, often kicking off a strong impulse move. They aren’t all created equal, though. OBs found at key structural points are generally more reliable: The OB that directly caused a Break of Structure (BOS). An OB sitting right at a confirmed swing low (demand) in an uptrend or swing high (supply) in a downtrend. An OB formed right after a Change of Character (CHoCH), potentially hinting at the start of the new move. The underlying SMC market structure helps validate why that OB might be important.
Identifying Fair Value Gaps (FVGs)
Fair Value Gaps (FVGs), also known as Imbalances, are like little ‘vacuums’ in price. They show up during strong, fast moves where price didn’t trade efficiently, leaving a gap between the wicks of three consecutive candles. Why care? Price often tends to revisit these FVGs during a pullback, as if wanting to ‘fill the gap’. Finding FVGs within the impulse legs defined by your structure mapping helps pinpoint potential pullback zones where price might return before continuing the trend confirmed by your BOS. Understanding these within the SMC market structure context is key.
Understanding Liquidity
Liquidity is simply where orders (especially stop-loss orders) are likely sitting. Think above old highs and below old lows. Institutions (“smart money”) sometimes appear to deliberately push price towards these areas to ‘grab’ this liquidity before making their real move. Your SMC market structure map clearly shows you where these pools of liquidity (old HHs or LLs) are. Understanding this helps you anticipate potential ‘stop hunts’ or moves towards liquidity before price respects a structural level like an OB.
Spotting Inducement (IDM)
Inducement (IDM) is a tricky concept related to liquidity. It often looks like an obvious, small pullback high or low forming just before the real structural high or low. This ‘induced’ level tempts impatient traders to jump in early. Price then often sweeps past this minor level (grabbing the liquidity resting there) before heading to the genuine point of interest (like a valid Order Block at the true swing point). Learning to spot potential inducement near key highs/lows, identified through SMC market structure mapping, helps you avoid getting faked out before the real move happens.
Using Supply and Demand Zones Confirmed by Structure
Supply and Demand (S&D) zones are broader areas indicating significant buying or selling pressure. They’re similar to Order Blocks but can cover a wider price range. The real power comes when the formation of an S&D zone leads directly to a clear Break of Structure (BOS). A demand zone that forcefully breaks structure to the upside becomes a high-probability area to look for longs when price pulls back. Likewise, a supply zone causing a downside BOS is a prime spot to look for shorts, confirmed by the SMC market structure break.
Developing Trading Setups Using Structure Mapping
Okay, theory is great, but how do you actually use all this to find trades? The whole point of SMC market structure mapping is to build clear, repeatable trading setups.
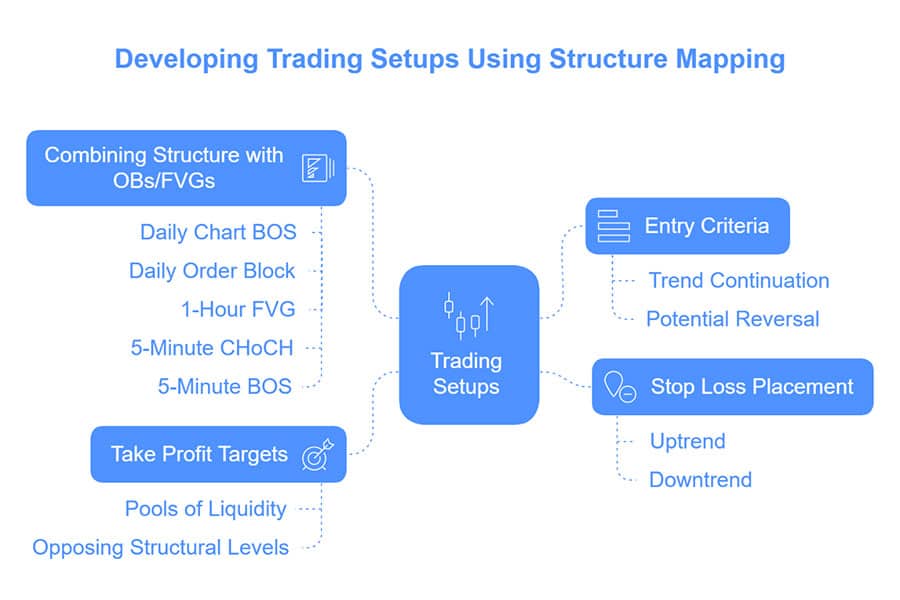
Entry Criteria
Your structure map gives you logical entry points: Trend Continuation: After you see a clear BOS confirming the trend, wait patiently for price to pull back into a significant area within that impulse leg (like an Order Block, a Fair Value Gap, or near the origin of the BOS move).
Then, look for confirmation on a lower timeframe (like a small CHoCH or BOS in your direction) within that zone before entering with the main trend defined by the SMC market structure. Potential Reversal: If you spot a significant CHoCH against the previous trend (especially on a higher timeframe), identify the key zones (OBs, FVGs) that were created during the move that caused that CHoCH. Wait for price to return to one of these zones and again look for lower timeframe confirmation before considering an entry in the new potential direction shown by the shift in SMC market structure.
Stop Loss Placement
Structure provides natural places to hide your stop loss: If you’re going long in an uptrend (after a BOS), place your stop just below the protective higher low (HL) that formed before your entry, or slightly below the specific zone (like an OB) you entered from. If shorting in a downtrend (after a BOS), place the stop just above the protective lower high (LH) or the entry zone. For reversal trades after a CHoCH, the stop usually goes beyond the high/low that was created after the CHoCH occurred, as price breaking back beyond that point would likely invalidate your reversal idea based on the SMC market structure shift.
Take Profit Targets
Where should you aim to get out? Structure helps here too: Obvious targets are the pools of liquidity sitting above recent highs (for longs) or below recent lows (for shorts). Price is often drawn to these levels. Aim for the next significant opposing structural level on a higher timeframe (e.g., the next major swing high/low or a known supply/demand zone indicated by your SMC market structure mapping). Consider taking partial profits at intermediate structural points or when price reaches a major FVG on a higher timeframe.
Combining Structure with OBs/FVGs
The strongest setups often have multiple confirmations lining up. Imagine this: The Daily chart shows a clear BOS to the upside. Price pulls back into a Daily Order Block that started the BOS move. Inside that Daily OB, there’s an unfilled 1-Hour FVG. As price enters this zone, the 5-Minute chart shows a CHoCH (signaling the pullback might be ending) followed by a 5-Minute BOS back to the upside. This kind of layered confirmation, all rooted in solid SMC market structure mapping, significantly boosts confidence in the trade idea.
Common Mistakes and How to Avoid Them
Learning SMC market structure mapping is powerful, but it’s easy to stumble. Knowing the common pitfalls can save you a lot of headaches (and potentially money).
Misinterpreting CHoCH vs. Liquidity Grabs
This is a big one. Sometimes price will quickly poke below a low (or above a high) just to trigger stop losses (a liquidity grab) and then immediately reverse. Traders might mistakenly call this a CHoCH and jump into a reversal trade too early. A real CHoCH tends to be a more convincing break, often with follow-through momentum or a clear structural shift on lower timeframes. Always ask: Was it just a quick spike or a solid break? Did it react strongly off a higher timeframe zone? Don’t treat every tiny break as a major signal in your SMC market structure analysis.
Ignoring Higher Timeframe Structure
Trading solely based on what you see on the 5-minute chart without checking the Daily or 4-Hour is like navigating a ship by looking only at the waves right next to it, ignoring the overall tide and current. You might catch tiny moves, but you risk getting swept away by the bigger trend. Always, always start with the HTF to get your bearings and directional bias. Let the HTF guide your SMC market structure mapping.
Mapping Structure Too Subjectively
It’s tempting to see what you want to see on the chart. Maybe you really want to go long, so you start labeling minor wiggles as higher lows. Try to be objective. Stick to clear, well-defined swing points and BOS/CHoCH rules determined by your SMC market structure approach. If the structure looks messy or unclear, sometimes the best move is to wait for clarity rather than forcing a pattern that isn’t really there. Consistency in how you map is key.
Chasing Every Minor BOS/CHoCH on Low Timeframes
The 1-minute chart is full of tiny structural breaks back and forth – it’s mostly noise! Trying to trade every little BOS or CHoCH on these super low timeframes will likely lead to frustration, overtrading, and losses due to spreads and commissions. Focus your attention on structural breaks that happen at significant levels identified on your higher/intermediate timeframes and that align with the overall picture from your SMC market structure mapping.
Opofinance Services: Trade with Confidence
Effectively applying SMC market structure mapping requires not just knowledge but also the right tools and a reliable broker. Opofinance, regulated by ASIC, provides a supportive trading environment:
- Advanced Trading Platforms: Choose from popular platforms like MT4, MT5, cTrader, or use the user-friendly OpoTrade platform to execute your structure-based strategies smoothly.
- Innovative AI Tools: Enhance your analysis with tools like the AI Market Analyzer (potentially helping spot structural patterns), an AI Coach for insights, and responsive AI Support.
- Diverse Trading Options: Explore different avenues like Social Trading to learn from others or Prop Trading programs if you’re looking to trade with larger capital.
- Secure & Flexible Transactions: Enjoy peace of mind with secure deposit and withdrawal options, including crypto payments, offered with zero fees charged by Opofinance for these transactions.

Ready to put your SMC skills to work with a broker that supports your trading journey? Check out Opofinance today!
Conclusion
Getting good at SMC market structure mapping is key if you want to understand the market using Smart Money Concepts. It helps you move past just seeing lines on a chart to actually interpreting the potential flow of institutional orders. By consistently identifying trends, key breaks (BOS), and potential shifts (CHoCH) across different timeframes, and linking this with concepts like Order Blocks and liquidity, you build a solid foundation. It takes practice, but mastering SMC market structure allows you to spot better trade opportunities and trade more confidently with the market’s flow.
Key Takeaways
- Structure is Foundational: Knowing uptrends (HH/HL) and downtrends (LL/LH) is the starting point for SMC market structure mapping.
- BOS Signals Continuation: A Break of Structure acts as confirmation that the current trend is likely ongoing.
- CHoCH Signals Potential Change: A Change of Character warns that the trend might be reversing or pulling back significantly.
- Multi-Timeframe is Crucial: Always analyze the HTF (big picture), ITF (refining zones), and LTF (entry timing) for comprehensive SMC market structure analysis.
- Integrate SMC Elements: Use Order Blocks, FVGs, Liquidity, and Inducement alongside structure for stronger analysis.
- Develop Clear Setups: Use your SMC market structure map to define entries, stops, and profit targets logically.
- Avoid Common Pitfalls: Know the difference between CHoCH and liquidity grabs, respect the HTF, stay objective, and avoid LTF noise.
What are the best timeframes to use for SMC market structure mapping?
There isn’t a single “perfect” set, as it depends on your trading style (scalper, day trader, swing trader). A popular combination is Daily/4-Hour for the Higher Timeframe (HTF) direction, 1-Hour/15-Minute for the Intermediate Timeframe (ITF) to find zones within the HTF legs, and 15-Minute/5-Minute/1-Minute for the Lower Timeframe (LTF) to pinpoint entries and confirmations within those zones.
How do you handle conflicting market structures on different timeframes?
This happens often! The general rule is: the higher timeframe usually wins. If the Daily chart is clearly bullish (making HH/HL) but the 15-minute chart just printed a bearish CHoCH, that 15-minute signal is more likely just indicating a pullback within the larger Daily uptrend. Try to prioritize trades that align with the HTF bias identified through your SMC market structure mapping. LTF signals going against the HTF might just be temporary pullbacks.
Can SMC market structure mapping be applied to assets other than Forex?
Yes, definitely. The principles behind SMC market structure mapping rely on universal concepts of price action, supply/demand, and order flow. These apply to any liquid market where you can see clear price charts. You can effectively use these techniques on indices (like S&P 500), commodities (like Gold or Oil), cryptocurrencies, and even individual stocks.


