So, you’re in the trading world, trying to make sense of those squiggly lines on your charts, and you keep hearing about two big ways to do it: the classic support and resistance (S&R) and the newer kid on the block, Smart Money Concepts (SMC). It can feel a bit like standing at a crossroads. Which path do you take?
Both aim to help you figure out where prices might go, but they have fundamentally different ideas about why prices move. This guide is all about digging deep into the SMC vs Support and Resistance discussion, laying out the practical differences, and helping you figure out which approach—or maybe a blend of both—is going to be your best friend in the markets.
What is Support and Resistance?
Support and resistance (S&R) is like the foundation of a house in the world of technical analysis. It’s a method traders have used for generations to get a feel for a market’s key levels. Think of it as mapping out the market’s memory—identifying price points where traders, as a group, have made big decisions in the past.
Defining Support Levels: Where Buyers Step In
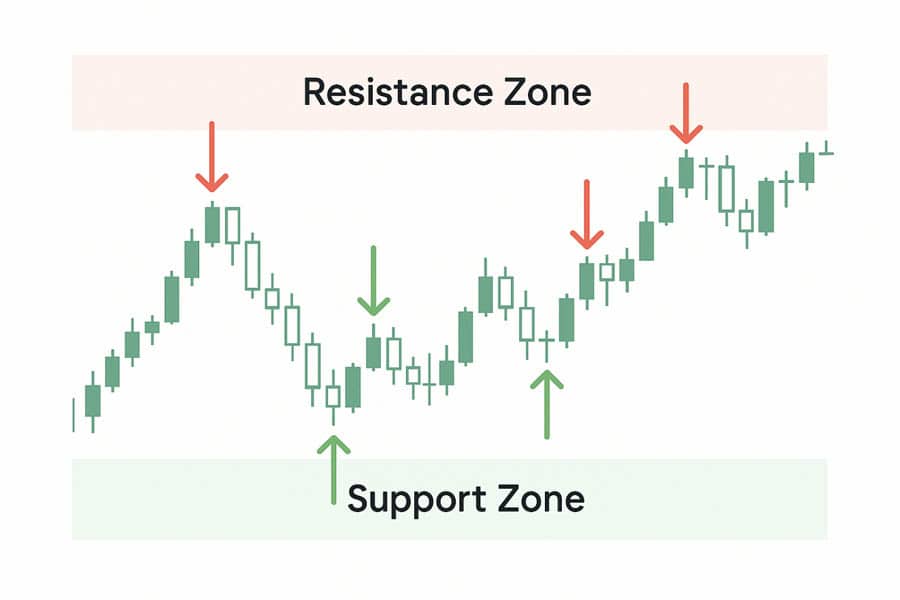
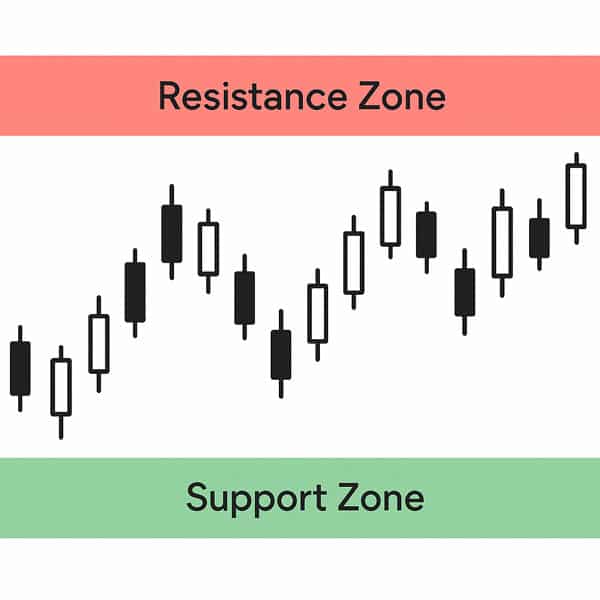
Support is a price area where buyers have consistently shown up in the past, stopping the price from falling any further. It’s like a safety net for the price.
- How to Actually Find Support: Don’t just look for one point. You want to find a zone where the price has turned around at least two or three times. Instead of a single, perfect line, it’s much more realistic to draw a box or a “zone” around these lows. Why? Because the market is messy. Price will almost never reverse at the exact same pip. A zone gives you some breathing room and accounts for the spiky candle wicks that can throw you off.
Defining Resistance Levels: Where Sellers Take Over
Resistance is the ceiling. It’s a price zone where sellers have historically overwhelmed buyers, putting a cap on how high the price can go.
- How to Actually Find Resistance: Just like with support, you’re looking for a cluster of peaks where the price has tried to push higher but failed. Draw a zone connecting these highs. This area represents a psychological barrier where traders start thinking, “Okay, this is getting too expensive.” The more times a resistance zone has been tested and held, the more traders will be watching it, which is a key concept in the support and resistance vs SMC comparison.
The Psychology: Why S&R Even Works
The magic behind S&R isn’t really magic at all—it’s just human nature. We remember things. A trader who bought at a support level and made money is very likely to want to buy there again. A trader who shorted at a resistance level and watched the price drop will be tempted to do the same thing next time. This creates a kind of self-fulfilling prophecy. Because everyone is watching these levels, they become important.
Practical S&R Trading Strategies You Can Use
You can do more than just buy at support and sell at resistance. Here are a couple of smarter ways to use these levels:
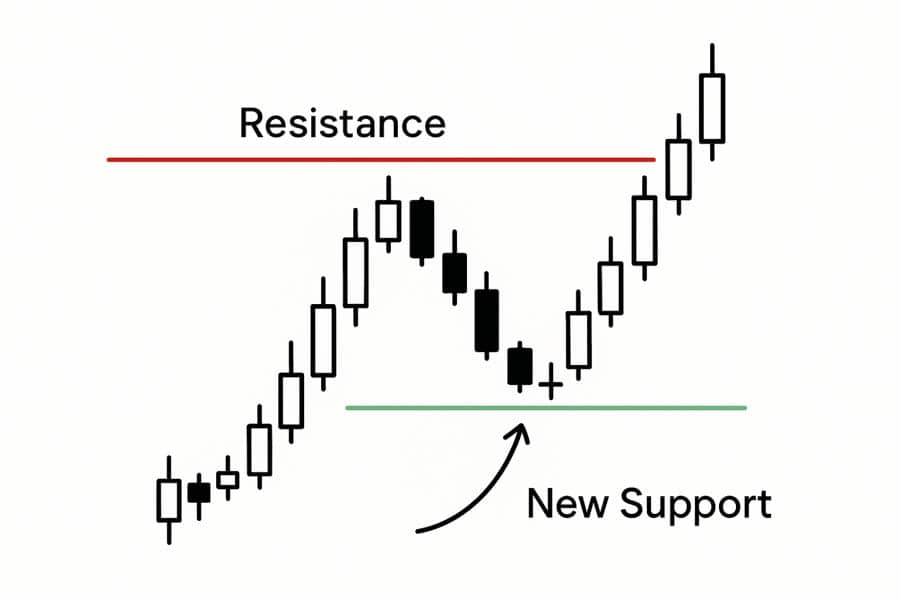
- The “Flip”: Breakout and Retest: This is a fan favorite for a reason. When price breaks through a strong resistance level, don’t just jump in. That’s how you get caught in a “fake-out.” Instead, be patient. Wait for the price to come back down and retest that old resistance level from the other side. If that old ceiling now acts as a new floor (a “resistance-turned-support flip”), it’s a much stronger signal that the breakout is real. This is a solid, conservative entry technique.
- Finding Confluence: Don’t trade a level in isolation. Look for other clues that back up your idea. For instance, if the price is dropping to a major support zone and, at the same time, a momentum indicator like the MACD is showing a bullish crossover, that’s “confluence.” You have two different tools telling you the same story, which greatly increases your confidence in the trade.
The Good and The Bad of Trading with S&R
The best thing about S&R is that it’s straightforward and works in any market. You can use it on a chart of Apple stock just as easily as on a EUR/USD forex chart. The biggest downside? Everyone knows about these levels. This popularity makes them prime targets for big players who want to trigger stop-losses, which brings us to the other side of the SMC vs Support and Resistance argument.
Read More: The Smart Money Concept
What are Smart Money Concepts (SMC)? The New School of Thought
Smart Money Concepts (SMC) is a trading philosophy that says the market isn’t a fair and level playing field. It suggests that “smart money”—the big institutions with deep pockets—are actively moving prices to suit their needs, and they do it by outsmarting retail traders.
The Core Idea Behind SMC Trading
Here’s the central theory: if a huge bank wants to buy $5 billion worth of a currency, they can’t just click “buy.” An order that big would instantly spike the price, and they’d get a terrible average entry. So, how do they do it? SMC theory says they need to find a ton of sellers to buy from. And where are all the sellers? They are at the stop-loss orders of retail traders who are already long.
So, the institution might push the price down first, hitting a well-known support level to trigger all those stop-losses (which are sell orders). Once they’ve absorbed all that selling liquidity, they can fill their own massive buy orders and then let the price rip higher. The entire SMC vs Support and Resistance worldview hinges on this concept of engineered liquidity.
The SMC Lingo, Explained Simply
To get into SMC, you have to learn the vocabulary. It sounds complex, but each term describes a specific piece of this puzzle.
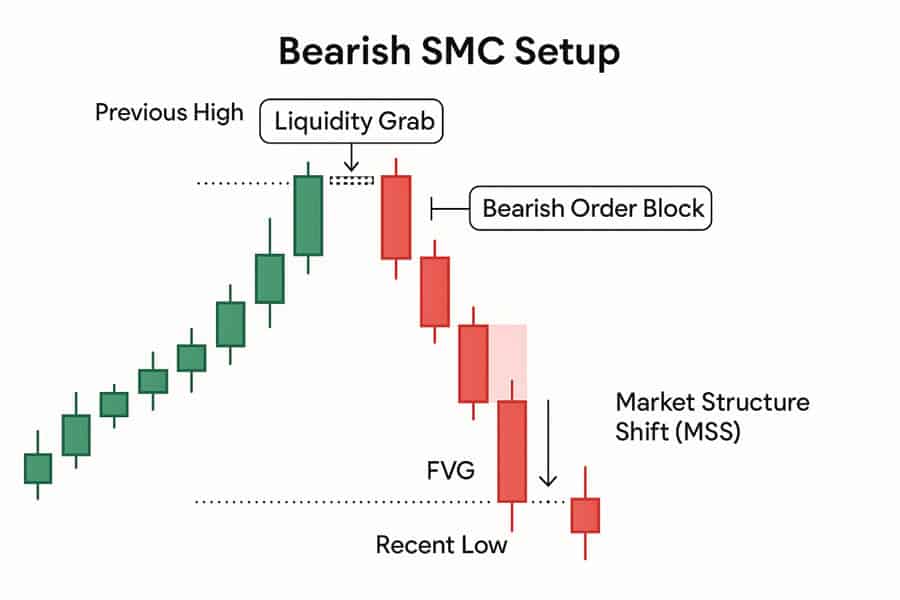
- Liquidity: In simple terms, this is where the money is. On a chart, liquidity is sitting right above obvious highs (double tops) and right below obvious lows (double bottoms). SMC traders see these clear patterns as traps waiting to be sprung.
- Order Block (OB): This is your main point of interest. An order block is usually the last down-candle before a powerful move up (for a bullish OB), or the last up-candle before a strong move down. It’s believed to be the spot where an institution placed a huge chunk of its order. High-probability order blocks are those that lead to a break in market structure.
- Liquidity Grab / Stop Hunt: This is what it looks like on the chart when the institutions make their move. You’ll see a fast, aggressive wick that pokes just above an old high or below an old low, clearing out all the stop-losses, before the price violently reverses. What a traditional trader might call a “fake breakout,” an SMC trader calls a successful stop hunt.
- Imbalance / Fair Value Gap (FVG): Look for a big, powerful candle that leaves a gap between its wick and the wick of the candle two bars over. This indicates that price moved so quickly that one side of the market was completely overwhelmed. SMC teaches that the price often comes back to “fill” this gap to make the market more efficient, giving you a great potential entry spot.
- Market Structure Shift (MSS): This is your confirmation signal—the sign that the tide has turned. If the market is making a series of higher highs and higher lows (an uptrend), an MSS is the first time it makes a clean break below the most recent higher low. It’s a huge clue that the sellers might be taking control.
How SMC Sees Traditional S&R Levels
This is where the practical difference in the SMC vs Support and Resistance debate really hits home. A classic S&R trader sees a clean resistance line and thinks, “Great, I’ll sell here.” An SMC trader sees that same line and thinks, “That’s bait.” They fully expect the price to push through that level first to grab all the stop-losses from the early sellers. The real move down, they believe, will only start after that liquidity has been taken.
Read More: Identifying Support and Resistance in Forex
Key Differences: SMC vs Support and Resistance – A Practical Breakdown
The way you approach your charts, place your trades, and manage your risk will be vastly different depending on whether you’re looking through an S&R lens or an SMC lens. Let’s really get into the nitty-gritty of these differences.
Core Market Philosophy: Who’s Really in Charge?
- S&R Viewpoint: The market is fundamentally an auction. Prices turn at historical levels because that’s where the collective supply and demand balance shifts. If there are more willing sellers than buyers at a certain price (resistance), the price naturally goes down. It’s an organic process driven by the crowd.
- SMC Viewpoint: The market is more like a highly sophisticated game, with large institutions as the main players who actively engineer price movements. Those “obvious” S&R levels are not just historical markers; they are strategic points that institutions use to their advantage to accumulate liquidity for their large orders. The support and resistance vs SMC divergence here is massive: one sees a democratic market, the other sees an oligarchic one.
Interpretation of Price Levels and “Traps”: Accidental or Intentional?
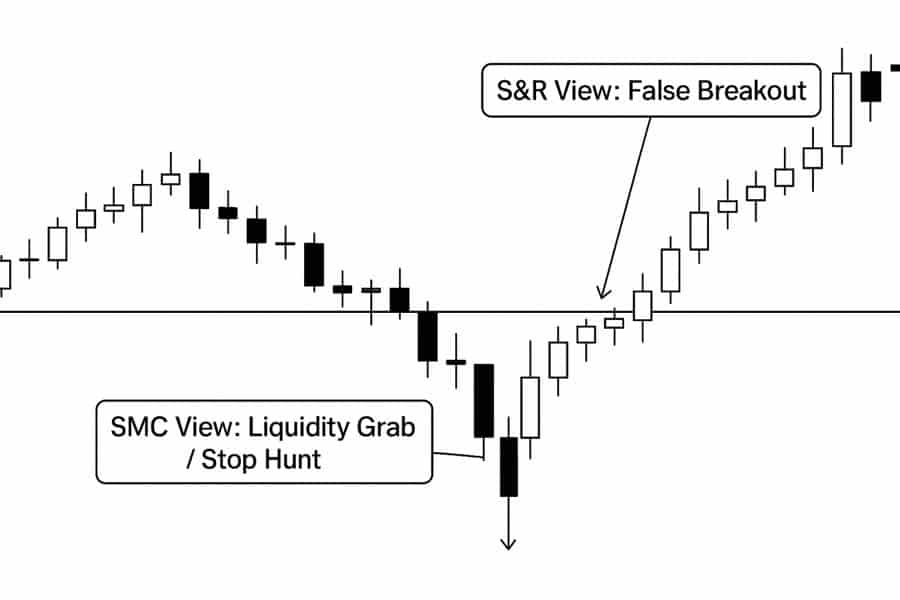
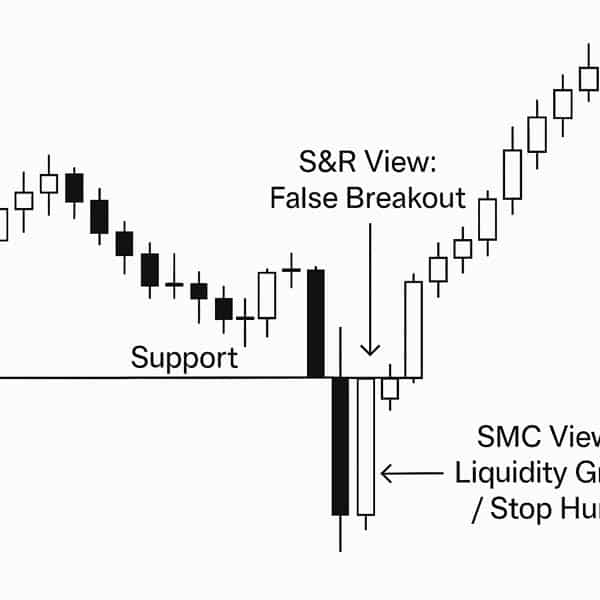
- S&R Viewpoint: When price briefly pokes through a well-defined support level and then quickly reverses back above it, that’s often labeled a “false breakout” or a “failed move.” It’s seen as a tricky market condition that might have unfortunately trapped some traders. The integrity of the support level itself might still be considered valid.
- SMC Viewpoint: From an SMC perspective, there’s often no such thing as a truly “false” breakout in these scenarios. That quick poke below support and rapid reversal is frequently interpreted as a deliberate “stop hunt” or “liquidity grab.” It wasn’t a failed move by the market; it was a successful maneuver by smart money to trigger the sell-stop orders resting below that support (creating buy-side liquidity for them) before initiating their intended upward move. This is a critical distinction in the SMC vs Support and Resistance comparison, turning perceived market noise into potential signals of intent.
Approach to Risk Management and Stop Placement: Precision vs. Zones
- S&R Viewpoint: Risk is typically managed by placing a stop-loss order a reasonable distance beyond the identified support or resistance zone. For instance, when buying at a support zone, the stop-loss would be placed below the lowest point of that zone. This often results in relatively wider stop-losses, especially if the S&R zone itself is broad.
- SMC Viewpoint: SMC can often facilitate much more precise stop-loss placement, leading to potentially higher risk-to-reward ratios. After identifying a liquidity grab (e.g., a stop hunt below an old low) followed by a confirming market structure shift (e.g., price breaking a recent swing high), an SMC trader might look to enter on a retest of a specific point of interest, like a refined order block or an FVG created during the reversal. The stop-loss can then be placed just beyond the extreme of the liquidity grab (the low of the stop hunt). This precision is a key practical advantage cited by SMC proponents.
Complexity, Learning Curve, and Trader Focus: Lines vs. Narratives
- S&R Viewpoint: The primary focus is on identifying and drawing horizontal (or sometimes diagonal trendline) support and resistance levels based on historical price action. The analysis is relatively static; you define your key levels and then wait for the price to react at these predefined zones. The learning curve is generally considered gentler.
- SMC Viewpoint: The focus is much more on understanding the unfolding “narrative” of price action. An SMC trader is constantly asking questions like: “Where is the most obvious liquidity resting? Who appears to be in control of the current price leg? Have we seen clear signs of institutional accumulation or distribution? Was that recent move a genuine break or a liquidity grab?” The analysis is far more dynamic, requires a deeper interpretation of candlestick patterns and order flow, and typically has a steeper learning curve due to its specialized terminology and conceptual framework. This difference in analytical depth is a major factor in the SMC vs Support and Resistance choice.
Read More: The difference between ICT and SMC trading
Combining SMC and Support and Resistance: Creating a Hybrid Powerhouse?
Here’s a thought: what if you don’t have to exclusively pick one side in the SMC vs Support and Resistance showdown? Many experienced traders find that the most robust approach involves blending elements from both methodologies, leveraging the strengths of each to create a more nuanced and powerful trading strategy.
How to Build an Effective Hybrid Trading Strategy: The “Macro to Micro” Flow
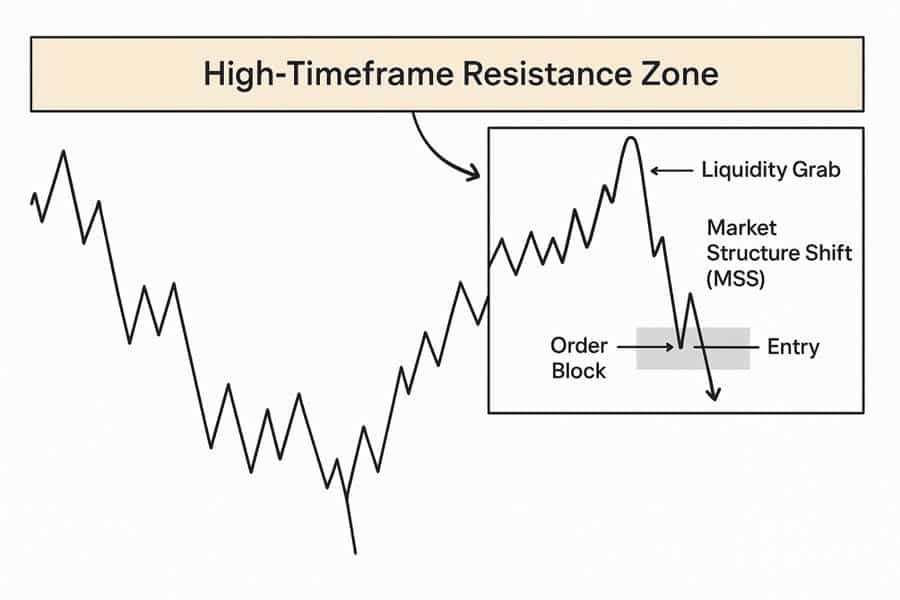
The most common and arguably most effective way to create a hybrid strategy is to use traditional support and resistance for high-level, big-picture context, and then use Smart Money Concepts for precise entry timing and trade management. Think of it as using S&R to identify the major battlegrounds, and SMC to pick your moment of engagement.
- Macro Analysis with S&R (The “Where”): Start your analysis on the higher timeframes – think Daily, Weekly, or even Monthly charts. Identify the major, long-standing, and highly obvious support and resistance zones. These are your primary areas of interest, the zones where you anticipate a significant market reaction is most likely to occur. These are your “Points of High Confluence.”
- Micro Analysis with SMC (The “When” and “How”): Once the price action enters one of your pre-identified high-timeframe S&R zones, don’t just blindly place a trade based on the zone alone. This is where you zoom in. Drop down to lower timeframes – like the 1-hour, 15-minute, or even 5-minute chart – and switch your analytical hat to SMC.
- The Entry Trigger: Waiting for the SMC Confirmation: On the lower timeframe, you’re now patiently watching for a specific SMC signature to confirm your trade idea. This typically involves:
- A clear liquidity grab (stop hunt) that pushes just beyond the boundary of your high-timeframe S&R zone. For example, if price is at a daily resistance zone, you’d look for it to briefly trade above the high of that zone.
- Followed by a decisive Market Structure Shift (MSS) or Change of Character (CHoCH) in the opposite direction of the liquidity grab. So, after poking above daily resistance, you’d want to see a strong move down that breaks a recent swing low on your lower timeframe.
- This MSS often leaves behind a new order block or FVG that can serve as your precise entry point upon a retest.
This confluence – a major S&R level being interacted with, a clear sign of engineered liquidity (the grab), and then a confirmed shift in momentum (the MSS) – creates a very high-probability trade setup. It filters out many of the “noise” trades you might take with a pure S&R approach.
A Detailed Hybrid Trade Example: Seeing it in Action
Let’s imagine the EUR/USD pair is approaching a major weekly resistance zone that you’ve identified between 1.0950 and 1.0980.
- A Pure S&R Trader’s Approach: Might set a sell limit order somewhere within that zone, perhaps at 1.0965, with a stop-loss placed above the zone, say at 1.1010.
- A Hybrid SMC/S&R Trader’s Approach:
- Context: They note the weekly resistance zone.
- Patience: They wait for price to enter and interact with this zone. Let’s say price pushes up to 1.0990, slightly piercing the top of the weekly zone. This is flagged as a potential liquidity grab (buy-side liquidity taken).
- Confirmation (Lower Timeframe): They drop to the 15-minute chart. After the spike to 1.0990, they observe a very strong bearish move that breaks below the most recent 15-minute swing low (let’s say that low was at 1.0970). This is their Market Structure Shift, signaling sellers are stepping in aggressively.
- Entry Point: This sharp bearish move likely left behind a 15-minute bearish order block or an FVG near the origin of the MSS. They might look to enter a short position if price retraces back up to test this 15-minute order block (e.g., around 1.0980-1.0985), with a much tighter stop-loss placed just above the high of the liquidity grab (e.g., at 1.0995).
This hybrid approach allows the trader to leverage the reliability of major S&R zones for direction but uses the precision of SMC for entry and risk management, often leading to better risk-to-reward ratios and a higher strike rate. This practical application highlights the potential synergy in the SMC vs Support and Resistance relationship when combined thoughtfully.
Which is Better: SMC or Support and Resistance? The Big Question for Every Trader
Ultimately, after all the explanations and examples, traders want to know: which one of these is actually “better”? The most honest and practical answer is that it’s not about one being objectively superior to the other; it’s about which one aligns best with your individual trading personality, your psychological makeup, and how you best process market information.
It’s About Your Trading Personality, Not a Universal “Best”
There is no “holy grail” trading system that works perfectly for everyone all the time. You will find highly successful, professional traders who swear by pure, classic support and resistance, and you’ll find equally successful traders who are die-hard Smart Money Concepts advocates. And, of course, many who blend the two. The effectiveness of any trading strategy comes down to:
- How deeply you understand its principles.
- How disciplined you are in consistently applying its rules.
- How well it fits your natural strengths and mitigates your weaknesses as a trader.
- You Might Prefer S&R If: You value simplicity, clear visual cues, and a more objective framework. If you’re a methodical thinker who likes easily identifiable levels and straightforward rules, the logic of support and resistance will likely resonate more strongly with you.
- You Might Prefer SMC If: You enjoy peeling back the layers, understanding the potential “why” behind price movements, and engaging with a more narrative-driven approach. If you’re a dynamic thinker who isn’t intimidated by complexity and enjoys the challenge of trying to anticipate institutional behavior, then the depth of Smart Money Concepts might be a better fit.
The answer to the SMC vs Support and Resistance question is deeply personal. It’s less about finding the “winning” methodology and more about finding the methodology that wins for you.
Final Advice for Developing Traders: A Sensible Path Forward
Don’t feel pressured to pick a side immediately or become an expert in both overnight. For many traders, a very logical and effective progression is to:
- Master the Basics First: Start by building a rock-solid foundation in understanding basic market structure – identifying trends (uptrends, downtrends, ranges), swing highs and lows, and, crucially, how to correctly identify and draw meaningful support and resistance zones. This is like learning the fundamental grammar and vocabulary of the financial markets.
- Then Explore SMC: Once you are comfortable and confident in your S&R analysis, then begin to explore the concepts of SMC. You’ll find that your prior understanding of S&R will actually make it much easier to grasp SMC principles. For instance, when you learn about liquidity grabs in SMC, you’ll have a much better idea of which obvious S&R levels are the most likely targets for such maneuvers.
- Demo Trade Extensively: Whichever path you lean towards, or if you’re experimenting with a hybrid model, rigorously test your approach in a demo account with no real money on the line. This allows you to gain experience, make mistakes without financial consequence, and see which methodology consistently produces results for you and feels most intuitive. The support and resistance vs SMC journey is one of self-discovery and empirical testing.
Opofinance: Your Partner in Trading
No matter which strategy you use in the SMC vs Support and Resistance debate, you need a solid broker. As an ASIC-regulated broker, Opofinance provides the professional tools you need in a secure environment. They offer top-tier platforms like MT4 and MT5, unique AI-powered tools to give you an edge, and opportunities in social and prop trading. With secure transactions, including crypto, and zero fees from their side, they offer a robust platform for modern traders.

Explore Opofinance’s Services Today!
Conclusion: Embracing Nuance in the SMC vs Support and Resistance Debate
In the final reckoning of the SMC vs Support and Resistance comparison, it’s vital to understand that this isn’t about finding a single, universally “correct” answer. Both methodologies offer valuable, albeit different, frameworks for interpreting the complex dance of market prices. Support and resistance provides a time-tested, accessible, and intuitive map of historical price behavior and potential turning points.
Smart Money Concepts, on the other hand, offers a more intricate and compelling narrative about institutional order flow and the potential for engineered price movements. The most astute traders often move beyond an “either/or” mentality and instead learn to appreciate the unique insights each approach can provide. By understanding the core philosophies, strengths, and weaknesses of both SMC and support and resistance, you empower yourself to build a more comprehensive, adaptable, and ultimately more effective trading strategy that is uniquely tailored to your strengths and perspective.
Key Takeaways
- The core of the SMC vs Support and Resistance debate lies in how key price levels are interpreted: as organic historical barriers (S&R) or as deliberately engineered targets for institutional liquidity acquisition (SMC).
- Support and resistance is generally simpler to learn and apply, focusing on visible historical price reactions and collective market psychology.
- Smart Money Concepts is more complex, requiring an understanding of specialized terminology and a narrative-driven interpretation of institutional behavior and order flow.
- A hybrid approach, often using S&R for broader market context and SMC for precise entry triggers after confirming institutional activity (like a liquidity grab), can be a very powerful strategy.
- The “best” methodology is subjective; it’s the one that aligns with your individual trading personality, risk tolerance, and analytical preferences, and that you can apply with consistency and discipline.
- Ultimately, sustained profitability in trading hinges more on your mastery of your chosen strategy and robust risk management than on the inherent superiority of any single analytical system. Understanding the nuances of support and resistance vs SMC is a key step in that mastery.
Is SMC just a more complicated version of Wyckoff theory?
They are closely related. Wyckoff provides the big-picture market cycle, while SMC focuses on the specific, candle-by-candle mechanics (like order blocks) that drive those cycles.
I’m a beginner and SMC seems really overwhelming. Should I just ignore it?
It’s best to master the basics first. Get comfortable with standard support and resistance, then explore SMC. This way, you’ll understand the “obvious” levels that SMC concepts are built around.
Do I need special indicators or software to trade SMC?
No, not at all. SMC is a pure price action strategy. All the analysis is done on a clean candlestick chart with no special indicators required.


