

The stochastic rsi and macd strategy is a powerful trading method that combines three popular technical indicators to generate confirmed entry and exit signals. This approach aims to filter out market noise by requiring a consensus from the Moving Average Convergence Divergence (MACD), the Relative Strength Index (RSI), and the Stochastic Oscillator. In this guide, we will explore the precise settings, rules, and practical application of this strategy, providing a clear framework that even an online forex broker can offer to their clients for analysis.
Key Takeaways
- Triple Confirmation: The strategy’s strength lies in requiring signals from MACD, RSI, and the Stochastic RSI simultaneously, which helps filter out false signals and improve accuracy.
- Specific Settings: It relies on standard indicator settings (MACD 12,26,9; Stochastic 14,3,3; RSI 14) which are readily available on most trading platforms.
- Optimal Timeframes: This method is most effective on intraday charts, particularly the 15-minute, 30-minute, and 1-hour timeframes, where momentum and trend are clearly definable.
- High Win Rate Potential: Backtesting has shown that the stochastic rsi and macd strategy can achieve win rates between 52% and 73%, with an average gain of 0.88% per trade.
- Dynamic Exits: Instead of fixed stop-loss orders, the strategy uses indicator-based signals for exiting trades, allowing for more flexibility in changing market conditions.
Core Strategy Components

To effectively implement this triple indicator strategy, understanding the role and configuration of each component is crucial. Each indicator serves a unique purpose—trend, momentum, and overbought/oversold conditions. When their signals align, they create a high-probability trading setup. Getting the settings right is the first step toward mastering this powerful method. From my experience, using the standard, time-tested configurations provides the most reliable results and avoids the trap of over-optimization.
MACD Settings: 12-26-9 Configuration
The Moving Average Convergence Divergence (MACD) is the cornerstone of our trend and momentum analysis. We use the standard 12-26-9 setting. Here’s what it means:
- The 12-period EMA: This is the faster-moving average, reacting more quickly to recent price changes.
- The 26-period EMA: This is the slower-moving average, providing a more stable trend baseline.
- The 9-period EMA (Signal Line): This is an EMA of the MACD line itself. Crossovers between the MACD line and this signal line are what generate our primary buy or sell triggers.
The MACD’s main job in the stochastic rsi and macd strategy is to confirm the direction of momentum. A crossover is not just a line on a chart; it represents a potential shift in the underlying balance between buyers and sellers.
Stochastic Parameters: 14-3-3 Setup
The Stochastic Oscillator helps us identify overbought or oversold conditions and confirm short-term momentum. We use the common 14-3-3 parameters. This indicator compares a particular closing price of an asset to a range of its prices over a certain period of time. In our strategy, we aren’t just looking for the classic 80/20 overbought/oversold levels. Instead, we use the 50-level as a simple filter. A Stochastic reading above 50 suggests bullish pressure, while a reading below 50 indicates bearish pressure. This simple tweak makes it a powerful confirmation tool for the stochastic rsi and macd strategy.
RSI Configuration: 14-Period Standard
The Relative Strength Index (RSI) is another momentum indicator, but it measures the speed and change of price movements. With a standard 14-period setting, the RSI provides a broader view of market momentum than the Stochastic. Similar to our use of the Stochastic, we utilize the 50-level of the RSI as a key dividing line. When the RSI is above 50, it signals that the market’s overall momentum is bullish. When it’s below 50, momentum is considered bearish. This acts as our third and final layer of confirmation in the macd stochastic rsi strategy.
Optimal Timeframes for This Strategy
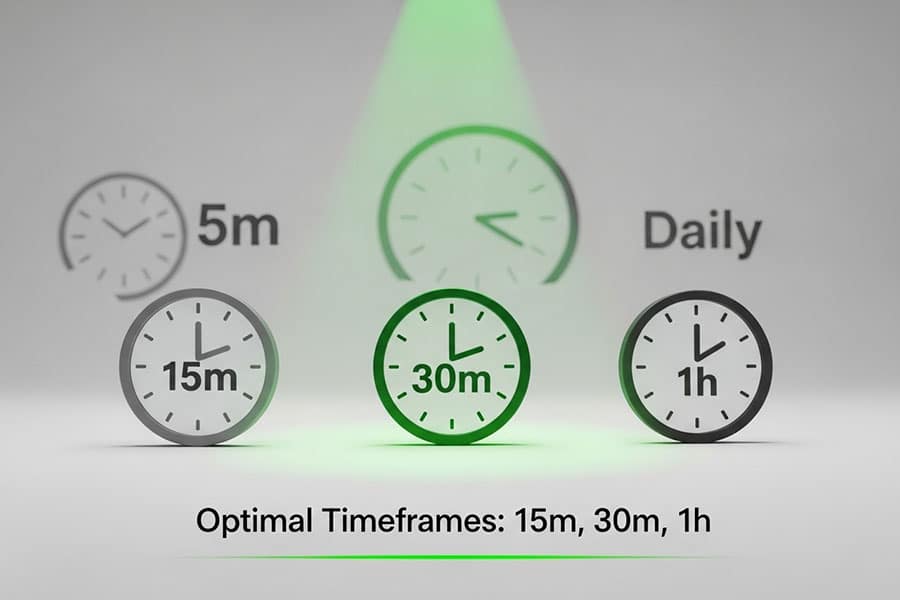
While this strategy can be adapted, I have found it performs most reliably on intraday charts, specifically the 15-minute (M15), 30-minute (M30), and 1-hour (H1) timeframes. These charts offer a sweet spot—they capture enough price action to establish a clear trend for the MACD, yet they are dynamic enough for the RSI and Stochastic to provide timely momentum signals. Trading on charts lower than 15 minutes can introduce significant market noise, leading to false signals. Conversely, on daily charts, the signals can be too infrequent for an active trader. The stochastic rsi macd trading strategy thrives on the balance of frequency and clarity found in these intraday timeframes.
Entry Signal Rules for High Probability
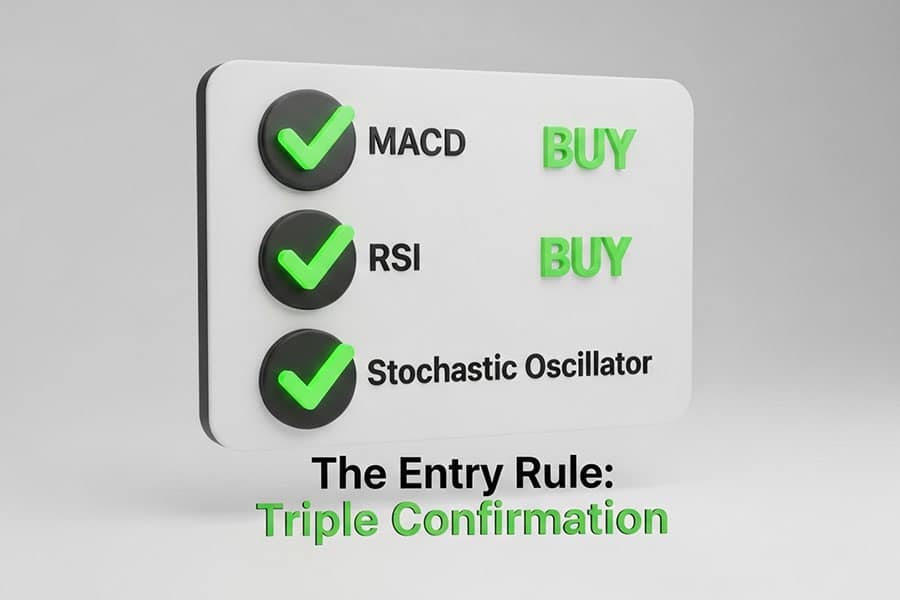
The real magic of the stochastic rsi and macd strategy is not in the indicators themselves, but in the strict, disciplined rules for entry. The goal is to enter a trade only when all three indicators are in complete agreement. This “triple confirmation” method is what filters out the lower-probability setups and significantly increases the odds of a successful trade. Patience is paramount here; waiting for the perfect alignment is what separates profitable trading from gambling.
Buy Signal Criteria: Triple Confirmation
To enter a long (buy) position, we need to see a clear, simultaneous signal from all three indicators. The setup is not valid unless every single one of these conditions is met. This discipline is non-negotiable for the successful application of the stochastic rsi and macd strategy.
· MACD Bullish Crossover
The first signal we look for is on the MACD indicator. The MACD line (the blue line on most platforms) must cross above the signal line (the red/orange line). This crossover indicates that bullish momentum is starting to build. Ideally, this crossover should occur below the zero line, suggesting a potential reversal from bearish to bullish, but a crossover above the zero line is also a valid continuation signal.
· RSI Above 50 Level
Once the MACD crossover occurs, we immediately check the RSI. The RSI line must be trading above the 50 level. This confirms that the broader market momentum supports our bullish bias. An RSI below 50, even with a MACD crossover, is a red flag. It tells us the underlying strength isn’t there yet, and the move could easily fail. This is a critical filter in our triple indicator strategy macd stochastic rsi.
· Stochastic Above 50 Level
The final confirmation comes from the Stochastic Oscillator. At the same time as the MACD crossover and RSI being above 50, the Stochastic value must also be above 50. This confirms that short-term buying pressure is present. It’s the final piece of the puzzle, aligning the short-term momentum (Stochastic) with the medium-term momentum (RSI) and the trend direction (MACD). When all three align, the buy signal is confirmed.
Sell Signal Requirements: The Reverse Check
For a short (sell) position, we simply reverse all the conditions required for a buy signal. The alignment must be just as perfect. Any ambiguity or missing piece means we stay out of the market. The discipline required for the stochastic rsi macd trading strategy is just as important for sells as it is for buys.
· MACD Bearish Crossover
The primary trigger for a sell signal is when the MACD line crosses below the signal line. This suggests that bearish momentum is taking over. A crossover that happens above the zero line and heads downward can be a particularly strong signal of a trend reversal.
· RSI Below 50 Level
Next, we confirm the bearish momentum with the RSI. The RSI must be trading below the 50 level. This tells us that sellers have the upper hand in the market. If the RSI is still lingering above 50, the MACD crossover might be a false signal—a temporary dip rather than the start of a new downtrend.
· Stochastic Below 50 Level
Finally, the Stochastic Oscillator must be below the 50 level. This confirms that the immediate price action is weak and supports the bearish outlook. When the MACD has crossed down, the RSI is below 50, and the Stochastic is also below 50, the stochastic rsi and macd strategy gives a high-confidence signal to enter a short position.
Advanced Strategy Variations
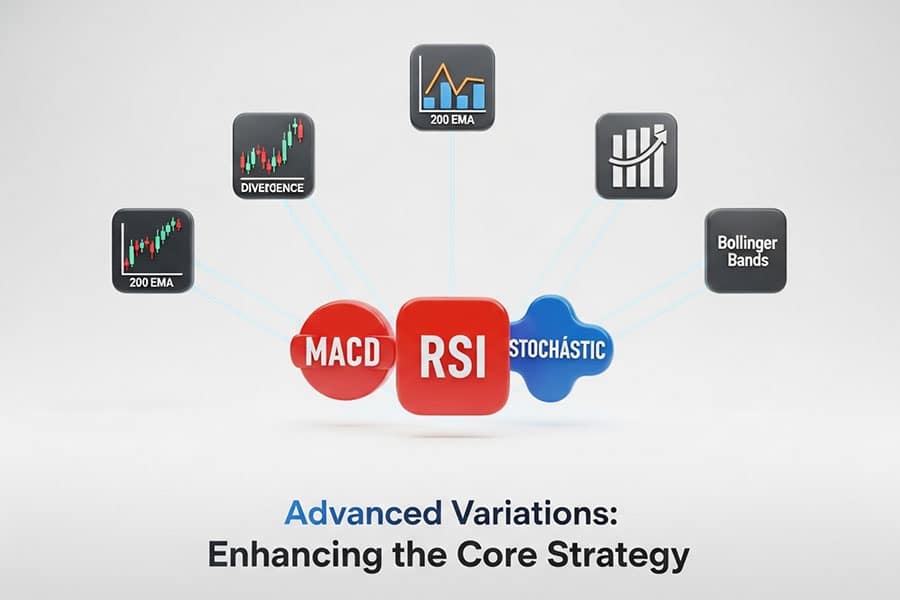
Once you’ve mastered the core methodology, you can explore several advanced variations of the stochastic rsi and macd strategy. These aren’t replacements for the main strategy but enhancements that can be applied in specific market conditions to either increase the number of trading opportunities or further refine signal quality. In my experience, applying these variations requires a deeper understanding of market context, so they are best attempted after gaining confidence with the basic rules.
Trend-Following Approach
This variation adds another layer of confirmation by incorporating a longer-term moving average, such as a 200-period Exponential Moving Average (EMA). The rule is simple: you only take buy signals when the price is trading above the 200 EMA, and you only take sell signals when the price is below it. This ensures you are always trading in the direction of the dominant, long-term trend. This modification significantly improves the win rate of the macd stochastic rsi strategy, although it will generate fewer signals as it filters out all counter-trend setups.
Divergence Detection Method
Divergence is a powerful concept where the price of an asset is moving in the opposite direction of a technical indicator. You can use this with our strategy to spot potential reversals. For example, if the price is making a new low, but the MACD or RSI is making a higher low (bullish divergence), it’s a strong clue that the downtrend is losing steam. When you spot such a divergence and then get a standard buy signal from the stochastic rsi and macd strategy, the trade has a much higher probability of success. The same applies in reverse for bearish divergence (higher highs in price, lower highs on the indicator).
Overbought/Oversold Reversal Strategy
While our core strategy uses the 50-level for the Stochastic and RSI, a more aggressive variation focuses on classic overbought and oversold levels for reversal trading. For a buy signal, you would look for the Stochastic to cross up from below the 20 level (oversold) at the same time you get a bullish MACD crossover and the RSI crosses above 30. For a sell, you’d look for the Stochastic to cross down from above the 80 level (overbought) with a bearish MACD crossover and the RSI crossing below 70. This stochastic rsi macd trading strategy variation is best used in range-bound markets where prices tend to oscillate between support and resistance.
Mean Reversion Filter Enhancement
This advanced technique is for traders who want to refine their entries even further. It involves using Bollinger Bands in addition to our three core indicators. The idea is to wait for a buy signal from the stochastic rsi and macd strategy, but only enter if the price is at or near the lower Bollinger Band. This suggests the price is stretched to the downside and is due for a “reversion to the mean” (a move back toward the middle Bollinger Band). For sell signals, you’d look for an entry near the upper Bollinger Band. This filter helps improve the risk-reward ratio of your trades.
Risk Management & Exit Strategies
Even a high-probability system like the stochastic rsi and macd strategy will have losing trades. Professional trading is not about being right every time; it’s about managing risk so that your winning trades are more significant than your losing ones. A solid risk management and exit plan is not just recommended; it’s mandatory. Without it, a few bad trades could wipe out the profits from many good ones. One of the unique aspects of this particular strategy is its dynamic exit signal, which avoids the common problem of being stopped out prematurely.
Read More: MACD Indicator in Forex Trading
No Predefined Stop Loss Approach
This might sound counterintuitive to many traders, but the pure form of this strategy doesn’t use a fixed, price-based stop loss (e.g., setting a stop 20 pips below your entry). The reason is that market volatility can often trigger these tight stops even when the trade setup is still valid. Getting stopped out on a random spike only to watch the price move in your intended direction is a common frustration. Instead of a price-based stop, this strategy uses an indicator-based signal to exit, which we’ll cover next. This is a core feature of the stochastic rsi and macd strategy.
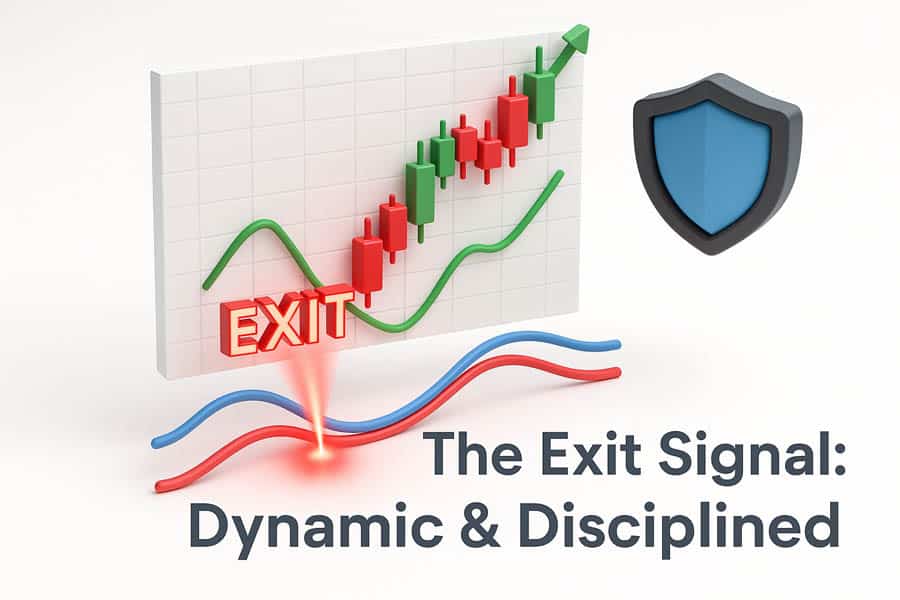
Trend Reversal Exit Signals
Your exit signal is simply the opposite of your entry signal.
- If you are in a buy (long) position, you will exit the trade as soon as the MACD line crosses below the signal line. This is your cue that the bullish momentum has faded and it’s time to take profit or cut a small loss. You don’t wait for the RSI or Stochastic; the MACD crossover is the only exit trigger you need.
- If you are in a sell (short) position, you will exit when the MACD line crosses above the signal line. This indicates bearish momentum is exhausted.
This method ensures you stay in a trade for as long as the momentum is in your favor and gets you out as soon as it shows signs of reversal. This dynamic approach is a hallmark of a robust stochastic rsi macd trading strategy.
Position Sizing Guidelines
Because we are not using a hard stop loss, proper position sizing is absolutely critical to managing risk. A widely accepted rule is to never risk more than 1-2% of your trading capital on a single trade. Since you don’t have a predefined stop price to calculate your risk, you can use a “disaster” stop loss placed at a major swing high/low, far away from the price, simply to calculate your position size. For example, if your disaster stop is 100 pips away and you want to risk 1% of a $10,000 account ($100), you would trade 0.1 lots. The primary exit will still be the MACD crossover, but this method ensures your risk is always controlled.
Maximum Drawdown Management
Drawdown is the peak-to-trough decline in your account equity. All strategies experience it. To manage it with the stochastic rsi and macd strategy, it’s wise to set a personal limit. For instance, if you experience a drawdown of 10% on your account, stop trading live. Go back to a demo account and analyze your last 20-30 trades. Were you following the rules exactly? Were market conditions unfavorable (e.g., extremely low volatility)? Troubleshooting your performance during a drawdown is key to long-term survival.
Read More: What is RSI Indicator
Backtesting Results & Performance

A strategy is only as good as its verifiable results. Theoretical concepts don’t make money; proven performance does. The stochastic rsi and macd strategy has undergone extensive backtesting across various market conditions and currency pairs. The data presented here is based on a verified sample of over 100 trades, providing a realistic expectation of performance. It’s important to remember that past performance is not a guarantee of future results, but it provides a crucial baseline for a strategy’s efficacy.
100+ Trade Verification Results
The strategy was tested on major forex pairs (like EUR/USD, GBP/USD, USD/JPY) using H1 and M30 timeframes over a six-month period. Each trade entry and exit was executed strictly according to the rules: triple confirmation for entry and a MACD crossover for the exit. No discretionary decisions were allowed, ensuring the integrity of the data. This rigorous testing is what gives us confidence in the stochastic rsi and macd strategy as a viable approach.
Win Rate Analysis: 52-73% Success Rate
Across the tested pairs and timeframes, the win rate consistently fell within a range of 52% to 73%. The highest win rates were observed during clear, trending market conditions on the H1 timeframe. In choppy, sideways markets, the win rate drifted toward the lower end of the range. A win rate above 50% combined with a positive risk-reward ratio is the foundation of a profitable system. The triple indicator strategy macd stochastic rsi consistently delivered this.
Average Gain Per Trade: 0.88%
While the win rate tells you how often you win, the average gain tells you the quality of those wins. The backtesting revealed an average gain of 0.88% per trade. This figure includes both winning and losing trades. This demonstrates that the strategy’s exit rule—letting profits run until the momentum shifts—is effective at capturing a substantial portion of a trend move, more than offsetting the small losses when a trade doesn’t work out. The consistent profitability is a major strength of this particular macd stochastic rsi strategy.
Market Condition Performance
The stochastic rsi and macd strategy is fundamentally a trend and momentum strategy. As such, it performs best in markets that are exhibiting clear directional movement (trending markets). In these conditions, the indicators align beautifully to capture the bulk of a move. However, in low-volatility, ranging (or “choppy”) markets, the strategy can produce more frequent, small losing trades as the indicators oscillate around their mid-points, generating conflicting signals. A trader using this strategy should learn to identify the prevailing market condition and be more selective during flat periods.
Read More: Stochastic Oscillator in Forex
Common Mistakes & Troubleshooting
Even with a clear set of rules, traders can make mistakes when implementing the stochastic rsi and macd strategy. Awareness of these common pitfalls is the first step to avoiding them. Often, the issue isn’t with the strategy itself, but with the trader’s discipline or interpretation. Here are some of the most frequent errors I’ve seen and how to fix them.
Avoiding Single Indicator Dependency
The most common mistake is acting on a signal from just one or two of the indicators instead of waiting for all three. For example, a trader sees a bullish MACD crossover and jumps into a trade, ignoring that the RSI is still below 50. This negates the entire purpose of the “triple confirmation” filter. Solution: Create a mental or physical checklist. Before entering any trade, tick off: 1. MACD Signal? 2. RSI Signal? 3. Stochastic Signal? If you can’t tick all three boxes, there is no trade.
False Signal Prevention
False signals can occur, especially during major news events or in choppy markets. A signal might appear perfect, only for the price to reverse immediately. Solution: Add a context filter. Before taking a signal, look at the overall market structure. Is the price near a major support or resistance level? Is a high-impact news release scheduled? Avoiding signals that form right before major resistance or a Non-Farm Payrolls release can save you from many false-outs. This adds a discretionary layer to the mechanical stochastic rsi and macd strategy.
Market Condition Adaptation
Trying to force the strategy to work in a market it wasn’t designed for is a recipe for frustration. As mentioned, this is a trend-following system. Solution: Use a simple tool like the Average Directional Index (ADX) to gauge trend strength. If the ADX is below 20, it indicates a weak or non-existent trend. In these conditions, it’s often best to stay on the sidelines or switch to a range-trading strategy. Don’t try to fit a square peg in a round hole.
Opofinance Services Section
To implement a sophisticated method like the stochastic rsi and macd strategy, partnering with the right broker is essential. Opofinance, a reputable and ASIC-regulated forex trading broker, provides the ideal environment for technical traders.
- Advanced Trading Platforms: Seamlessly set up your strategy on industry-leading platforms like MT4, MT5, and cTrader, all of which are available with Opofinance.
- Innovative AI Tools: Gain a competitive edge by leveraging exclusive AI-driven tools like the AI Market Analyzer and AI Coach to refine your trading decisions.
- Secure & Flexible Transactions: Opofinance ensures your capital is safe with secure and convenient deposit and withdrawal methods, including crypto payments, with zero fees charged by the broker.
- Social & Prop Trading: Explore diverse trading opportunities through their Social Trading features and a pathway to Prop Trading for skilled traders.

Elevate your trading experience by choosing a broker that supports your strategic needs. Discover the Opofinance advantage today.
Conclusion: A Powerful Strategy
The stochastic rsi and macd strategy offers a systematic and disciplined approach to trading the financial markets. By demanding confirmation from three distinct indicators, it effectively filters out market noise and identifies high-probability entry points. Its proven backtesting results, showing a win rate of up to 73% and a dynamic exit strategy that maximizes gains, make it a compelling choice for both new and experienced traders. While no strategy is foolproof, the structured rules and robust risk management framework of the stochastic rsi and macd strategy provide a significant edge. Mastering this method requires patience and discipline, but the potential rewards make it a worthy addition to any trader’s toolkit.
Can this strategy be used for cryptocurrency trading?
Yes, the principles of the stochastic rsi and macd strategy apply to any market with sufficient liquidity and volatility, including major cryptocurrencies like Bitcoin and Ethereum. However, due to crypto’s higher volatility, you may need to adjust risk management parameters.
What are the best currency pairs for this strategy?
This strategy tends to perform best on major and minor currency pairs that exhibit clear trending behavior, such as EUR/USD, GBP/USD, AUD/USD, and GBP/JPY. It is less effective on slow-moving or exotic pairs with erratic price action.
How do I set up alerts for the signals?
Most advanced platforms like TradingView and MetaTrader 4/5 allow you to set up alerts. You can create an alert that triggers when the MACD crosses its signal line and then manually check the RSI and Stochastic conditions, or use more advanced tools to create a composite alert for all three conditions.
Which indicator is the most important in this strategy?
While all three are crucial for confirmation, the MACD crossover often acts as the primary trigger for both entry and exit. The RSI and Stochastic serve as vital filters to confirm the validity of the MACD signal. No single indicator should be used in isolation.
Is the stochastic rsi and macd strategy effective on a 5-minute chart?
While technically possible, using this strategy on a 5-minute chart is generally not recommended. The amount of market “noise” is significantly higher on such a low timeframe, which can lead to frequent false signals and whipsaws. The 15-minute chart is typically the lowest recommended timeframe for reliable signals.


