

Are you looking to enhance your forex trading precision, particularly on the 4-hour chart? Are you seeking a method to refine your trade entries and exits, moving away from impulsive decisions toward a more strategic approach? Optimizing your Stochastic Settings for 4 Hour Chart could be the key. This robust momentum indicator, when expertly configured, can become a powerful asset, highlighting potential market turning points and providing valuable insights into market momentum. While default settings offer a starting point, they often don’t fully exploit the indicator’s potential for specific timeframes.
This article serves as your comprehensive guide to understanding and implementing effective Stochastic Indicator Settings for 4 Hour Chart trading. We will uncover the Best Stochastic Settings for 4 Hour Chart utilized by seasoned traders and guide you in tailoring them to achieve Optimal Stochastic Settings for 4 Hour Chart. Arm yourself with actionable strategies to confidently apply this knowledge and potentially improve your trading outcomes. Whether you’re an experienced trader or just beginning with a reputable online forex broker, mastering the Stochastic Oscillator on the 4-hour chart is an invaluable skill. Prepare to transform your trading and discover potentially more profitable opportunities as we explore the Stochastic and conquer the 4-hour chart.
Decoding the Stochastic Oscillator: Your Momentum Compass
Before exploring the specifics of Stochastic Settings for 4 Hour Chart, it’s essential to build a strong foundation by understanding the Stochastic Oscillator itself. Developed by George Lane in the 1950s, this indicator is based on a simple yet effective principle: during uptrends, prices tend to close near the highs of their recent range, and during downtrends, prices often close near the lows.
What is the Stochastic Oscillator?
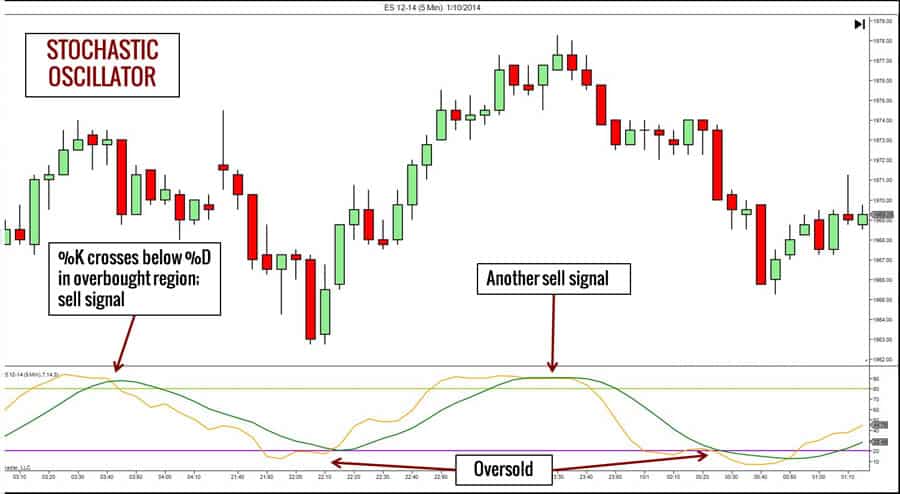
The Stochastic Oscillator is fundamentally a momentum indicator. It compares a security’s closing price to its price range over a set period. It is displayed as two lines oscillating between 0 and 100, visually representing the current price’s position within its recent high-low range. Think of it as a momentum gauge, showing the speed and direction of price movement within its recent trading boundaries.
Importance of Stochastic Settings in Trading
The adaptability of the Stochastic Oscillator is one of its key strengths. Your chosen settings directly impact the indicator’s sensitivity and the signals it produces. Default settings are merely a starting point and are often not optimized for specific timeframes or market conditions. Just as a tailored suit fits better than off-the-rack clothing, optimal stochastic settings are crucial for maximizing the indicator’s effectiveness and generating more accurate trading signals. The right settings can be the deciding factor between capitalizing on profitable moves and being misled by false signals.
Why Use Stochastic on a 4-Hour Chart?
Why the focus on the 4-hour chart when discussing Stochastic Settings for 4 Hour Chart? The 4-hour timeframe offers a compelling compromise for many traders. It reduces the noise and volatility common in shorter timeframes like 1-minute or 5-minute charts, while still providing timely signals for intraday and swing trading. The 4-hour chart offers a broader view of market trends, making it ideal for identifying key support and resistance levels and spotting trend reversals with greater reliability. For traders seeking a balance of precision and manageable trading frequency, the 4-hour chart, combined with well-tuned Stochastic settings, can be a powerful asset.
Read More: 4 hour forex trading strategy
Understanding Stochastic Settings: %K, %D, and Smoothing
To truly master Stochastic Indicator Settings for 4 Hour Chart, we need to understand the components of these settings. Understanding the %K line, the %D line, and the smoothing period is vital for making informed customization and optimization decisions.
Explanation of %K and %D Lines
The Stochastic Oscillator consists of two main lines: %K and %D.
%K (Fast Stochastic Line): This is the more reactive line, calculated with this formula:
%K = (Current Close – Lowest Low over ‘K’ periods) / (Highest High over ‘K’ periods – Lowest Low over ‘K’ periods) * 100.
The %K line measures the current closing price’s position within the recent high-low range defined by the ‘K’ period. A higher %K value indicates the price is closing closer to the range high, suggesting bullish momentum, while a lower value suggests bearish momentum.
%D (Slow Stochastic Line): This line is a smoothed version of the %K line, typically a 3-period Simple Moving Average (SMA) of %K. %D = 3-period SMA of %K. The %D line acts as a signal line, smoothing the %K line’s fluctuations and providing a clearer view of overall momentum direction. Crossovers between %K and %D are often used as trading signals.
Default Stochastic Settings (14, 3, 3)
The most common default settings for the Stochastic Oscillator are (14, 3, 3). Let’s break down each number:
14 (%K Period): This is the number of periods used to calculate the %K line. On a 4-hour chart, it represents 14 four-hour bars, defining the lookback period for calculating the recent high-low range.
3 (%D Smoothing Period): This is the period for the Simple Moving Average used to smooth the %K line and create the %D line. A 3-period SMA is relatively short, keeping the %D line responsive to price changes.
3 (Slowing Period): This is an additional smoothing factor applied to the %K calculation in some Stochastic Oscillator versions (Full Stochastic). In the Fast Stochastic version, this is often omitted or set to 1, meaning no additional slowing. When used, it averages %K values over this period before calculating %D.
While default (14, 3, 3) settings are a reasonable starting point, especially for beginners, they aren’t necessarily the best stochastic settings for 4 hour chart trading. Different market conditions and trading styles may benefit from custom settings.
How Settings Affect Signal Accuracy
Your Stochastic Oscillator settings directly influence its sensitivity and signal accuracy. It’s a balance between capturing timely signals and avoiding false alarms.
Shorter %K Period (e.g., 5, 9): A shorter %K period increases the Stochastic Oscillator’s sensitivity to recent price changes. It reacts faster and generates more signals, including overbought/oversold conditions and %K/%D crossovers. However, higher sensitivity also increases the risk of false signals, especially in choppy or volatile markets.
Longer %K Period (e.g., 20, 30): A longer %K period makes the Stochastic Oscillator less sensitive and smoother. It reacts slower and generates fewer signals. While you might miss some early signals, the signals are generally more reliable and less prone to whipsaws.
Smoothing Period (%D Period): Increasing the %D smoothing period (e.g., from 3 to 5 or 7) further smooths the %D line, making crossovers less frequent and potentially more significant. It can filter noise and provide more robust signals but introduces a slight lag.
Choosing the optimal stochastic settings for 4 hour chart means finding the right balance between sensitivity and reliability for your trading style and market conditions.
Best Stochastic Settings for 4-Hour Chart: Finding the Sweet Spot
Let’s now focus on the key question: identifying the best stochastic settings for 4 hour chart trading. While no single setting works perfectly in every situation, some settings tend to perform consistently well on this timeframe.
Recommended Settings for 4-Hour Timeframe
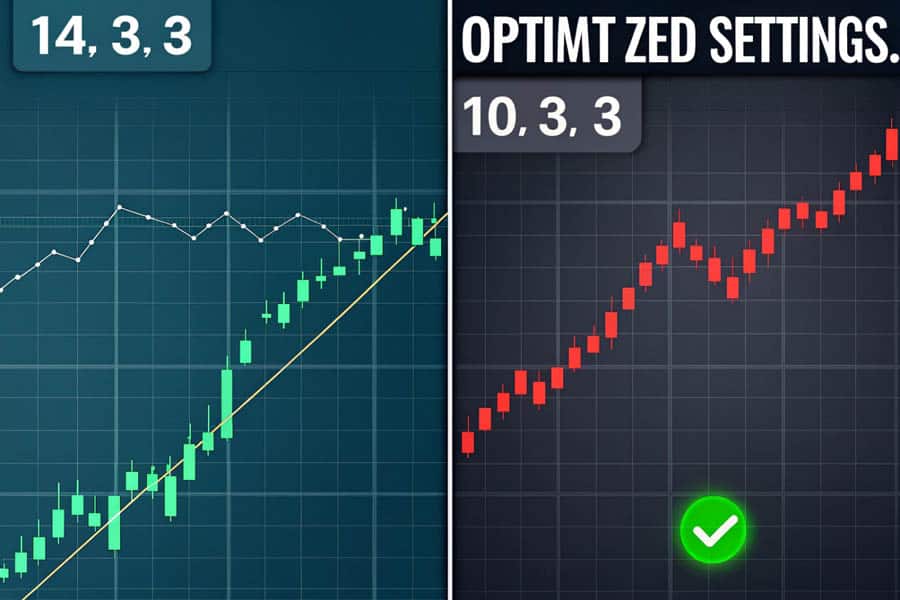
Based on backtesting and trader experience, a popular and often recommended setting for the 4-hour chart is (10, 3, 3). These settings are effective because a %K Period of 10 balances sensitivity and smoothness on the 4-hour chart. It’s responsive enough to capture turning points yet not overly sensitive to short-term noise, reducing false signals compared to shorter periods like 5 or 7. A %D Smoothing of 3 maintains a reasonably responsive signal line that effectively smooths %K fluctuations. A Slowing Period of 3 (or 1 for Fast Stochastic) keeps the indicator agile and avoids excessive lag.
Why 10, 3, 3 often outperforms 14, 3, 3 on the 4-Hour Chart: Default (14, 3, 3) settings can be slow to react on the 4-hour chart, especially in faster markets. Reducing the %K period to 10 makes the Stochastic more responsive, potentially allowing earlier identification of entry and exit points without significantly increasing false signals.
Comparison of Different Settings
While (10, 3, 3) is a strong choice for the best stochastic settings for 4 hour chart, consider these alternatives: (9, 3, 3) is slightly more sensitive than (10, 3, 3), useful in trending markets for quickly capturing momentum shifts, but may produce more false signals in choppy conditions. (12, 3, 3) is smoother than (10, 3, 3), useful in volatile markets or when preferring fewer, more reliable signals, though it may react slower to immediate price changes.
Pros and Cons of Custom Settings
Ultimately, the optimal stochastic settings for 4 hour chart are subjective, depending on your trading style, risk tolerance, and traded assets. Custom settings offer enhanced signal accuracy, personalized trading style, and adaptability to market changes. However, they also carry risks of over-optimization, analysis paralysis, and increased complexity. Finding the best settings involves experimentation, thorough backtesting, and balancing sensitivity and reliability to suit your trading approach. Consistency and disciplined application are more important than finding “perfect” settings.
Read More: Best ema settings for 4 hour chart
How to Apply Stochastic Settings on a 4-Hour Chart: A Practical Guide
Now that we’ve explored the best stochastic settings for 4 hour chart, let’s go through a step-by-step guide to applying these settings on your trading platform and interpreting signals.
Step-by-Step Guide to Setting Up Stochastic Indicator
Setting up the Stochastic Oscillator is generally straightforward on most trading platforms, including those offered by reputable forex trading brokers. The steps are generally as follows: open your trading platform, select a 4-hour chart for your chosen currency pair or asset, insert the Stochastic Oscillator from the indicators section, access the indicator settings, customize the settings by entering your desired %K Period, %D Period (Smoothing), Slowing Period, Overbought Level, and Oversold Level, and finally apply the settings. The Stochastic Oscillator with your customized settings will then appear below your 4-hour chart.
Chart Examples with Different Settings
To illustrate the impact of different settings, consider these examples on a 4-hour EUR/USD chart. With (14, 3, 3) settings, the Stochastic might generate fewer, less frequent signals, and overbought/oversold conditions may be identified less often. Using (10, 3, 3) settings, you might see more frequent crossovers and potentially earlier signals of overbought/oversold conditions compared to default settings. With highly sensitive (5, 3, 3) settings, the Stochastic will likely generate numerous signals, including many false ones, especially in choppy price action, with erratic %K and %D lines. Visually comparing these examples on a chart helps understand how different stochastic indicator settings for 4 hour chart affect indicator behavior and signal generation.
Tips for Avoiding False Signals
While optimized settings reduce false signals, no indicator is perfect. To minimize false signals using the Stochastic Oscillator on the 4-hour chart, consider these tips: confirm signals with price action, ensuring bearish patterns or support breaks for overbought signals and bullish patterns or resistance breaks for oversold signals; consider trend context, focusing on oversold signals in uptrends and overbought signals in downtrends; remember divergence is powerful but needs confirmation from price action; and combine Stochastic with other indicators like Moving Averages, RSI, or MACD to filter false signals and increase trading decision reliability. Applying these tips and trading with discipline can significantly improve your Stochastic Settings for 4 Hour Chart trading effectiveness and reduce false signal impact.
Trading Strategies Using Stochastic on 4-Hour Charts: Actionable Insights
Now that you know how to set up and interpret the Stochastic Oscillator, let’s explore practical trading strategies using Stochastic Settings for 4 Hour Chart.
Overbought and Oversold Levels: Classic Entry and Exit Points
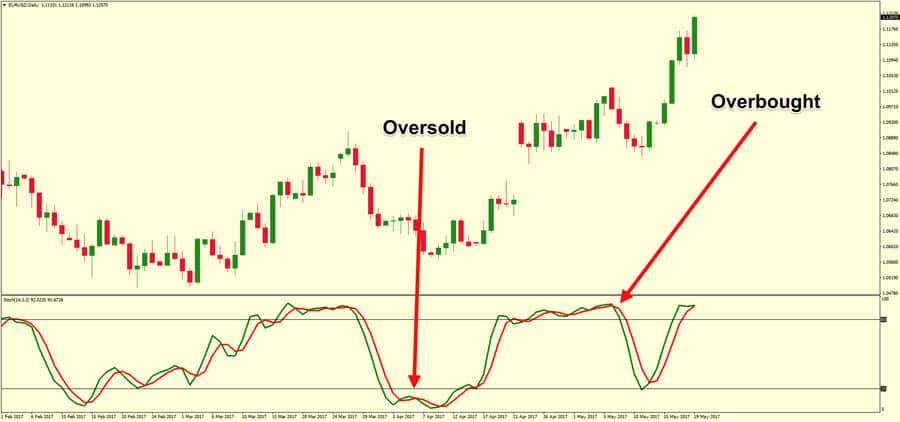
The most basic use of the Stochastic Oscillator is identifying overbought and oversold conditions. Overbought conditions occur when the Stochastic rises above 80, suggesting the price may be overextended and due for a pullback or reversal, signaling potential profit-taking on longs or short entry opportunities. Oversold conditions occur when the Stochastic falls below 20, suggesting the price may be overextended downward and due for a bounce or reversal, signaling potential profit-taking on shorts or long entry opportunities.
Divergence Trading Strategy: Spotting Potential Trend Reversals
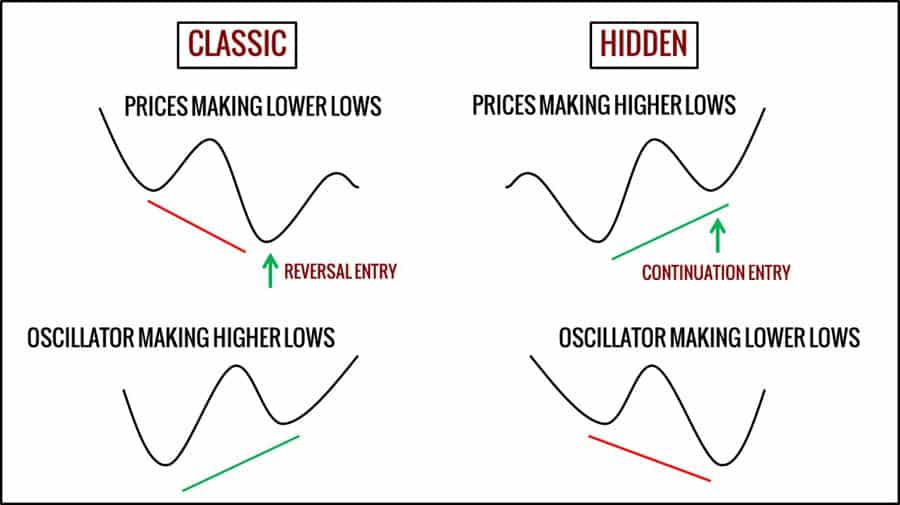
Stochastic divergence is a powerful technique for early identification of potential trend reversals. It happens when price action and the Stochastic Oscillator move in opposite directions, indicating weakening momentum. Bullish Divergence occurs when price makes lower lows, but the Stochastic makes higher lows, suggesting waning selling momentum and a potential uptrend reversal. Bearish Divergence occurs when price makes higher highs, but the Stochastic makes lower highs, suggesting weakening buying momentum and a potential downtrend reversal.
Combining Stochastic with Other Indicators
To enhance the reliability of your Stochastic Settings for 4 Hour Chart trading, consider combining it with other indicators. For example, use Stochastic and Moving Averages to identify trend direction with Moving Averages (e.g., 20-period EMA, 50-period SMA) and use Stochastic signals within that trend context, focusing on oversold signals for longs in uptrends. Combine Stochastic and RSI for confirmation, looking for confluence between overbought/oversold readings on both, strengthening signals when both indicators align. Use Stochastic and MACD to identify trend direction with MACD and use Stochastic to fine-tune entries and exits within MACD trend signals. Strategic indicator combinations can create a more robust and reliable trading system, potentially improving trading performance.
Read More: Stochastic Oscillator in Forex
Common Mistakes to Avoid: Navigating Stochastic Pitfalls
While Stochastic Settings for 4 Hour Chart are powerful, awareness of common mistakes is crucial to avoid undermining your trading.
Over-Optimizing Stochastic Settings: Curve-Fitting Dangers
Over-optimizing Stochastic settings to perfectly fit historical data, known as curve-fitting, is a major pitfall. Over-optimized settings may appear fantastic in backtests with impressive hypothetical profits, but they are often too specific to past conditions and may fail in live trading as market dynamics shift. They are less robust, less adaptable to changing volatility and price patterns, and more prone to false signals and losing effectiveness over time.
Ignoring Market Context: Trading in a Vacuum
Relying solely on Stochastic signals without considering broader market context is another common mistake. Trend blindness, ignoring overall trend direction, can lead to low-probability trades against the trend. Ignoring news and events can also be detrimental, as major events can override Stochastic signals and lead to unexpected losses.
Sole Reliance on Stochastic: The Indicator Isolation Fallacy
Treating the Stochastic Oscillator as a standalone system and solely relying on its signals leads to inconsistent results. Lack of confirmation, by not seeking validation from other indicators or price action, increases false signal and whipsaw risks. Limited perspective, by only considering momentum and neglecting volume, volatility, and market sentiment, provides an incomplete market picture.
Backtesting Stochastic Settings: Validating Your Strategy
Before using any Stochastic Settings for 4 Hour Chart strategy in live trading, backtesting is essential to validate its potential and understand historical performance.

Importance of Backtesting
Backtesting involves applying your strategy to historical data to simulate performance, providing valuable insights and data-driven confidence before risking real capital. It allows for performance evaluation, assessing profitability, win rate, and drawdown; settings validation, comparing different Stochastic settings; strategy refinement, identifying weaknesses and optimization opportunities; and risk assessment, evaluating potential risks like maximum drawdown.
Tools and Platforms for Backtesting
Several tools streamline backtesting. Trading platform backtesters, built into platforms like MetaTrader 4/5 and TradingView, allow coding or visually building strategies and backtesting on platform data. Dedicated backtesting software, such as Forex Tester, offers advanced features for complex strategies. Spreadsheet software, like Excel or Google Sheets, can be used for manual backtesting of simpler strategies by analyzing charts and recording simulated trades.
How to Analyze Backtesting Results
When analyzing backtesting results, focus on key metrics. Net Profit is the total profit over the backtesting period. Profit Factor is the ratio of gross profit to gross loss, with values over 1 indicating profitability. Win Rate is the percentage of winning trades. Average Win/Loss Ratio is the ratio of average win size to average loss size. Maximum Drawdown is the largest equity curve decline, a crucial risk measure. Sharpe Ratio is a risk-adjusted return metric, with higher values being better. Remember, backtesting results are not future performance guarantees, but they provide valuable insights for informed trading decisions.
Expert Tips for Using Stochastic on 4-Hour Charts: Advanced Strategies
To truly master Stochastic Settings for 4 Hour Chart trading, consider these expert tips from seasoned traders.
Pro Tip for Advanced Traders
Advanced traders can further refine their approach by implementing dynamic Stochastic settings adjustments based on volatility regimes. Utilize ATR (Average True Range) to measure market volatility. In high volatility periods (ATR above a set threshold), increase the %K period for smoother signals. In low volatility periods (ATR below a threshold), decrease the %K period for increased sensitivity. This adaptive method optimizes Stochastic performance across varying market conditions.
Adjusting Settings Based on Market Volatility
Market volatility fluctuates, so adjusting Stochastic settings based on it can improve effectiveness. In higher volatility, consider smoother settings (e.g., %K period of 12 or 14) to reduce noise. In lower volatility, use more sensitive settings (e.g., %K period of 9 or 10) to capture smaller movements. Gauge volatility using indicators like Average True Range (ATR) or Bollinger Bands.
Using Stochastic for Trend Confirmation
The Stochastic Oscillator can confirm trend direction and momentum. In uptrends, look for Stochastic consistently bouncing off oversold zones (above 20) and staying above 50 to confirm bullish momentum. In downtrends, look for Stochastic consistently rejecting overbought zones (below 80) and staying below 50 to confirm bearish momentum. Use Stochastic trend confirmation to filter signals, taking only long positions on oversold signals in uptrends and avoiding shorts on overbought signals.
Long-Term vs. Short-Term Trading Approaches
Your trading timeframe influences optimal stochastic settings for 4 hour chart. For swing trading (medium-term) on the 4-hour chart, (10, 3, 3) or similar settings are generally suitable, balancing sensitivity and reliability for medium-term swings. For day trading (short-term), while less common on the 4-hour chart, slightly more sensitive settings (e.g., (9, 3, 3) or (7, 3, 3)) might capture shorter momentum shifts, but be aware of increased noise. Experiment and backtest to find the best settings for your trading style and timeframe.
Opofinance: Your Partner in Forex Trading Excellence
Are you seeking a reliable and regulated broker for forex to implement your refined Stochastic Settings for 4 Hour Chart strategies? Consider Opofinance, a leading ASIC-regulated broker committed to providing traders with a secure and efficient trading environment.
Why Choose Opofinance as Your Forex Broker?
Choosing Opofinance offers several key advantages. Firstly, it is an ASIC Regulated Broker, providing confidence through regulation by the Australian Securities and Investments Commission, ensuring high operational standards and client protection. Secondly, Opofinance is Officially Featured on MT5 Brokers List, granting access to the powerful MetaTrader 5 platform with advanced charting and technical indicators. Thirdly, their Social Trading Service allows you to connect with and learn from experienced traders, enhancing your trading knowledge. Finally, they offer Safe and Convenient Deposits & Withdrawals, ensuring seamless and secure management of your trading funds.

Elevate your trading journey with a broker that prioritizes your success.
Start Trading with Opofinance Today!
Conclusion: Achieving Mastery with Stochastic Settings
In conclusion, mastering Stochastic Settings for 4 Hour Chart is a continuous process combining theoretical knowledge, practical application, and sound trading principles. While (10, 3, 3) settings are a robust starting point, remember that optimal stochastic settings for 4 hour chart are personalized, reflecting your trading style, risk tolerance, and market dynamics. By understanding %K and %D lines, the impact of settings on sensitivity and reliability, and the importance of market context and confirmation, you can unlock the Stochastic Oscillator’s potential on the 4-hour chart. Backtest strategies, avoid pitfalls like over-optimization and indicator isolation, and adapt your approach based on market feedback. With dedication and practice, you can enhance trading precision and strive for forex trading success.
Key Takeaways
- Stochastic Oscillator Fundamentals: Momentum indicator measuring price position in its recent range.
- Settings Matter: Stochastic Settings for 4 Hour Chart impact signal accuracy and responsiveness.
- Recommended Settings (10, 3, 3): Often the best stochastic settings for 4 hour chart, balancing sensitivity and reliability.
- Effective Trading Strategies: Use overbought/oversold crossovers, divergence, and indicator combinations.
- Avoid Common Mistakes: Steer clear of over-optimization, neglecting market context, and isolated Stochastic use.
- Backtesting is Essential: Validate strategies and settings with historical data.
- Expert Insights: Adapt settings to volatility, use for trend confirmation, and tailor to your timeframe.
Can Stochastic Settings for 4 Hour Chart be used for scalping strategies?
Stochastic Settings for 4 Hour Chart are not ideally suited for scalping strategies, which typically use shorter timeframes like 1-minute or 5-minute charts. The 4-hour chart and its Stochastic settings are designed for swing and medium-term trading, capturing larger price movements over longer durations, contrasting with the fast-paced nature of scalping. For scalping, consider using Stochastic on shorter timeframes with more sensitive settings, but be aware of increased noise and false signals.
How often should I adjust my Stochastic Settings for 4 Hour Chart?
Adjusting Stochastic Settings for 4 Hour Chart should not be frequent. Instead of constant tweaking, adjust settings when significant shifts in volatility or market behavior occur. Monitor market volatility with indicators like ATR and consider adjustments if sustained volatility changes are observed. Regularly review backtesting and live trading performance to assess setting effectiveness. Avoid frequent adjustments based on short-term fluctuations to prevent over-optimization and curve-fitting.
Are Stochastic Settings for 4 Hour Chart effective in all market conditions?
Stochastic Settings for 4 Hour Chart are effective in various market conditions but not universally applicable. As a momentum indicator, Stochastic performs best in trending or ranging markets with discernible price momentum. In choppy or sideways markets, it may generate more false signals. In such conditions, rely more on price action, support/resistance, and indicators less sensitive to momentum. Adapt your approach to market conditions and avoid solely relying on any single indicator in all situations.


2 Responses
Hey There. I found your blog using msn. This is a very well written article.
I will make sure to bookmark it and return to read more of your useful info.
Thanks for the post. I’ll certainly comeback.
If some one desires to be updated with latest technologies after that he must be go to see this site and be up to
date everyday.