

The Supertrend indicator is a powerful tool that helps traders identify the primary direction of a market trend by overlaying clear, color-coded buy and sell signals directly onto a price chart. Created by Olivier Seban, it stands out for its simplicity, providing an unambiguous visual guide for trend-following and risk management. Whether you are a beginner looking for clear entry points or an experienced trader seeking confirmation, understanding this indicator is crucial. This guide covers everything from its core formula and optimal settings to advanced strategies for intraday and swing trading, helping you make more informed decisions with your preferred forex trading broker. We will explore how to read its signals, combine it with other tools, and avoid common pitfalls.
Key Takeaways
- What it is: The Supertrend indicator is a trend-following tool that plots a line on the price chart, changing color and position to signal bullish (green line below price) or bearish (red line above price) trends.
- How it works: It uses the Average True Range (ATR) to measure volatility and a multiplier to define its sensitivity. Its core function is to provide clear, visual entry and exit signals.
- Core Benefit: Its primary advantage is providing straightforward, easy-to-read buy and sell signals, which helps reduce emotional decision-making in trading.
- Best Use Case: The indicator excels in trending markets (uptrends or downtrends) but can produce false signals in sideways or ranging markets.
- Customization is Key: The default settings (10, 3) are a good starting point, but traders should optimize them based on the asset’s volatility, timeframe, and their personal trading style.
- Powerful in Combination: While usable alone, the Supertrend indicator is most effective when combined with other tools like the MACD, RSI, or moving averages to filter out false signals and confirm momentum.
- Risk Management: The indicator’s line serves as a dynamic trailing stop-loss, helping traders protect profits and manage risk effectively as the trend progresses.
What is the Supertrend indicator?
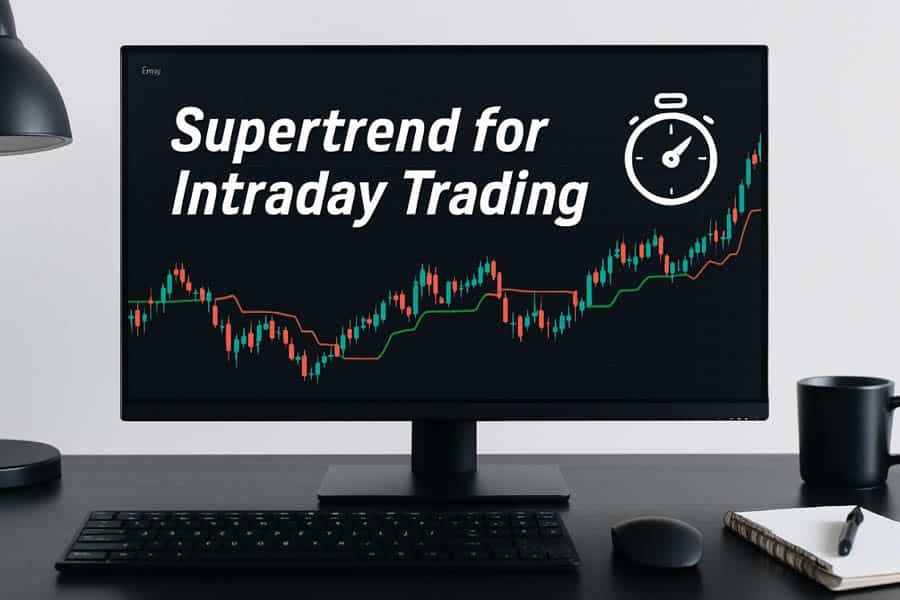
The Supertrend indicator is a technical analysis tool designed to identify the direction of a market trend and provide explicit buy and sell signals. It’s an overlaid indicator, meaning it plots its output directly on top of the price chart, rather than in a separate window below. This visual directness is one of its most celebrated features. At its core, the indicator helps traders answer a fundamental question: is the market currently in an uptrend or a downtrend? It accomplishes this by placing a single, continuous line on the chart that dynamically flips above or below the price action.
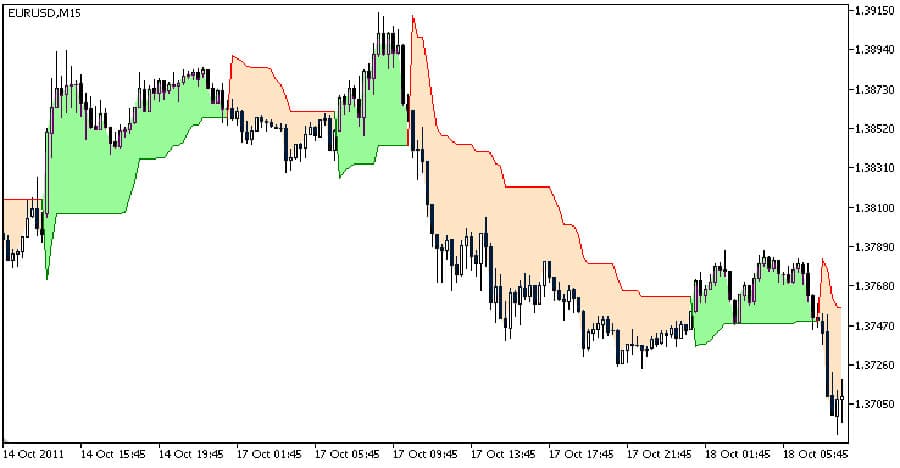
When the line is below the price and colored green, it signals a bullish trend. Conversely, when it moves above the price and turns red, it signals a bearish trend. This mechanism makes it exceptionally popular among traders who favor a clean, uncluttered chart and clear, actionable signals. Unlike lagging indicators such as simple moving averages, which can be slow to react, the Supertrend incorporates volatility through the Average True Range (ATR), allowing it to adapt more quickly to market changes. This unique construction makes it a standout tool for trend identification and effective risk management.
How Does the Supertrend indicator Work?
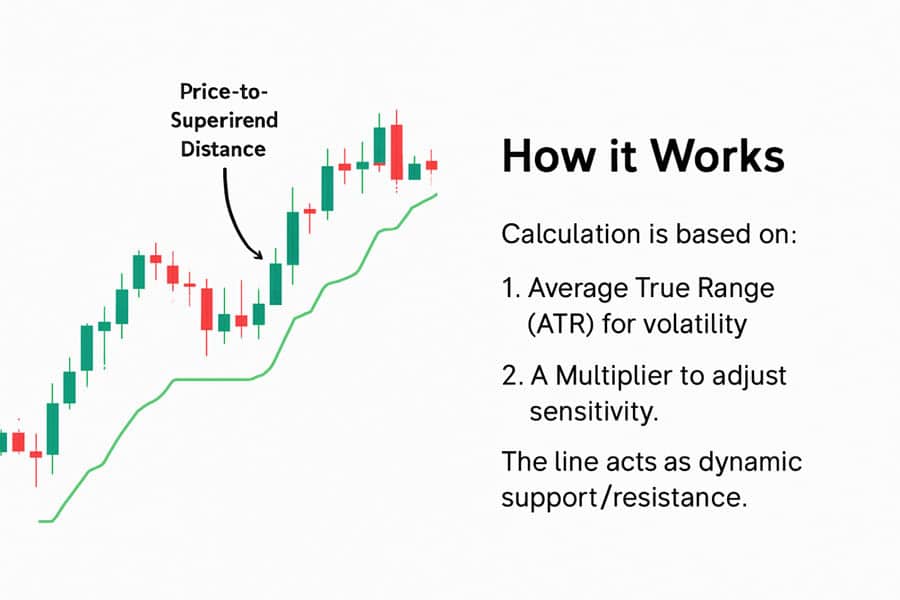
Understanding how the Supertrend indicator functions requires a look at its two key components: the Average True Range (ATR) and the multiplier. The ATR is a measure of market volatility, while the multiplier is a user-defined value that adjusts the indicator’s sensitivity. The synergy between these elements creates the dynamic line that traders follow.
The Formula and Calculation
The calculation behind the Supertrend might seem complex, but its logic is straightforward. It establishes upper and lower bands around the price, and the indicator line flips between them based on the closing price of the asset.
The basic formulas are:
- Upper Band = (High + Low) / 2 + (Multiplier × ATR)
- Lower Band = (High + Low) / 2 – (Multiplier × ATR)
The process begins by calculating the ATR for a specific period (e.g., 10 days). This value represents the average “true range” of price movement. The indicator then uses this ATR value, adjusted by the multiplier, to create the bands. When the closing price moves above the upper band, it signals the start of an uptrend, and the Supertrend line moves below the price, acting as a dynamic support level. If the price closes below the lower band, a downtrend is confirmed, and the line flips above the price, acting as a dynamic resistance. The line will not change direction until the price closes on the opposite side of the indicator line, providing a stable trend signal until a clear reversal occurs.
Pros and Cons of the Supertrend
From my experience, no indicator is perfect, and the Supertrend is no exception. Its strengths are most apparent in certain market conditions, while its weaknesses become clear in others.
Pros:
- Clarity: It provides unambiguous buy and sell signals, removing guesswork and helping traders stick to their plan.
- Trend Identification: It is excellent at catching and riding strong, sustained trends.
- Built-in Risk Management: The indicator line itself can be used as a trailing stop-loss, making risk management intuitive.
- Timeliness: By using the ATR, it often reacts to trend changes faster than traditional moving averages.
Cons:
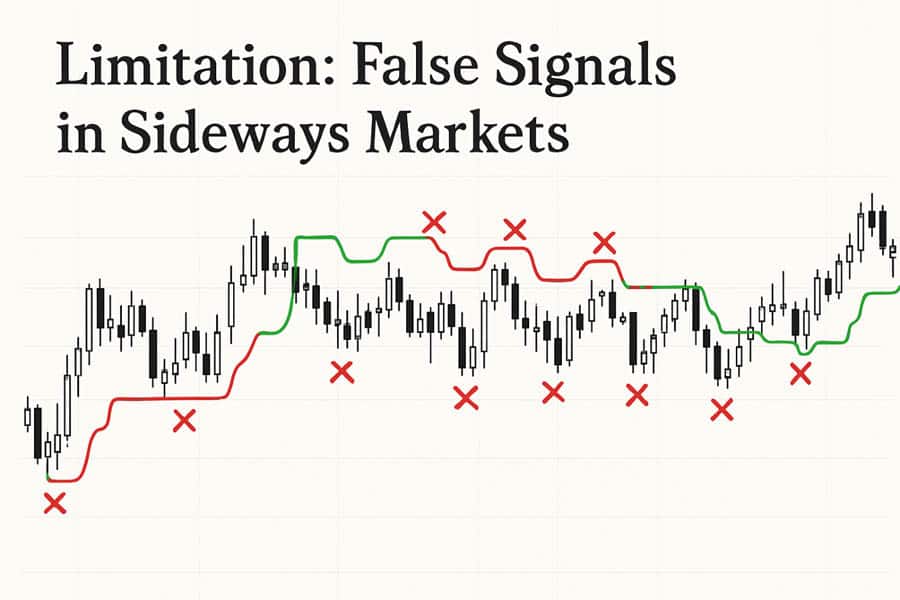
- Whipsaws in Sideways Markets: Its biggest weakness is its performance in ranging or choppy markets. During these periods, it can generate frequent false signals (whipsaws), leading to small, repeated losses.
- Lagging Nature: Although faster than some indicators, it is still a lagging tool. It confirms a trend after it has already begun, meaning traders may miss the earliest part of a move.
- Parameter Sensitivity: Its effectiveness is highly dependent on the chosen settings (ATR period and multiplier). Incorrect settings can lead to either too many false signals or delayed signals.
Read More: Most Accurate Trend Indicators
Best Settings and Optimization
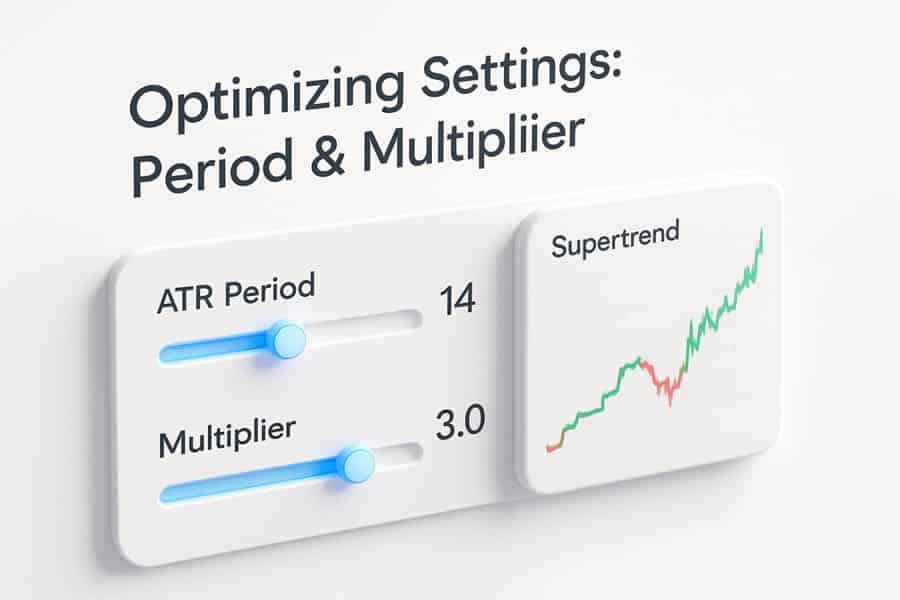
One of the most common questions traders ask is about the “best” settings for the Supertrend indicator. While there’s no single magic formula, understanding how to optimize the settings for different markets and timeframes is a critical skill. The default settings—typically a period of 10 for the ATR and a multiplier of 3—are a popular starting point, but they are not a one-size-fits-all solution.
Understanding Default Settings
The default combination of a 10-period ATR and a 3x multiplier was designed to offer a balance between sensitivity and reliability. The 10-period setting captures about two weeks of volatility on a daily chart, providing a decent snapshot of recent market behavior. The multiplier of 3 creates bands that are wide enough to filter out minor price noise but responsive enough to catch significant trend shifts. For many major stocks and forex pairs on daily charts, these settings work reasonably well for swing trading.
How to Optimize Settings
The key to mastering the Supertrend indicator strategy is knowing when and how to adjust its parameters. The goal is to match the indicator’s responsiveness to the specific characteristics of the asset you are trading.
- Changing the ATR Period: A shorter ATR period (e.g., 5) makes the indicator more sensitive to recent price action, leading to quicker signals. This can be beneficial for short-term intraday trading but may also increase the number of false signals. A longer period (e.g., 20) smooths out the indicator, making it less reactive and better suited for long-term trend following, though signals will be slower.
- Adjusting the Multiplier: The multiplier directly controls the width of the bands. A smaller multiplier (e.g., 2) brings the indicator line closer to the price, resulting in more signals. This is often preferred by scalpers who need to react quickly. A larger multiplier (e.g., 4 or 5) pushes the line further away, requiring a more substantial price move to trigger a signal. This helps avoid whipsaws in volatile markets and is favored by swing traders who want to ride long trends without being shaken out by minor corrections.
My advice is to backtest different settings on historical data for the specific asset and timeframe you plan to trade. For a highly volatile cryptocurrency, you might find that a larger multiplier (like 4) is necessary to avoid noise. For a stable blue-chip stock, a smaller multiplier (like 2.5) might be more effective.
How to Read Buy and Sell Signals
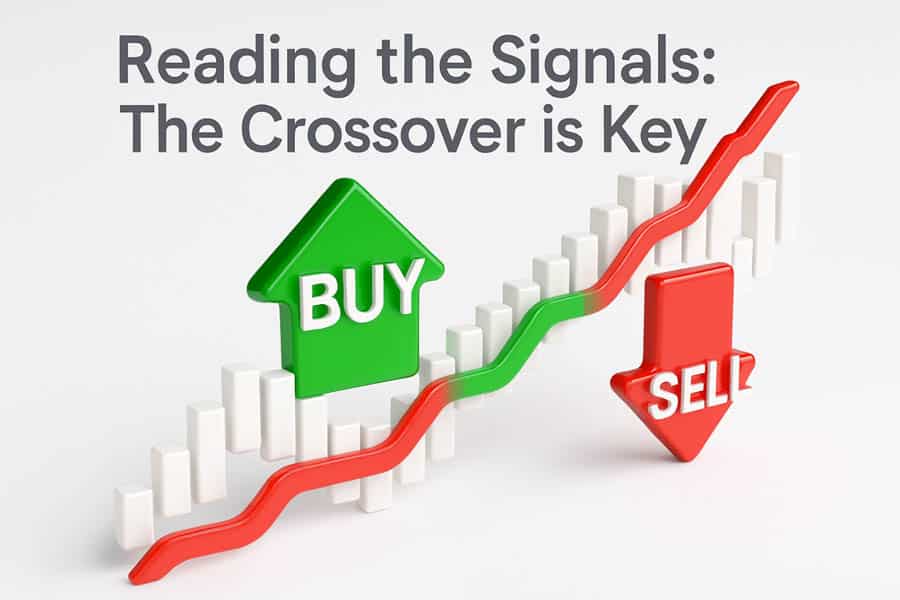
The primary appeal of the Supertrend indicator lies in its simplicity. Reading its signals is intuitive, which is why it’s a favorite among both new and experienced traders. The logic is purely visual and binary: the trend is either up or down, with clear crossover points indicating a potential shift.
Entry and Exit Logic
The rules for generating signals are straightforward and based on the interaction between the price and the indicator line.
- Buy Signal (Entry): A buy signal is generated when the indicator flips from being above the price (red) to below the price (green). This crossover suggests that the bears have lost control and a new uptrend may be starting. Traders often enter a long position on the close of the candle that confirms this flip.
- Sell Signal (Entry): A sell signal occurs when the indicator flips from being below the price (green) to above the price (red). This indicates that the bulls have exhausted their momentum and a downtrend is likely underway. A short position could be initiated on the close of the candle confirming this change.
- Exit Signal: The indicator is also highly effective for exits. If you are in a long position, you could place your stop-loss just below the green Supertrend line. As the price trends upward, the line will also move up, acting as a trailing stop-loss that locks in profits. You would exit the trade if the price closes below the line, causing it to turn red. The same logic applies in reverse for a short position.
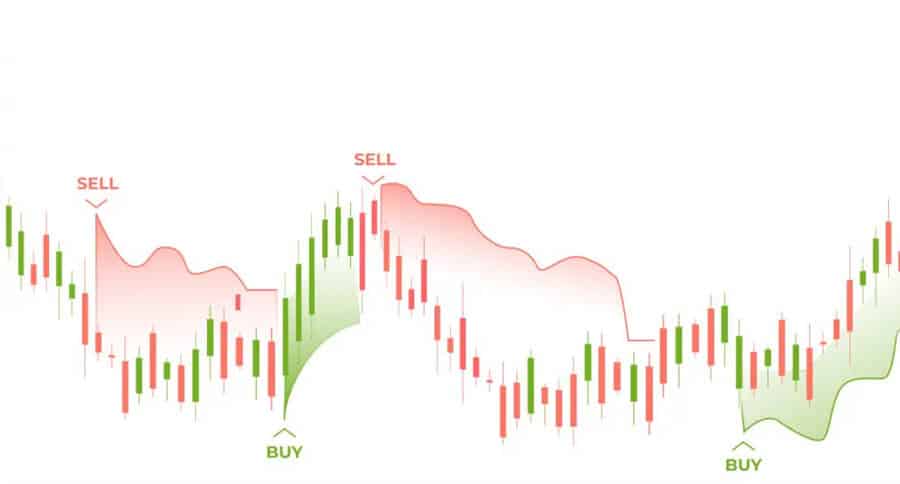
Chart Examples and Common Pitfalls
On a chart, these signals are unmistakable. A long period of green below the price signifies a strong, healthy uptrend—a time to hold long positions. A sustained red line above the price indicates a dominant downtrend. However, beginners often make a few common mistakes. The most significant is acting on every single signal, especially in a non-trending market. When the price is moving sideways, the Supertrend line will flatten and the price will crisscross it frequently, generating a series of losing trades. This is a classic whipsaw. Experienced traders learn to recognize these “choppy” conditions and either stay out of the market or use a secondary indicator, like the ADX (Average Directional Index), to confirm if a genuine trend exists before taking a signal.
Trading with Supertrend indicator: A Step-by-Step Guide
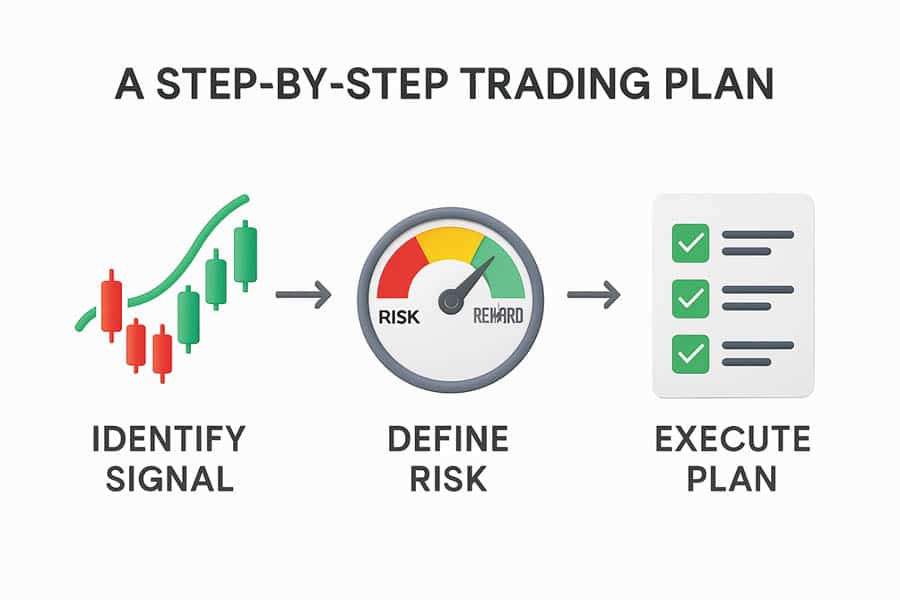
Integrating the Supertrend indicator into a structured trading plan is essential for long-term success. Simply following its signals without a broader strategy is a recipe for inconsistency. A robust plan involves selecting the right markets, setting up your charts correctly, defining clear entry and exit rules, and applying sound risk management.
Suitable Markets for Supertrend
The Supertrend is a versatile tool that can be applied to virtually any market that trends. This includes:
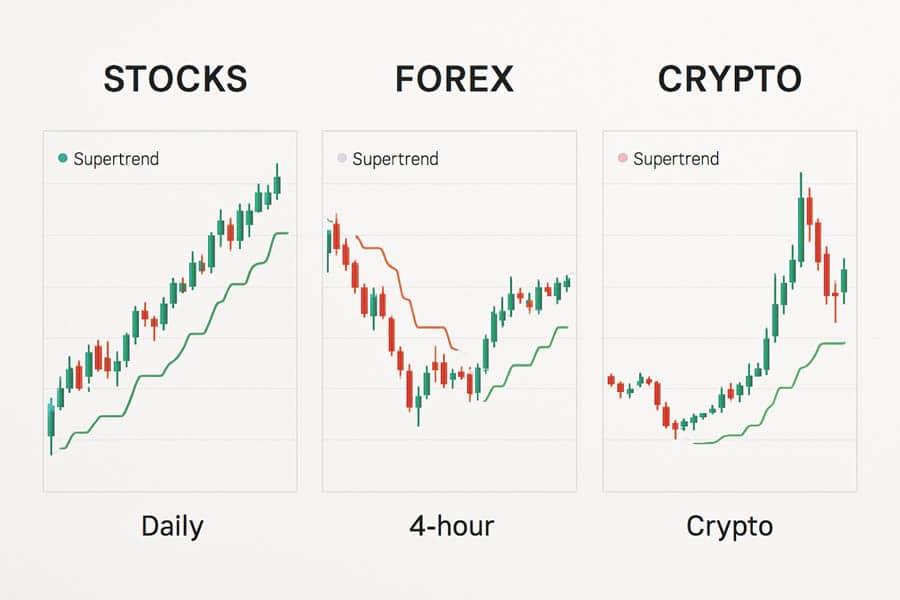
- Stocks: Excellent for identifying trends in individual stocks, especially those known for strong, sustained moves.
- Forex: Highly effective for major and minor currency pairs, which often exhibit clear trending behavior on various timeframes. Using it with a reliable online forex broker is key.
- Cryptocurrencies: Due to their high volatility and tendency for strong trends, cryptocurrencies are well-suited for a Supertrend-based strategy, though higher multipliers are often needed to filter noise.
- Commodities: Gold, oil, and other commodities that experience long-term supply and demand cycles are great candidates for trend-following with this indicator.
Setting Up Your Charts
Adding the Supertrend indicator to your chart is straightforward on most modern trading platforms.
- TradingView: Go to the “Indicators” tab, search for “Supertrend,” and click on it to add it to your chart. You can then click the gear icon next to its name to adjust the ATR and multiplier settings.
- MetaTrader (MT4/MT5): Supertrend is not a default indicator in MetaTrader. You will need to download it as a custom indicator from the MQL5 marketplace or other online sources. Once downloaded, you can add it to your “Indicators” folder and apply it to your chart from the “Custom” indicators list in the Navigator window.
Creating a Comprehensive Trading Plan
A trading plan transforms the indicator from a simple signal generator into a core component of a professional strategy.
- Entry Criteria: Don’t just enter on a Supertrend flip. Add a confirmation factor. For example, your rule could be: “Enter a long position only if the Supertrend indicator turns green AND trading volume is above its 20-period moving average.” This helps ensure there is conviction behind the move.
- Exit and Stop-Loss Strategy: The Supertrend itself provides an excellent exit mechanism. A common rule is: “For a long position, set the initial stop-loss just below the Supertrend line. Trail the stop-loss up manually, keeping it just below the line as it rises. Exit the trade if the price closes below the line.” This dynamic approach protects capital while giving the trend room to breathe.
- Risk Management: Never risk more than a small percentage of your trading capital (e.g., 1-2%) on a single trade. Calculate your position size based on the distance between your entry price and your stop-loss (the Supertrend line). A wider stop requires a smaller position size to maintain the same level of risk.
Read More: Trend-Following StrategyTrend-Following Strategy
Advanced Supertrend indicator Strategies
Once you have mastered the basics, you can explore more sophisticated strategies that enhance the reliability of the Supertrend indicator. These methods are designed to filter out false signals, confirm trend strength, and adapt to different market behaviors like breakouts and pullbacks. Combining multiple indicators or using different settings in tandem can elevate your trading from reactive to proactive.
Combining Supertrend with Other Indicators
This is where many experienced traders find their edge. The Supertrend identifies the trend, while a secondary indicator confirms momentum or identifies overbought/oversold conditions.
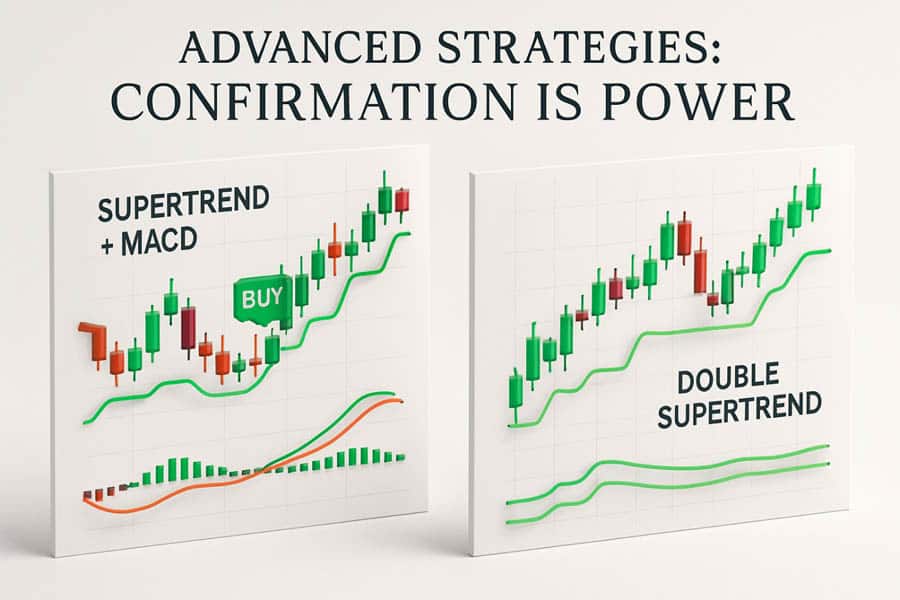
- Supertrend + MACD: The Moving Average Convergence Divergence (MACD) is a momentum indicator. A high-probability buy signal occurs when the Supertrend turns green and the MACD line crosses above its signal line from below, ideally while both are below the zero line. This confirms that momentum is shifting in the direction of the new trend.
- Supertrend + RSI: The Relative Strength Index (RSI) measures the speed and change of price movements. For a long trade, you could wait for the Supertrend to turn green and then look for the RSI to rise from oversold territory (below 30). For a pullback strategy, you’d look for the RSI to dip near 50 (in an uptrend) and then turn back up, signaling a continuation.
- Supertrend + EMA Crossover: A classic combination. Use a faster EMA (e.g., 20-period) and a slower EMA (e.g., 50-period). A strong buy signal could be defined as: Supertrend is green, the 20 EMA has crossed above the 50 EMA, and the price is trading above both EMAs. This triple confirmation provides a very robust signal.
The Double Supertrend Strategy
This powerful Supertrend indicator strategy involves using two Supertrend indicators on the same chart with different settings. This helps to confirm entries and ride trends for longer.
- Setup: Apply a fast Supertrend (e.g., settings 10, 2) and a slow Supertrend (e.g., settings 20, 4).
- Entry Rule: Enter a long position only when BOTH Supertrend indicators are green. Enter a short position only when BOTH are red. This ensures you are only trading in the direction of the confirmed, dominant trend.
- Exit Rule: For a more aggressive exit, close the position when the fast Supertrend flips direction. For a more conservative approach that aims to capture bigger moves, exit only when the slow Supertrend flips.
Breakout and Pullback Tactics
The Supertrend is not just for trend entries; it’s also excellent for timing breakouts and pullbacks.
- Breakout Trading: In a ranging market, the Supertrend line will flatten out, forming a resistance (if red) or support (if green) level. A breakout entry can be taken when the price decisively closes above a flat red Supertrend line, causing it to flip green. This often signals the start of a new uptrend.
- Pullback Trading: This is a more advanced technique. In an established uptrend (Supertrend is green and rising), wait for the price to pull back and touch or come close to the green Supertrend line. As long as the line holds as support and doesn’t flip, this is a high-probability area to add to an existing long position or initiate a new one, often at a better price.
Supertrend indicator for Intraday Trading
One of the most popular applications of this tool is in intraday trading. Day traders and scalpers value the Supertrend indicator for its clear, real-time signals. However, using it on lower timeframes requires specific adjustments to handle the increased market noise and speed. The core principles remain the same, but the implementation must be faster and more disciplined.
How to Use Supertrend in Intraday Trading
The key to success with the how to use Supertrend indicator in intraday trading query lies in selecting the right settings and timeframe. On timeframes like the 1, 5, or 15-minute charts, market movements are rapid, and false signals are more common. To counteract this, traders often use tighter settings.
- Timeframe Selection: The 5-minute and 15-minute charts are generally the most popular for day trading with Supertrend. The 1-minute chart is typically reserved for experienced scalpers as it can be extremely noisy.
- Customizing Settings: For intraday trading, the default settings (10, 3) might be too slow. Many day traders prefer slightly faster settings, such as an ATR period of 7 or 10 and a multiplier of 2 or 2.5. This makes the indicator more responsive to quick price shifts, which is essential for capturing smaller, intraday moves. As always, these should be backtested for the specific asset.
- Combining with Momentum: On short timeframes, confirming signals is non-negotiable. Combining Supertrend with a momentum oscillator like the Stochastic or RSI is crucial. For example, a buy signal from the Supertrend is much stronger if the Stochastic oscillator is also showing a bullish crossover out of an oversold condition.
A Step-by-Step Intraday Trade Example
Let’s walk through a hypothetical intraday trade on a 5-minute chart of the EUR/USD pair.
- Setup: The chart has a Supertrend indicator (settings 10, 2) and an RSI (14-period).
- Observation: The market has been in a downtrend, with the red Supertrend line holding above the price. The RSI has been hovering in bearish territory.
- Entry Signal: A candle closes decisively above the red Supertrend line, causing it to flip green. At the same time, the RSI crosses up through the 30 level. This confluence of signals (trend reversal + momentum confirmation) provides a strong entry trigger.
- Execution: Enter a long position at the open of the next candle. Place an initial stop-loss just below the newly formed green Supertrend line.
- Trade Management: The price begins to trend upward, and the green Supertrend line follows, acting as a trailing stop-loss. The position remains open as long as the price stays above the line.
- Exit: After a profitable run, a 5-minute candle closes below the green Supertrend line, causing it to flip red. This is the signal to exit the trade and take profit. The RSI may also be showing bearish divergence, providing further confirmation to close the position.
Limitations and Advanced Use Cases
While the Supertrend indicator is an outstanding tool, it is essential to be aware of its limitations to use it effectively. No indicator provides a complete picture of the market on its own. Understanding its weaknesses allows a trader to build systems that compensate for them, leading to more consistent performance. The primary challenge, as noted, is its vulnerability in non-trending, sideways markets.
Challenges in Sideways Markets
In a ranging or choppy market, the price lacks a clear directional bias. It oscillates within a horizontal channel, leading the Supertrend to generate a series of “whipsaws.” The indicator will flip from green to red and back again in quick succession, each time generating a small loss as the trader is forced to reverse their position. To counter this, traders should add a “trend filter” to their strategy. An effective and simple filter is the Average Directional Index (ADX). If the ADX is below a certain level (typically 20 or 25), it suggests the market is in a non-trending state. A simple rule can be: “Only take Supertrend signals if the ADX is above 25.” This one rule can dramatically reduce losing trades in choppy conditions.
Supertrend vs. Other Trend Indicators
How does the Supertrend stack up against other popular trend indicators?
- Moving Averages: Moving averages are smoother and slower than the Supertrend. They are excellent for identifying the long-term, underlying trend but are less effective for precise entry/exit timing. The Supertrend indicator often provides earlier signals due to its volatility component. Use moving averages for overall trend direction and Supertrend for trade execution.
- Parabolic SAR: The Parabolic SAR is similar in that it provides reversal signals and acts as a trailing stop. However, it tends to be much more sensitive than the Supertrend and can flip direction on very minor price corrections. This makes it more suitable for tight stop-losses but also more prone to being stopped out prematurely in a healthy trend. Supertrend generally gives a trend more room to move.
Read More: How to Use the ATR Indicator in Forex
Supertrend in Different Markets
A hallmark of a great indicator is its adaptability across different asset classes. The Supertrend indicator performs admirably in this regard, but its application requires nuanced adjustments depending on the unique personality of the market you are trading. Volatility, trading hours, and typical market structure all play a role in how you should configure and interpret its signals.
Stocks
For stock trading, especially with blue-chip companies, markets tend to be less volatile than forex or crypto. Here, the default settings (10, 3) on a daily chart for swing trading can be quite effective. For more volatile tech or growth stocks, you might consider widening the multiplier to 3.5 or 4 to avoid being shaken out by sharp but temporary price swings. Volume confirmation is particularly important in stock trading; a Supertrend flip accompanied by a surge in volume is a much more reliable signal.
Forex
The forex market operates 24/5 and is known for its strong trending phases, making it an ideal environment for the Supertrend indicator. For major pairs like EUR/USD or GBP/USD, standard settings work well on timeframes from 1-hour upwards. For more volatile or exotic pairs, backtesting is crucial. I’ve found that combining Supertrend with pivot points is a powerful strategy in forex. A Supertrend buy signal that occurs right after the price bounces off a key daily pivot support level is a high-probability setup.
Crypto
Cryptocurrencies are notorious for their extreme volatility. This is both a risk and an opportunity. A standard Supertrend with a multiplier of 3 will likely get whipsawed frequently. To succeed in crypto, you must use a larger multiplier—often in the range of 4 to 6. This widens the bands enough to absorb the massive price swings. The Double Supertrend strategy is particularly effective here, using a slow indicator to define the main trend and a faster one for entries on pullbacks. Always be mindful of the significant risk involved and use appropriate position sizing.
Pro Tips to Maximize Your Profits
Moving from consistently breaking even to becoming consistently profitable often comes down to a few pro-level refinements. These tips are based on experience and are designed to help you avoid common traps and maximize the effectiveness of your trading with Supertrend indicator. They focus on multi-timeframe analysis, avoiding whipsaws, and maintaining discipline.
Combine Timeframes for Confirmation
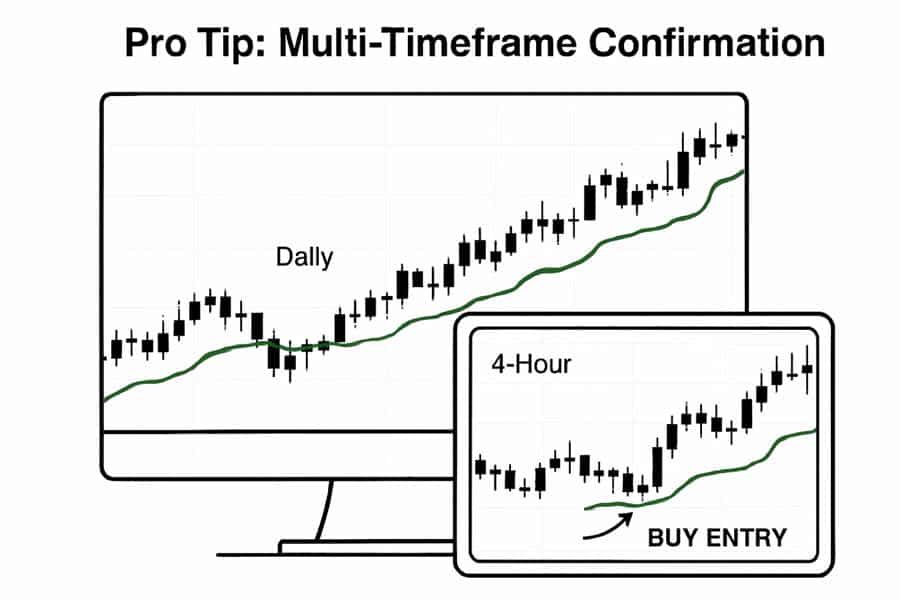
This is one of the most powerful techniques in trading. Instead of relying on a single timeframe, use a higher timeframe to establish the dominant trend and a lower timeframe to pinpoint your entry. Example:
- Higher Timeframe (e.g., Daily Chart): Check the Supertrend here first. If it’s green, your bias is bullish. You should only be looking for long entries.
- Lower Timeframe (e.g., 4-Hour Chart): Now, switch to the 4H chart. Wait for the Supertrend on this chart to give a buy signal (flipping to green) or for the price to pull back to the green Supertrend line.
This method ensures you are always trading in the direction of the main trend, which dramatically increases your win rate.
How Experienced Traders Avoid Whipsaws
Pros don’t try to trade every signal. They learn to recognize the market conditions that produce false signals. As mentioned, using the ADX is a great filter. Another experienced technique is to simply observe the angle of the Supertrend line. If the line is steep and moving decisively up or down, the trend is strong. If the line flattens out and is moving horizontally, the market is ranging, and it’s a good time to be cautious or stay on the sidelines. Patience is a trader’s greatest asset; sometimes the best trade is no trade at all.
Emotional Discipline is Non-Negotiable
The Supertrend indicator provides clear, objective signals, which is a huge advantage. However, it’s useless if you let fear or greed override its signals. The system is mechanical: you enter when it gives a signal, you place your stop where it tells you, and you exit when it flips. Trust the system you’ve developed and backtested. Don’t exit a profitable trade early just because you’re scared of giving back some profits. Let the trailing stop-loss do its job. Similarly, don’t move your stop-loss further away if a trade goes against you. Accepting a small, planned loss is part of the game.
Trade with a Trusted Broker: Opofinance
To effectively implement your Supertrend indicator strategy, you need a reliable, regulated broker. Opofinance, regulated by ASIC, offers a premium trading environment designed for modern traders.
- Advanced Trading Platforms: Choose from industry-leading platforms including MT4, MT5, cTrader, and the intuitive OpoTrade app.
- Innovative AI Tools: Gain a competitive edge with our AI Market Analyzer, personalized AI Coach, and instant AI Support.
- Flexible Trading Options: Explore opportunities in Social Trading and Prop Trading to diversify your strategies.
- Secure & Convenient Transactions: Enjoy seamless deposits and withdrawals with zero fees, including support for crypto payments.
Enhance your trading experience with cutting-edge technology and robust security. Open your account with Opofinance today!
Conclusion
The Supertrend indicator is a uniquely powerful and accessible tool for trend traders. Its strength lies in its simplicity, providing clear, visual signals that help eliminate emotional decision-making and build disciplined trading habits. By understanding its ATR-based formula, optimizing its settings for specific markets, and combining it with other indicators for confirmation, you can create a robust Supertrend indicator strategy. While it is not a holy grail and has limitations in sideways markets, its effectiveness in trending conditions makes it an indispensable part of any trader’s toolkit.
References: +
What is the most profitable Supertrend setting?
There is no single “most profitable” setting. The optimal settings depend entirely on the asset’s volatility and the timeframe being traded. The default (10, 3) is a balanced starting point, but backtesting different combinations like (20, 4) for long-term trends or (7, 2) for intraday trading is necessary to find what works best for your specific strategy.
Can Supertrend predict market reversals?
Supertrend is a trend-following indicator, not a predictive one. It confirms a reversal after it has happened by flipping its signal. It does not predict when a reversal will occur. For predictive insights, it should be used with leading indicators like momentum oscillators or support/resistance analysis.
Is the Supertrend indicator a leading or lagging tool?
It is a lagging indicator. Like all trend-following tools, it identifies a trend after it has already established itself. However, because it incorporates the Average True Range (ATR) to measure volatility, it is generally more responsive and provides earlier signals than traditional moving average systems.
How accurate is the Supertrend signal?
The accuracy of the Supertrend indicator is highly dependent on market conditions. In a strong, trending market (either up or down), its accuracy is very high. In a sideways or ranging market, its accuracy drops significantly, and it is prone to producing false signals or “whipsaws.” This is why using a trend-confirming filter like the ADX is highly recommended.
Can I use the Supertrend indicator for scalping?
Yes, scalpers can use the Supertrend on very short timeframes like the 1-minute or 5-minute charts. However, they must use tighter settings (e.g., a smaller multiplier like 1.5 or 2) and always combine it with a momentum oscillator to confirm entries, as market noise is much higher on these timeframes.


