

Are you searching for the best trading strategy for US30? Look no further. This comprehensive guide will reveal the most effective approach to trading the Dow Jones Industrial Average (DJIA) futures contract, commonly known as US30. By implementing the right strategy, you can maximize your profits and minimize risks in this dynamic market. Partnering with a trusted forex broker can also play a crucial role in achieving success.
The best trading strategy for US30 combines technical analysis, fundamental research, and risk management techniques. It involves identifying key support and resistance levels, analyzing market trends, and using specific indicators to make informed trading decisions. This approach allows traders to capitalize on both short-term price fluctuations and long-term market movements.
In this article, we’ll dive deep into the intricacies of US30 trading, exploring proven strategies, essential tools, and expert insights to help you succeed in this exciting market. Whether you’re a novice trader or an experienced professional, you’ll find valuable information to enhance your trading performance and achieve your financial goals.
Understanding the US30 Market
Before we delve into the best trading strategy for US30, it’s crucial to understand the market itself.
What is US30?
US30 refers to the futures contract based on the Dow Jones Industrial Average (DJIA), one of the oldest and most widely followed stock market indices in the world. The DJIA tracks the performance of 30 large, publicly-owned companies listed on the New York Stock Exchange (NYSE) and NASDAQ.
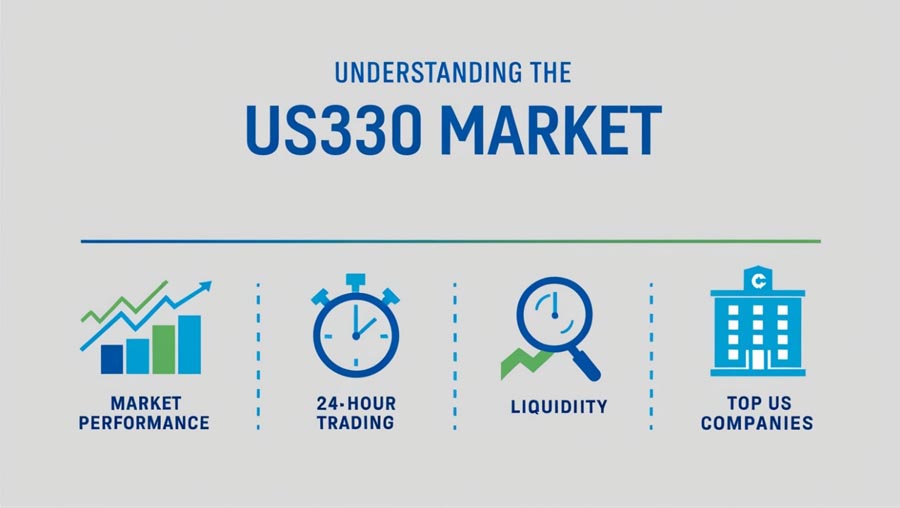
Why Trade US30?
- High liquidity
- 24-hour trading
- Leverage opportunities
- Exposure to top US companies
- Potential for significant profits
Historical Performance
The US30 has shown remarkable growth over the years. Since its inception in 1896, the Dow Jones Industrial Average has increased from 40.94 points to over 30,000 points in recent years. This long-term upward trend has made it an attractive instrument for both long-term investors and short-term traders.
Read More: Best Trading Strategy for EURUSD
Key Components of the Best Trading Strategy for US30
1. Technical Analysis
Technical analysis forms the foundation of any successful US30 trading strategy. By studying price charts and using various indicators, traders can identify patterns and make informed decisions.
Essential Technical Indicators
- Moving Averages (MA)
- Relative Strength Index (RSI)
- Bollinger Bands
- MACD (Moving Average Convergence Divergence)
- Fibonacci Retracements
Chart Patterns
In addition to indicators, recognizing chart patterns can provide valuable insights:
- Head and Shoulders
- Double Tops and Bottoms
- Triangles (Ascending, Descending, Symmetrical)
- Flag and Pennant Patterns
- Cup and Handle
2. Fundamental Analysis
While technical analysis is crucial, incorporating fundamental analysis can provide a more comprehensive view of the market.
Key Fundamental Factors to Consider
- Economic indicators (GDP, employment data, inflation rates)
- Federal Reserve policies
- Corporate earnings reports
- Geopolitical events
- Market sentiment
Impact of Component Stocks
Since the US30 is composed of 30 major companies, significant news or performance changes in these stocks can impact the entire index. Pay attention to earnings reports, management changes, and industry trends affecting these component stocks.
3. Risk Management
No trading strategy is complete without robust risk management techniques.
Essential Risk Management Practices
- Set stop-loss orders
- Use proper position sizing
- Implement a risk-reward ratio
- Diversify your portfolio
- Never risk more than you can afford to lose
Position Sizing
Proper position sizing is critical for long-term success. A common rule of thumb is to risk no more than 1-2% of your total trading capital on a single trade. This approach helps protect your account from significant drawdowns and allows you to withstand a series of losing trades.
Read More: best trading strategy for xauusd
The Best Trading Strategy for US30: A Step-by-Step Approach
Now that we’ve covered the key components, let’s dive into the best trading strategy for US30. This comprehensive approach combines various elements to create a robust and effective trading method.
Step 1: Identify the Overall Trend
Begin by analyzing the daily and weekly charts to determine the primary trend. Use moving averages, such as the 50-day and 200-day MAs, to identify bullish or bearish momentum.
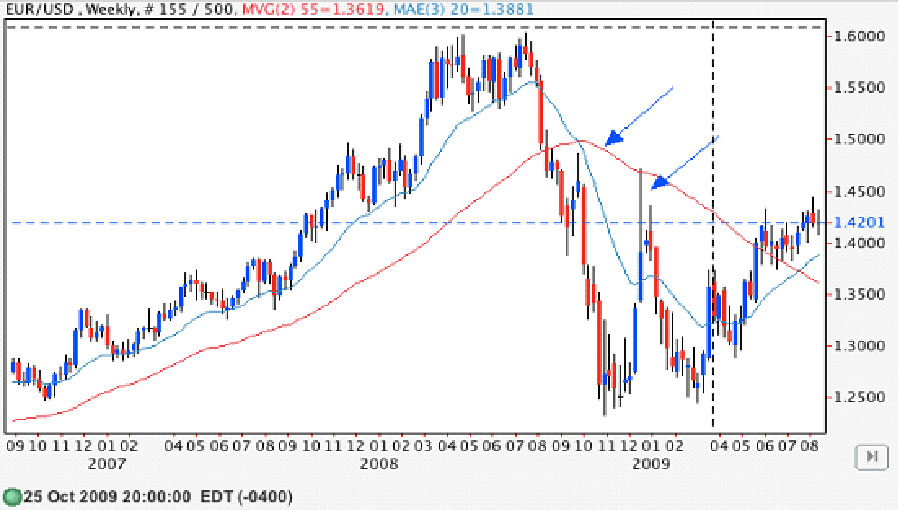
- Bullish trend: Price above both 50-day and 200-day MAs, with 50-day MA above 200-day MA
- Bearish trend: Price below both MAs, with 50-day MA below 200-day MA
- Sideways trend: Price fluctuating between MAs, with MAs relatively flat
Consider using the Average Directional Index (ADX) to confirm trend strength. An ADX reading above 25 indicates a strong trend, while below 20 suggests a weak or non-existent trend.
Step 2: Spot Key Support and Resistance Levels
Identify critical price levels where the US30 has previously reversed or consolidated. These levels often act as barriers to price movement and can provide valuable entry and exit points.
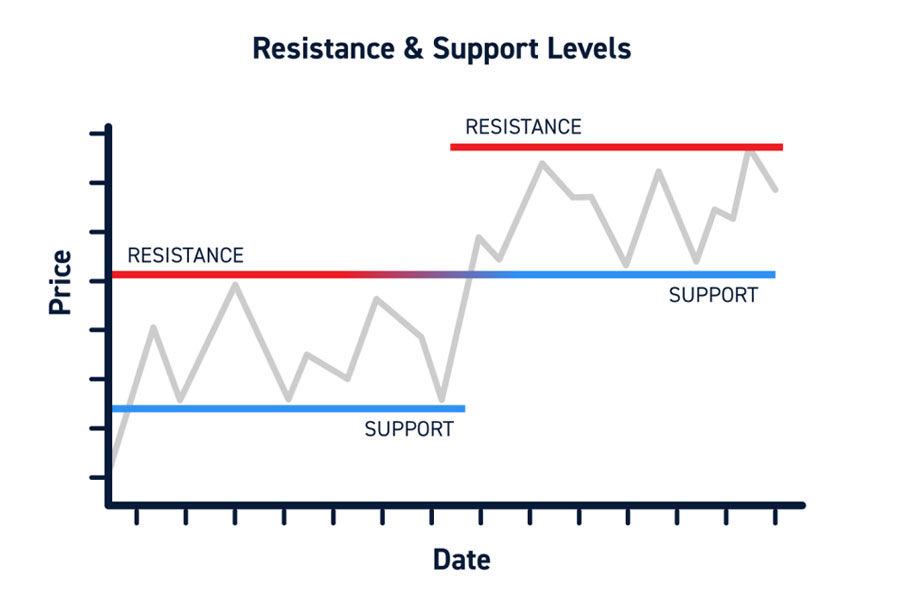
- Use horizontal line tools to mark significant highs and lows
- Pay attention to psychological round numbers (e.g., 30,000, 31,000)
- Consider using Fibonacci retracement levels to identify potential support and resistance
Step 3: Use Multiple Timeframes
Combine analysis from different timeframes to get a more comprehensive view of the market. This multi-timeframe analysis helps confirm trends and identify high-probability entry points.
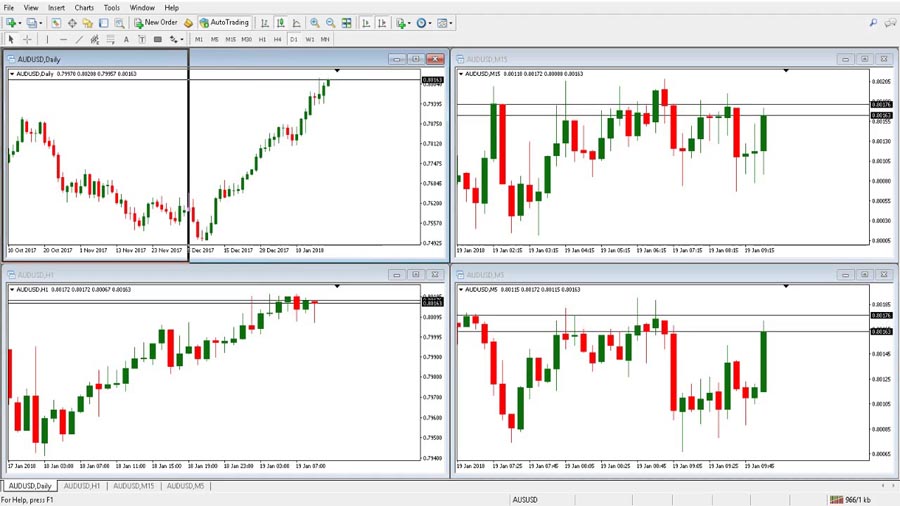
- Use the weekly chart for long-term trend identification
- Analyze the daily chart for medium-term trend confirmation
- Utilize the 4-hour and 1-hour charts for entry and exit signals
Ensure that your trading decisions align across multiple timeframes for increased confidence in your trades.
Step 4: Apply Technical Indicators
Utilize a combination of technical indicators to confirm your analysis:
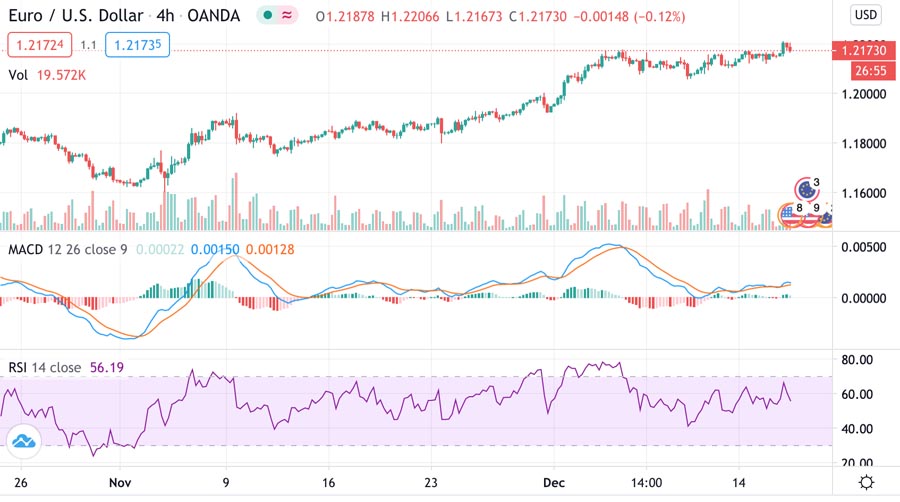
- RSI (Relative Strength Index) for overbought/oversold conditions
- Overbought: RSI above 70
- Oversold: RSI below 30
- Look for divergences between price and RSI for potential reversal signals
- MACD (Moving Average Convergence Divergence) for trend strength and potential reversals
- MACD line crossing above signal line: Bullish signal
- MACD line crossing below signal line: Bearish signal
- Divergences between MACD and price can indicate potential trend reversals
- Bollinger Bands for volatility and potential breakouts
- Price touching upper band: Potential overbought condition
- Price touching lower band: Potential oversold condition
- Bollinger Band squeeze (bands narrowing) can indicate impending volatility
- Volume analysis
- Increasing volume during price movements confirms trend strength
- Decreasing volume during price movements suggests potential trend weakness
Step 5: Consider Fundamental Factors
Stay informed about economic releases, Federal Reserve announcements, and major corporate events that could impact the US30. Adjust your trading decisions accordingly.
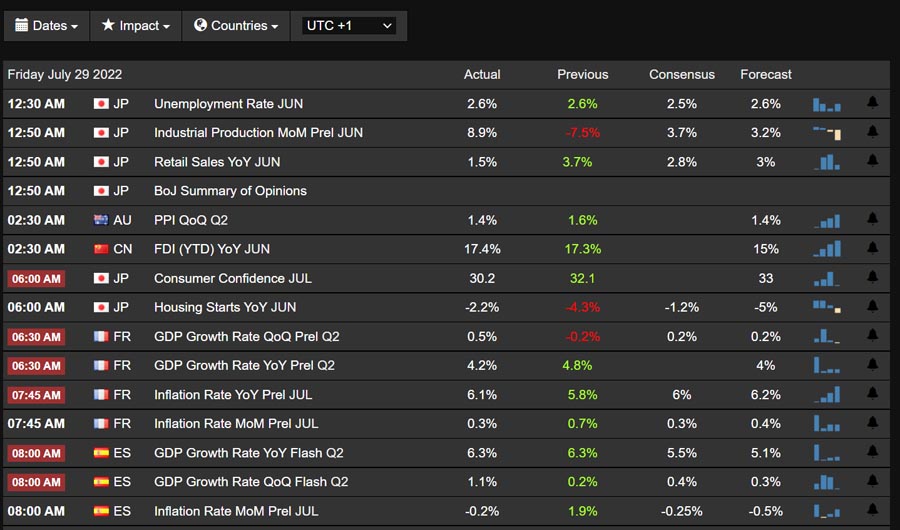
- Use an economic calendar to track important releases
- Pay special attention to high-impact events like Non-Farm Payrolls, FOMC meetings, and GDP reports
- Monitor news related to the 30 companies that make up the Dow Jones Industrial Average
Step 6: Implement Entry and Exit Rules
Develop clear rules for entering and exiting trades based on your technical and fundamental analysis. For example:
Entry rules:
- Enter long when price breaks above a key resistance level with high volume and RSI is below 70
- Enter short when price breaks below a key support level with high volume and RSI is above 30
Exit rules:
- Exit long positions when price reaches the next significant resistance or when RSI indicates overbought conditions (above 70)
- Exit short positions when price reaches the next significant support or when RSI indicates oversold conditions (below 30)
- Use trailing stops to lock in profits as the trade moves in your favor
Step 7: Manage Risk
Always use stop-loss orders to protect your capital. A common approach is to place stops below the nearest support level for long trades and above the nearest resistance for short trades.
- Risk no more than 1-2% of your trading capital on any single trade
- Calculate position size based on your predetermined risk per trade
- Consider using a risk-reward ratio of at least 1:2 (risking 1% to potentially gain 2%)
Step 8: Execute Your Trades
Once all conditions are met, execute your trades with discipline:
- Double-check all parameters before entering a trade
- Use limit orders for more precise entry and exit points
- Avoid chasing the market if you miss an entry – wait for the next setup
Step 9: Monitor and Adjust
Continuously evaluate your strategy’s performance and make necessary adjustments. Keep a trading journal to track your decisions and learn from both successful and unsuccessful trades.
- Record all trades, including entry and exit points, reasons for the trade, and outcome
- Regularly review your journal to identify patterns and areas for improvement
- Be prepared to adjust your strategy as market conditions change
Read More: best trading strategy for crude oil
Advanced Techniques for US30 Trading
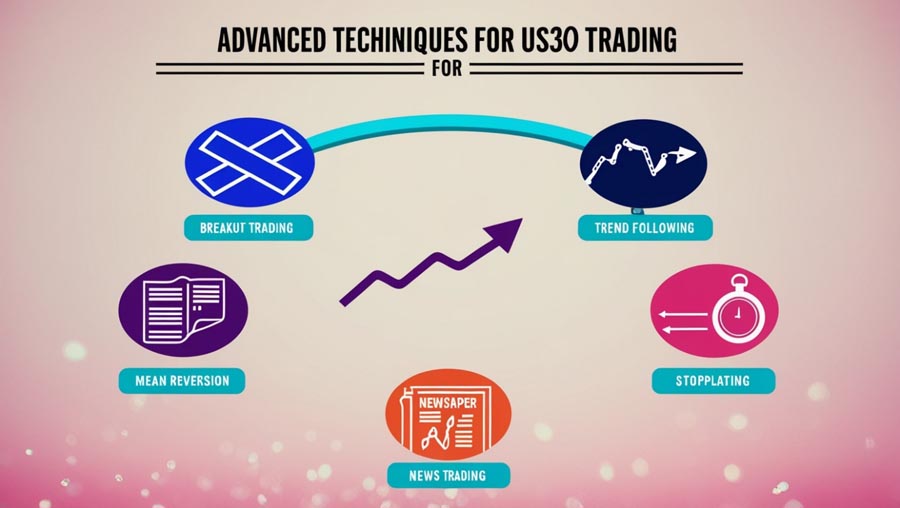
1. Breakout Trading
Capitalize on strong price movements by identifying and trading breakouts from key support and resistance levels. Use volume analysis to confirm the strength of the breakout.
Breakout Confirmation
To avoid false breakouts, look for:
- Increased trading volume during the breakout
- Price closing beyond the breakout level
- Follow-through in the subsequent trading sessions
2. Trend Following
Align your trades with the overall market trend to increase your chances of success. Use trend-following indicators like moving averages and MACD to confirm the trend direction.
Trend Strength Assessment
Consider using the Average Directional Index (ADX) to measure trend strength. An ADX reading above 25 typically indicates a strong trend, while readings below 20 suggest a weak or non-existent trend.
3. Mean Reversion
Take advantage of short-term price fluctuations by trading reversals when the market becomes overextended. Use indicators like RSI and Bollinger Bands to identify potential reversal points.
Mean Reversion Strategies
- Bollinger Band Squeeze: Look for opportunities when the bands contract, indicating low volatility, followed by a price breakout.
- RSI Divergence: Identify potential reversals by spotting divergences between price action and RSI readings.
4. News Trading
Capitalize on market volatility surrounding major economic releases and news events. Develop a strategy for trading during high-impact news announcements.
Key Economic Indicators
Pay close attention to:
- Non-Farm Payroll (NFP) reports
- Federal Reserve interest rate decisions
- GDP growth figures
- Consumer Price Index (CPI) data
5. Scalping
For experienced traders, scalping can be an effective way to profit from small price movements in the US30. This strategy requires quick decision-making and strict risk management.
Scalping Techniques
- Use tick charts or 1-minute charts for precise entry and exit points
- Focus on high-volume trading sessions for better liquidity
- Implement tight stop-loss orders to minimize potential losses
Common Mistakes to Avoid in US30 Trading
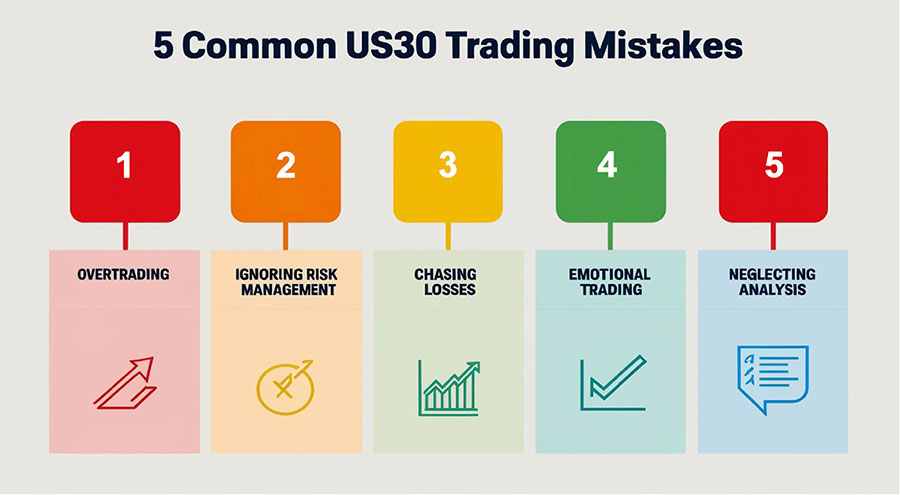
- Overtrading
- Ignoring risk management
- Chasing losses
- Failing to adapt to changing market conditions
- Neglecting fundamental analysis
Overcoming Trading Pitfalls
- Set realistic profit targets and avoid greed
- Take regular breaks to maintain mental clarity
- Review your trades regularly to identify areas for improvement
- Develop a structured approach to handle losses and drawdowns
Conclusion
Mastering the best trading strategy for US30 requires dedication, continuous learning, and disciplined execution. By combining technical analysis, fundamental research, and robust risk management techniques, you can develop a powerful approach to trading this dynamic market.
Remember that no strategy guarantees success, and it’s essential to adapt your approach as market conditions evolve. Stay informed, practice in a demo account, and always prioritize risk management to protect your capital.
With the insights and techniques shared in this guide, you’re now equipped to take your US30 trading to the next level. Start implementing these strategies, refine your approach, and unlock your potential for success in the exciting world of US30 trading.
As you embark on your US30 trading journey, remember that consistency and patience are key. Develop a solid foundation of knowledge, practice diligently, and be prepared to adapt to changing market conditions. With dedication and the right strategy, you can navigate the complexities of US30 trading and work towards achieving your financial goals.
How much capital do I need to start trading US30?
The amount of capital required to trade US30 depends on various factors, including your broker’s requirements and your risk tolerance. Generally, it’s recommended to start with at least $5,000 to $10,000 to allow for proper position sizing and risk management. However, some brokers offer micro contracts that allow you to start with a smaller account size. Always remember to trade with funds you can afford to lose and never risk more than 1-2% of your account on a single trade.
What is the best time to trade US30?
The US30 futures market is open 23 hours a day, five days a week, but the best time to trade often coincides with periods of high liquidity and volatility. The most active trading hours typically occur during the New York trading session (9:30 AM to 4:00 PM EST) when US stock markets are open. Additionally, the market tends to be more volatile during major economic releases and Federal Reserve announcements. However, it’s essential to find a trading time that suits your schedule and allows you to maintain a consistent routine.
Can I use automated trading systems for US30?
Yes, automated trading systems can be used for US30 trading. These systems, also known as algorithmic trading or trading bots, execute trades based on pre-programmed rules and strategies. They can be particularly useful for implementing complex strategies, back testing, and maintaining discipline in your trading. However, it’s crucial to thoroughly test any automated system before using it with real money and to understand its limitations. Additionally, even with automated systems, human oversight is still necessary to monitor performance and make adjustments as market conditions change.


One Response
Very concise explanation. Thanks. Now i think i am going to make the most of my US30 strategy