

A tick chart scalping strategy is a trading method that uses price changes (ticks) instead of time intervals to build charts, offering a granular view of market activity perfect for ultra-fast scalping. This approach allows traders to see every transaction, providing a unique edge in identifying momentum and order flow. Whether you are using an online forex broker or trading futures, understanding these strategies is crucial. This guide covers the most effective tick chart strategies for 2025, from setups and settings to advanced execution techniques, helping you master this high-precision trading style.

Key Takeaways
- Speed and Precision: Tick charts are not based on time but on the number of transactions, making them ideal for identifying short-term momentum shifts essential for a successful tick chart scalping strategy.
- Strategy Comes First: The most effective approach is to present actionable strategies upfront. This article details five primary methods, including Level 2 order flow, EMA crossovers, pivot points, pure price action, and indicator combos.
- Customization is Key: There is no one-size-fits-all solution for tick chart scalping settings. The optimal tick value (e.g., 100-tick, 233-tick) depends on asset liquidity and current market volatility.
- Tools Matter: Successful tick scalping requires more than just a chart. Essential tools include a DOM (Depth of Market), Time & Sales data, one-click order execution, and a low-latency connection.
- Discipline Over All: The high-speed nature of tick chart scalping demands strict risk management, psychological resilience to avoid overtrading, and a commitment to reviewing performance.
Most Effective Tick Chart Scalping Strategies

In the fast-paced world of scalping, getting straight to the point is what matters. Unlike traditional approaches that bury actionable advice in theory, we’re putting the most potent strategies front and center. A successful tick chart scalping strategy hinges on identifying repeatable patterns in price movement and order flow. Below is a summary of five powerful techniques that have proven effective and are adapted for the market conditions of 2025. Each strategy leverages a different aspect of market dynamics, from raw order book data to momentum indicators.
| Strategy Name | Setup Type | Entry Signal | Exit Trigger | Key Tools |
| Level 2 Order Book + Tick Chart Scalping | Order Flow | Significant bid/ask imbalance (e.g., stacked bids, iceberg orders). | 1-2 tick profit target; automatic stop-loss (OCO). | DOM/Level 2, Time & Sales, 100-tick chart. |
| EMA Crossover + Tick Chart Momentum | Trend/Momentum | Faster EMA (e.g., 9-EMA) crosses above/below a slower EMA (e.g., 21-EMA). | Opposite crossover or pre-set tick profit target. | 9 & 21 EMAs, Volume Indicator, 100-tick chart. |
| Pivot Point & Volume Spike Scalping | Reversal/Range | Price reversal at a key pivot point confirmed by a surge in tick volume. | Immediate momentum fade or target the next pivot level. | Pivot Point Indicator, Volume, Regression Channels. |
| Price Action (No Indicators) | Pure Tape Reading | Recognizable patterns (e.g., double tops, failed breakouts) with tick speed confirmation. | Fading momentum or a clear reversal on the tape. | 70-tick chart (or similar), 20-EMA as a reference point. |
| RSI/Zero Lag Indicator Combo | Momentum/Exhaustion | RSI crosses a key threshold (e.g., 30/70) with confirmation from a zero-lag trend signal. | Take profit at a fixed 1.2 Risk/Reward ratio or on an opposite RSI cross. | Custom RSI, Zero-Lag Trend Indicator, 50/100-tick chart. |
Choosing the right tick chart scalping strategy depends heavily on market conditions and your personal trading style. Here’s a quick guide on when to use each:
- Level 2 Scalping: Best during high-liquidity sessions (e.g., London-New York overlap) in markets with transparent order books like futures (E-mini S&P 500) or certain stocks.
- EMA Crossover: A versatile strategy that works well in trending markets. Use a volume filter to avoid false signals during choppy, sideways periods.
- Pivot Point Scalping: Ideal for range-bound markets where price respects established support and resistance levels.
- Price Action Only: For experienced traders who can read the “tape” and feel the market’s rhythm. It requires intense focus and is instrument-specific.
- RSI/Zero Lag Combo: Effective during volatile sessions, such as market opens or after news releases, where momentum exhaustion and reversals are common.
A Step-by-Step Guide to Each Strategy
Now that you have an overview, let’s break down each tick chart scalping strategy into a clear, step-by-step process. The key to execution is having a defined plan for your setup, entry, and exit. This systematic approach removes emotion and allows for consistent application, which is the cornerstone of profitable scalping.
Level 2 Tick Scalping
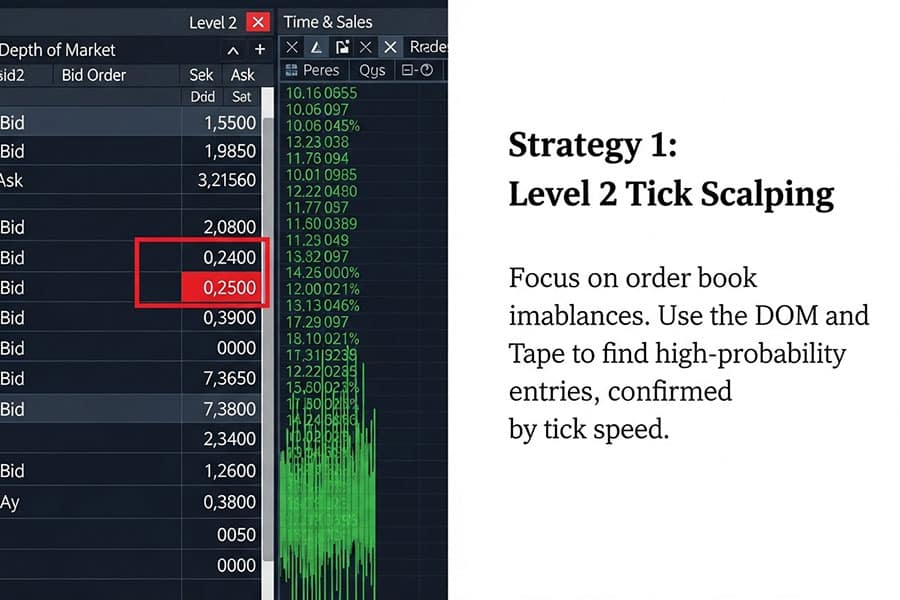
This is a pure order flow strategy that relies on reading the market’s intentions directly from the Depth of Market (DOM) and Time & Sales window. The tick chart serves as a visual confirmation of the order flow pressure.
- Setup: Your primary focus should be on your Level 2 DOM and Time & Sales (the “tape”). Position these alongside a 100-tick chart (for a liquid instrument like ES or NQ futures). The tick chart helps you visualize the speed at which trades are executing.
- Entry: The core of this tick chart entry and exit signal is order book imbalance. Look for large bids stacking up, which suggests buying pressure, or large asks, indicating selling pressure. An “iceberg order” (a large hidden order) being absorbed on the tape can also be a powerful entry signal. You enter in the direction of the dominant pressure.
- Exit: Profits are taken swiftly, often just 1-2 ticks from your entry. Use a bracket order (also known as an Order-Cancels-Order or OCO) to automatically place a small profit target and a tight stop-loss simultaneously. The goal is a high win rate with small, consistent gains.
- Practical Tips: This method is only effective during high-liquidity hours. Use trading hotkeys for instantaneous order entry and cancellation—speed is your primary advantage. Be acutely aware of the economic calendar and avoid trading right before major news releases, as this can trigger unpredictable volatility and wipe out small gains.
Read More: Tick Chart
EMA Crossover Tick Scalping
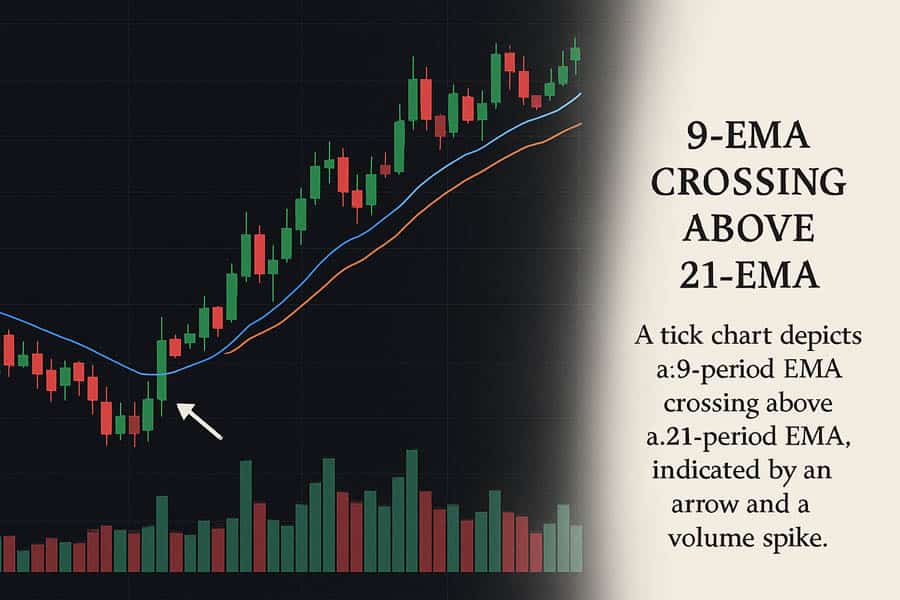
This trend-following tick chart scalping strategy uses Exponential Moving Averages (EMAs) to identify the start of short-term momentum moves. It’s one of the most popular techniques because of its visual simplicity.
- Setup: On a 100-tick chart, apply a 9-period EMA and a 21-period EMA. The 9-EMA is your fast-moving average, and the 21-EMA is your slower trend guide. These settings are a common starting point but should be adjusted based on the asset’s volatility. Finding the best tick chart indicators for scalping like these often requires experimentation.
- Entry: A buy signal occurs when the 9-EMA crosses above the 21-EMA, suggesting upward momentum is building. A sell signal occurs when the 9-EMA crosses below the 21-EMA. For a higher probability trade, wait for a slight pullback to the faster EMA after the cross before entering.
- Exit: Your exit can be triggered in two ways: either when the EMAs cross in the opposite direction or by setting a predetermined profit target (e.g., 4-5 ticks). A trailing stop that follows the slower EMA can also be used to let winning trades run slightly longer in strong trends.
- Notes: This strategy is prone to “whipsaws” (false signals) in choppy, non-trending markets. To filter out bad trades, add a volume indicator. A crossover accompanied by a spike in volume is a much more reliable signal.
Pivot or Trend Channel Scalping
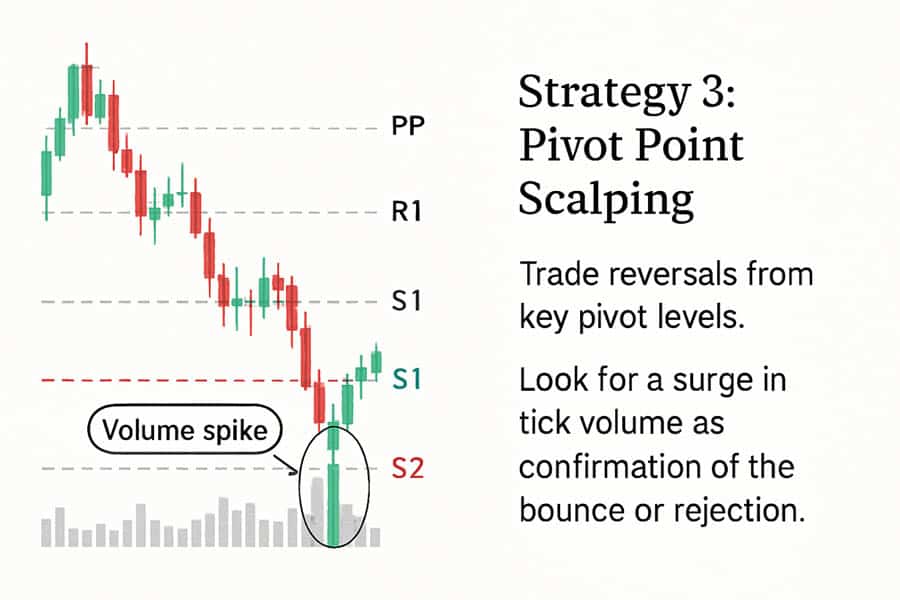
This method focuses on trading reversals from key levels of support and resistance. Pivot points are mathematically calculated levels based on the previous day’s high, low, and close, making them objective and widely watched by other traders.
- Setup: Apply a standard pivot point indicator to your tick chart. You can also use regression channels, which automatically draw trend lines based on price action. This strategy works best on instruments with tight spreads where price clearly reacts to these levels.
- Entry: Look for the price to approach a major pivot level (e.g., R1, S1). The entry signal is not just the price touching the level, but showing signs of reversal. This confirmation comes from a tick surge—a sudden increase in the speed of transactions—as bulls and bears fight for control at the pivot. Enter in the direction of the reversal.
- Exit: Since you are trading a reversal, the exit should be quick. Either take profit on the first sign of momentum stalling or set your target for the next closest pivot point (e.g., enter at S1, target the central pivot).
- Notes: This is an excellent tick chart scalping strategy for markets that are consolidating or range-bound. In a strongly trending market, price may break straight through pivot levels, so it’s crucial to assess the broader market context.
Price Action Only (Volman Style)
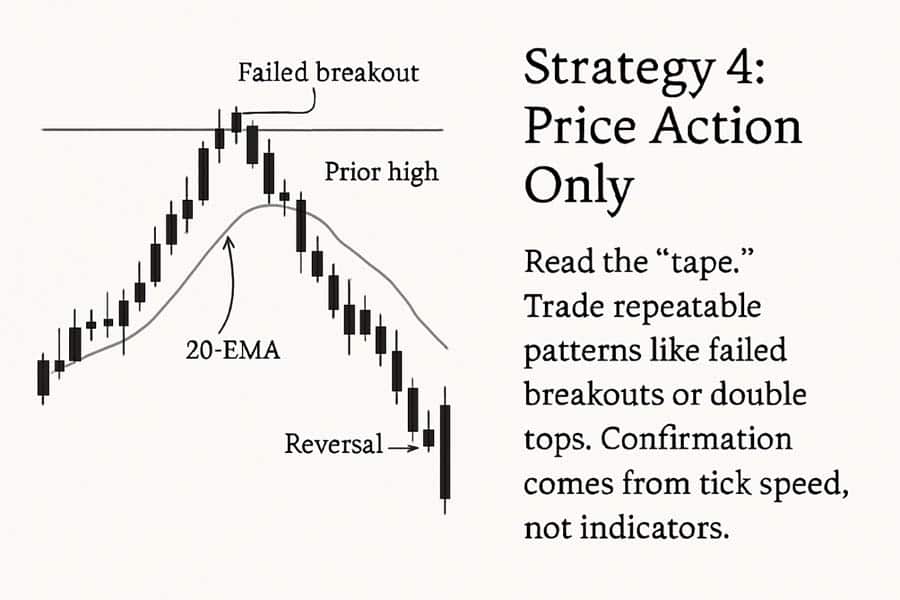
Popularized by traders like “Volman,” this pure form of scalping eschews traditional indicators. It’s about reading the raw story of the price on a tick-by-tick basis. This is an advanced tick chart scalping strategy that requires significant screen time to master.
- Setup: The chart is kept clean. A 70-tick chart is a common choice, as it’s fast enough to show detail but slow enough to identify patterns. A single 20-EMA may be added, not as a crossover signal, but as a simple reference for the short-term trend direction and dynamic support/resistance.
- Entry: Entries are based on specific, repeatable price action patterns. Examples include “double tops/bottoms,” “failed breakouts” where price breaks a key level but immediately reverses, or a “breakout-pullback” setup. The confirmation is always the speed of the ticks. A breakout with slow, sluggish ticks is likely to fail, while one with rapid, aggressive ticks has a higher chance of success.
- Exit: You exit as soon as you see the momentum that prompted your entry begin to fade. If you entered on a rapid burst of buying, you exit the moment the selling ticks start to match or overpower the buying. This requires intense focus on the Time & Sales window.
- Notes: The key here is simplicity and repetition. Find one or two high-probability setups that you can identify quickly and execute flawlessly. Don’t clutter your chart or your mind with dozens of patterns. This is the purest form of a tick chart scalping strategy.
RSI/Zero Lag Scalping
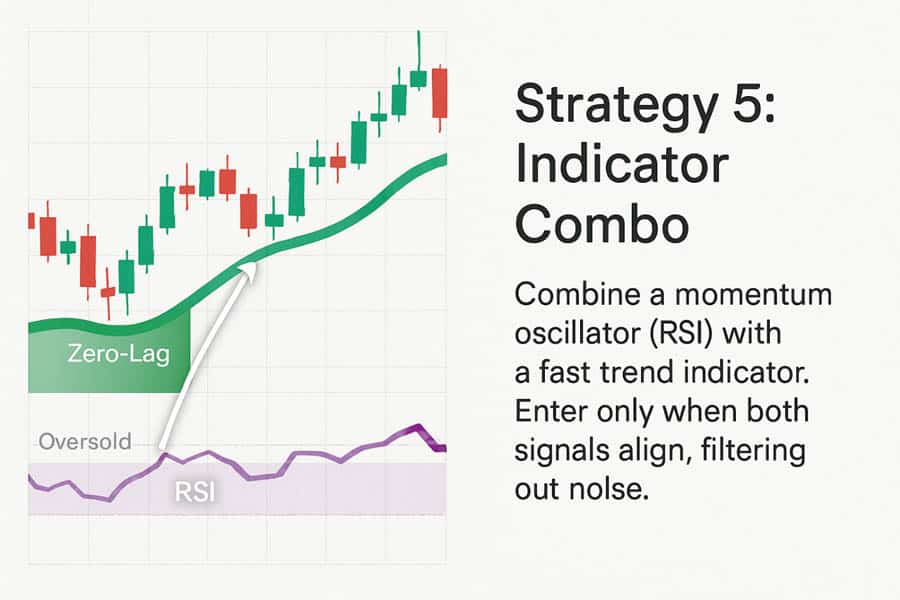
This strategy combines a classic momentum oscillator (RSI) with a modern, faster-moving trend indicator to find high-probability entries in volatile markets. It’s designed to capture moves born from exhaustion and quick reversals.
- Setup: Use a fast tick chart (e.g., 50-tick or 100-tick). Apply a Relative Strength Index (RSI), but with custom settings (e.g., a shorter period like 7 or 9). Also, add a “zero-lag” trend indicator. Many platforms offer variations of a zero-lag moving average, which is designed to respond to price changes much faster than a traditional EMA or SMA. This is one of the best tick chart indicators for scalping combinations.
- Entry: A buy signal might occur when the RSI crosses up from an oversold condition (e.g., below 30) and the zero-lag indicator confirms the uptrend (e.g., by changing color from red to green). The dual confirmation is crucial. A sell signal is the opposite: RSI crosses down from overbought (e.g., above 70) with trend confirmation.
- Exit: Exits can be systematic. For example, you could always aim for a 1.2-to-1 risk/reward ratio, meaning your profit target is 1.2 times your stop-loss distance. Alternatively, you can exit when the RSI crosses back over the midline (50) or gives an opposite signal.
- Notes: This tick chart scalping strategy thrives on volatility. It’s particularly effective during the opening minutes of a market session when price swings are wide and momentum can shift rapidly.
Read More: 1 minute forex trading strategy
Tick Chart Settings: How To Choose the Best
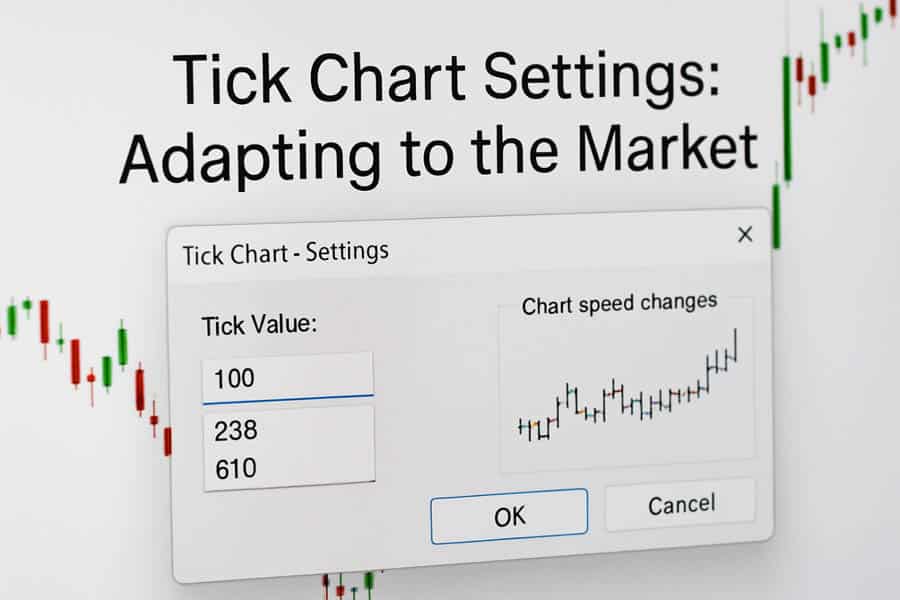
One of the most frequent questions from aspiring tick chart scalpers is about choosing the right settings. Unlike a 5-minute chart, which is always 5 minutes, a tick chart’s “speed” is dynamic. Proper tick chart scalping settings are not static; they must be adapted to the instrument you’re trading and the current market environment. An effective tick chart scalping strategy is built on this foundation.
Here’s a practical breakdown to guide you:
- Asset Liquidity is #1: The more liquid an asset, the more transactions it has, and thus the lower your tick setting should be.
- High Liquidity (e.g., E-mini S&P 500, Major Forex Pairs like EUR/USD): A 100-tick or 233-tick chart is a common starting point. These update frequently, giving you a very detailed view.
- Medium/Low Liquidity (e.g., Less common futures, individual stocks): A 500-tick, 610-tick, or even higher setting might be necessary. Using a 100-tick chart on an illiquid asset would result in a chart that barely moves or looks chaotic.
- Adjust for Volatility: Volatility is the heartbeat of the market. Your settings must be in sync with it.
- High Volatility (Market opens, news events): Consider using a larger tick setting (e.g., move from 233-tick to 500-tick). This smooths out the noise and helps you see the underlying trend instead of getting shaken out by erratic moves.
- Low Volatility (Mid-day doldrums): Use a smaller tick setting (e.g., move from 233-tick to 100-tick). This will make the chart more sensitive and help you spot small momentum shifts that would be invisible on a slower chart.
- Use ATR for Target Setting: A great pro-tip for setting profit and stop-loss targets is to use the Average True Range (ATR) indicator. Some traders adapt this for ticks by aiming for a profit target equal to ATR/2. This ensures your targets are dynamic and adapt to current market conditions.
- Data Feed Reliability: This is non-negotiable. Your broker or platform must provide a reliable, high-quality, tick-by-tick data feed. A poor data feed that bundles or skips ticks will render any tick chart scalping strategy useless. Before committing real capital, test your broker’s feed on a demo account.
Essential Tools & Order Flow
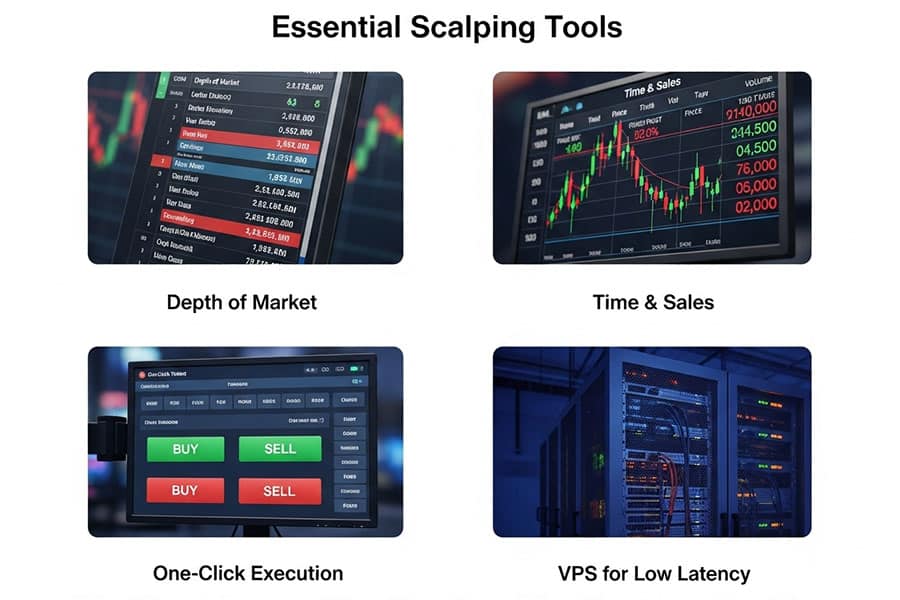
A scalper is only as good as their tools. In a game of speed and precision, having the right equipment is a massive edge. Implementing a tick chart scalping strategy effectively requires a setup that prioritizes rapid analysis and execution. Thinking you can succeed by just pointing and clicking on a chart is a common novice mistake.
- DOM/Level 2: The Depth of Market is your window into the order book. It shows you the pending buy and sell limit orders at different price levels. For an order flow trader, this is the most critical tool for gauging supply and demand in real-time.
- Time & Sales/Tape: The tape shows you every single transaction as it happens—price, size, and time. Watching the tape tells you if buyers or sellers are more aggressive right now. A DOM shows intentions (limit orders), but the tape shows actions (market orders).
- Hotkeys or One-Click Routing: In scalping, a half-second delay can be the difference between a profit and a loss. You must have the ability to enter, exit, and cancel orders instantly. Configure keyboard hotkeys or use a chart trader interface that allows for one-click order submission.
- Bracket/OCO Orders: As mentioned, these are essential for risk management. The moment you enter a trade, a bracket order automatically places a profit-target limit order and a stop-loss market order. This removes the emotional hesitation of when to take a small loss or a small gain.
- VPS (Virtual Private Server): For serious scalpers, especially those using automated or semi-automated systems, a VPS is crucial. It’s a remote server located physically close to your broker’s trading servers. This dramatically reduces latency (the time it takes for your order to reach the exchange), minimizing slippage.
Key Trade Execution Tips

Having a great strategy and the right tools is half the battle. The other half is execution. This is where experience, discipline, and a deep understanding of market dynamics come into play. Many traders fail not because their tick chart scalping strategy is flawed, but because their execution is poor. Here are some experience-based tips.
- Trade Liquid Sessions: Always trade when the market is most active. For forex, this is the London-New York overlap. For futures, it’s the first one or two hours after the market opens. Liquidity means tighter spreads, less slippage, and more reliable patterns. Trying to scalp in a dead market is a recipe for frustration and losses.
- Anticipate and Avoid Slippage: Slippage is when you get a different price than you expected. When scalping for just a few ticks, it can wipe out your entire profit. Use limit orders for your entries and profit targets to prevent negative slippage, but always use a market order for your stop-loss to ensure you get out when you need to.
- Keep Position Sizes Small: The goal of scalping is not to hit home runs. It’s to make small, consistent profits. Using oversized positions amplifies the emotional pressure and can lead to catastrophic losses from a few bad trades. Your risk per trade should be a tiny fraction of your account balance.
- Practice “Scratching” Trades: A “scratch” is a trade that you exit at or very near your entry price (breakeven). If a setup doesn’t work out immediately—if the momentum you expected doesn’t appear—don’t wait for your stop-loss to be hit. Scratch it and move on. This is a critical skill for preserving capital.
- Maintain a Detailed Trade Log: This is your performance review tool. For every trade, log the instrument, strategy used, entry price, exit price, and a screenshot of the chart at the time of entry. Review your log weekly to identify what’s working and what isn’t. This feedback loop is essential for refining your tick chart entry and exit signals.
Read More: mastering scalping in forex
Example Tick Chart Scalping Trades
To bring these concepts to life, let’s look at a few hypothetical trade examples. Theory is one thing, but seeing how a tick chart scalping strategy plays out provides invaluable context. The following table illustrates potential trades based on the strategies discussed, highlighting the thought process behind each one.
| NY Open / ES Futures | 100-tick | Level 2 Tick Scalping | Saw a large bid order (200 lots) appear on the DOM at 5050.25. Entered long at 5050.50 as buyers started aggressively hitting the ask. Exited at 5051.25 for a quick profit as the tape speed slowed. | +3 Ticks | Order flow imbalance provided a high-probability, low-risk entry. The key was acting fast. |
| London Session / EURUSD | 233-tick | EMA Crossover | 9-EMA crossed below 21-EMA with a surge in volume. Entered short. Price moved down but stalled before the profit target. Exited (“scratched”) when price ticked back up to the entry point. | 0 Ticks (Breakeven) | The setup was valid, but immediate momentum failed. Scratching the trade preserved capital and avoided a potential loss. |
| Asian Session / USDJPY | 500-tick | Pivot Point Scalping | Price drifted down to the S1 pivot point during a low-volatility session. A sharp increase in tick activity at S1 signaled a reversal. Entered long. Exited just below the central pivot. | +6 Ticks | In quiet markets, pivot levels are often respected. Confirming with tick speed was crucial for avoiding a false signal. |
| NY Open / NQ Futures | 70-tick | Price Action Only | Price broke above yesterday’s high but immediately failed, with heavy selling on the tape. Entered short on the “failed breakout” pattern. Exited as soon as buying ticks reappeared. | +8 Ticks | A classic institutional pattern. The failure to hold above a key level was a stronger signal than the breakout itself. This is a core concept in many a professional’s tick chart scalping strategy. |
Common Mistakes & How to Avoid Them
The path to mastering any tick chart scalping strategy is littered with common pitfalls. Being aware of these mistakes is the first step toward avoiding them. Many aspiring scalpers have the right ideas but fall victim to correctable errors in discipline and execution.
- Overtrading and Burnout: The sheer number of potential signals on a tick chart can lead to psychological burnout. You feel you must be in a trade at all times.
How to Avoid: Set a strict limit on the number of trades you’ll take per day or a maximum daily loss. Once you hit that limit, walk away. Quality over quantity. - Ignoring Costs: Spreads and commissions are the silent killers of a scalping account. A 1-tick profit can easily become a net loss after costs.
How to Avoid: Only trade instruments with very tight spreads. Understand your broker’s commission structure completely. Your average winner must be significantly larger than your trading costs. Choose a regulated forex broker with a competitive cost structure. - Trading Illiquid Markets: Using a fast tick chart in a slow, illiquid market leads to wide spreads, high slippage, and unreliable chart patterns.
How to Avoid: Stick to the most liquid instruments and trading sessions. If the chart isn’t moving and the spread is wide, it’s not a scalping environment. - Signal-Taking Without Confirmation: Seeing an EMA cross or an RSI level hit and immediately jumping in is a mistake. A signal is not a command.
How to Avoid: Always demand confirmation. An indicator signal should be confirmed by price action, volume, or order flow. For instance, wait for the crossover and a tick speed increase in the same direction. This discipline filters out many losing trades.
Final Pro Tips for Advanced Scalpers
Once you’ve mastered the basics and developed a consistent tick chart scalping strategy, you can begin to incorporate more advanced techniques to refine your edge. These tips are for traders who are already comfortable with the high-speed environment of scalping and are looking for that extra layer of sophistication.
- Combine with Volume Profiling: While tick charts show transaction frequency, volume profile shows transaction volume at price. Overlaying a session volume profile on your chart can reveal high-volume nodes (areas of price agreement) and low-volume nodes (areas of price rejection). Entering trades at the edge of these zones can provide powerful, low-risk setups.
- Dynamic Tick Setting Adjustment: Pro scalpers don’t use the same tick setting all day. They adapt. Keep an eye on the “time” it takes to form a tick bar. If your 100-tick bars are suddenly taking 2 minutes to form instead of 30 seconds, the market has slowed down, and you should switch to a faster tick setting (e.g., 70-tick). If they are forming in 5 seconds, the market is hyper-active, and you should switch to a slower setting (e.g., 233-tick).
- Demo New Setups with Micro Lots: Before deploying a new strategy or indicator setting with your full position size, practice it on a demo account. Even better, trade it live with the smallest possible size (e.g., micro futures or 0.01 forex lots). This gives you a real feel for the execution and psychological pressure without significant financial risk.
Trade with Opofinance
Enhance your trading experience with Opofinance, an ASIC-regulated broker dedicated to providing superior trading conditions. Benefit from our advanced tools and secure environment.
- Advanced Trading Platforms: Choose from MT4, MT5, cTrader, and the intuitive OpoTrade app.
- Innovative AI Tools: Leverage our AI Market Analyzer, AI Coach, and 24/7 AI Support for a smarter trading journey.
- Flexible Trading Options: Explore Social Trading and Prop Trading opportunities.
- Secure & Flexible Transactions: Enjoy safe and convenient deposits and withdrawals, including crypto payments with zero fees.
Start Trading with a Trusted Broker Today!
Conclusion
Mastering a tick chart scalping strategy in 2025 is about merging timeless principles with modern tools. It requires precision, discipline, and an adaptive mindset. By focusing on order flow, momentum, and key price levels, and by using the right tick chart scalping settings and tools, you can build a robust framework for short-term trading. Remember that success isn’t about finding a “secret” indicator; it’s about flawlessly executing a well-defined plan, managing risk, and continuously refining your approach based on performance. This is the path to consistent scalping.
Is tick chart scalping profitable?
Yes, tick chart scalping can be highly profitable for disciplined traders who can manage costs, execute with speed, and stick to a proven strategy. Profitability depends heavily on the trader’s skill and risk management, not just the method itself.
What is the best tick size for scalping crude oil?
For a highly liquid market like Crude Oil futures (CL), traders often start with a tick setting between 233 and 610 ticks. It’s crucial to adjust this based on real-time volatility; use a higher number during very volatile periods and a lower one during quieter times.
Can you use tick charts for forex trading?
Absolutely. Tick charts are very effective for forex scalping, especially on major pairs like EUR/USD or GBP/USD, during the high-volume London-New York session overlap. A reliable forex trading broker with a good data feed is essential.
Tick chart vs. time chart: which is better for beginners?
Time charts (like the 1-minute or 5-minute) are generally easier for beginners to understand as they are constant and predictable. Tick charts require a deeper understanding of market flow and activity, making them better suited for intermediate to advanced traders.
How do I practice a tick chart scalping strategy?
Start on a demo account with a reputable broker to learn your platform and test your strategy without risk. Once you feel confident, move to a live account but trade with the smallest possible position size (micro-lots) to experience real market conditions and psychological pressure with minimal capital at stake.


