

A triangle pattern in forex is a consolidation chart formation where price action becomes increasingly compressed between two converging trendlines. It signals a temporary pause in the market before a potential breakout. Understanding this pattern allows traders to anticipate significant price moves. This guide covers how to identify, validate, and trade the three main types of triangles, helping you make informed decisions with your preferred online forex broker. We will explore entry triggers, stop-loss placement, profit targets, and common mistakes to avoid when you encounter a triangle pattern in forex trading.
Key Takeaways
- A triangle pattern in forex represents a period of consolidation with converging trendlines, often preceding a breakout.
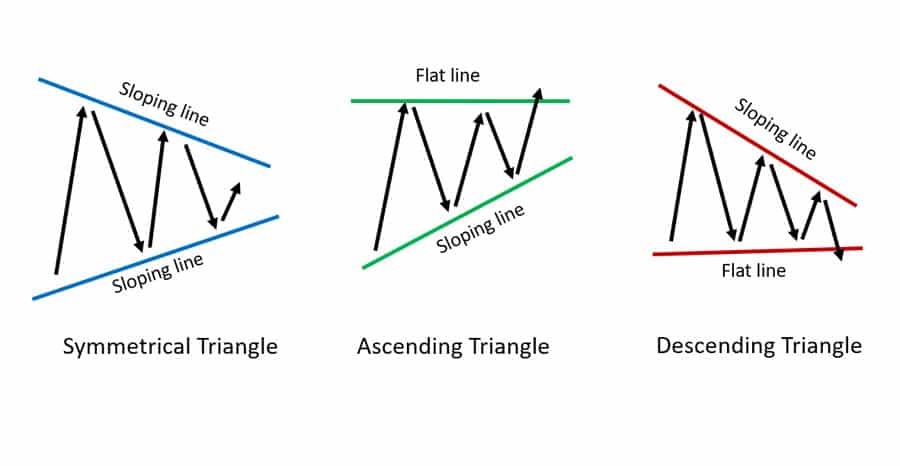
- There are three main types: symmetrical (neutral/continuation), ascending (bullish), and descending (bearish).
- Validation requires at least two touches on each trendline and is strengthened by contracting volume during formation and expanding volume on the breakout.
- Effective trading involves waiting for a confirmed breakout (a candle close outside the pattern), setting a stop-loss just outside the opposite trendline, and projecting a profit target based on the pattern’s height.
- The prior trend is a crucial piece of context, often indicating the most likely direction of the breakout for a symmetrical triangle in forex.
Triangle Pattern in Forex | Quick Recognition Checklist
Spotting a high-probability triangle pattern in forex is a skill built on recognizing a few key characteristics. Before you even think about placing a trade, your eyes should be trained to run through a quick mental checklist. From years of screen time, I can tell you that not all triangles are created equal. A well-formed pattern has a distinct “look” that signals coiled energy, while a sloppy one is often just noise. Here’s what I look for to confirm a valid pattern.
- Two Converging Trendlines: This is the most basic requirement. The pattern must be bounded by two lines that are clearly moving toward each other. The upper trendline connects a series of lower highs, and the lower trendline connects a series of higher lows. If the lines are parallel, it’s a channel, not a triangle. If they are diverging, it’s an expanding pattern, which carries different risks.
- At Least Two Touches Per Line: For a trendline to be considered valid, price must react to it at least twice. So, you need a minimum of four reversal points in total (two on the top line, two on the bottom) to even begin drawing a triangle pattern in forex. In my experience, patterns with three or more touches on each side tend to be far more reliable.
- Contracting Volume and Volatility: As price gets squeezed toward the apex (the point where the trendlines meet), both volume and volatility should ideally decrease. This is a classic sign of market indecision and energy consolidation. It’s like a spring being compressed. When you see volume drying up as the triangle tightens, it adds significant weight to the idea that a powerful move is building up.
- Breakout Before the Apex: A valid breakout typically occurs somewhere between the halfway point and the three-quarters mark of the triangle’s length. If price meanders all the way into the apex, the pattern often loses its predictive power. The compressed energy dissipates, and any subsequent breakout is often weak and unreliable. I generally ignore patterns that reach the apex without a clear break.
Types of Triangle Pattern in Forex
While all triangles share the core concept of consolidation, they come in three distinct variations, each with its own psychological narrative and trading bias. Recognizing which type of triangle pattern in forex you’re looking at is crucial because it helps frame your expectations for the breakout direction. Is the market leaning bullish, bearish, or is it truly neutral? The geometry of the pattern gives you the clues.
Ascending Triangle in Forex
The ascending triangle forex pattern is a distinctly bullish formation. It’s characterized by a flat, horizontal resistance line at the top and a rising support line at the bottom. The story this pattern tells is one of persistent buyers. Each time the price pulls back from the resistance level, the buyers step in at a higher price than before, creating a series of higher lows. This shows diminishing selling pressure and increasing buying urgency.
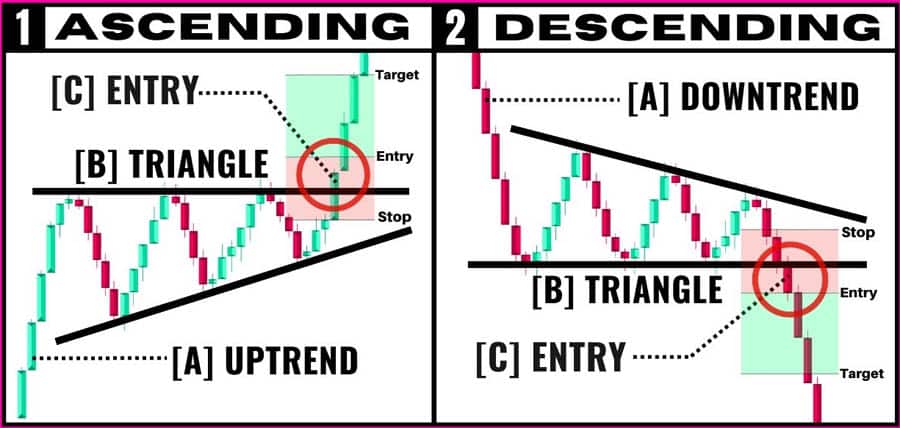
This setup is most powerful when it appears after an established uptrend, acting as a continuation pattern. The flat resistance level represents a supply zone that has held multiple times. The rising trendline shows that demand is getting stronger, relentlessly pushing against that supply. The inevitable conclusion traders are anticipating is a breakout to the upside as the sellers are finally exhausted. A confirmed break above the horizontal resistance, especially on a surge in volume, is the trigger to go long.
Descending Triangle in Forex
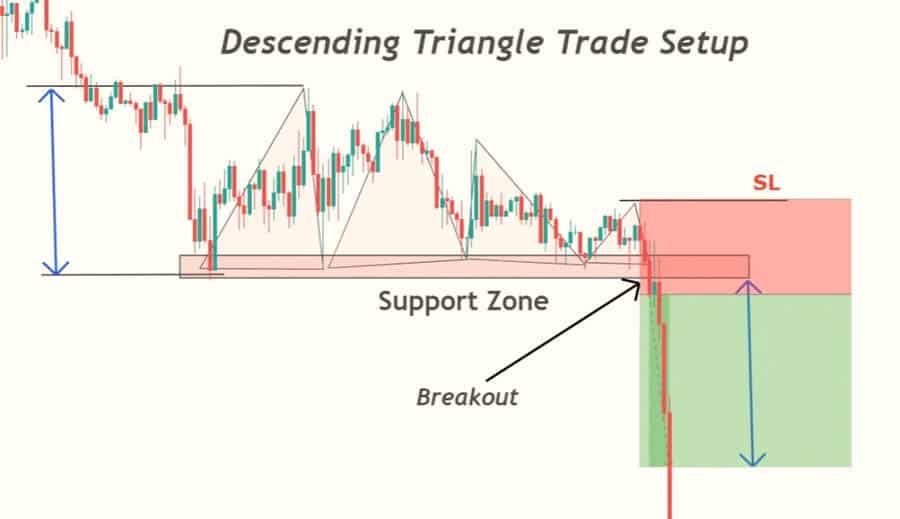
Conversely, the descending triangle forex pattern is the bearish counterpart. It features a flat, horizontal support line at the bottom and a falling resistance line at the top. This structure reveals a market where sellers are becoming progressively more aggressive. Each rally is met with selling pressure at a lower price point, forming a series of lower highs. The horizontal support line is a demand zone that buyers are defending, but the sellers are consistently pushing down on it with increasing force.
This pattern signals that the sellers are in control and are gradually overwhelming the buyers. Like its ascending cousin, the descending triangle is most reliable as a continuation pattern within a pre-existing downtrend. The breakout occurs when the horizontal support level finally gives way. A decisive candle close below this support, ideally accompanied by an expansion in volume, confirms the sellers have won the battle and that the downtrend is likely to resume.
Symmetrical Triangle in Forex
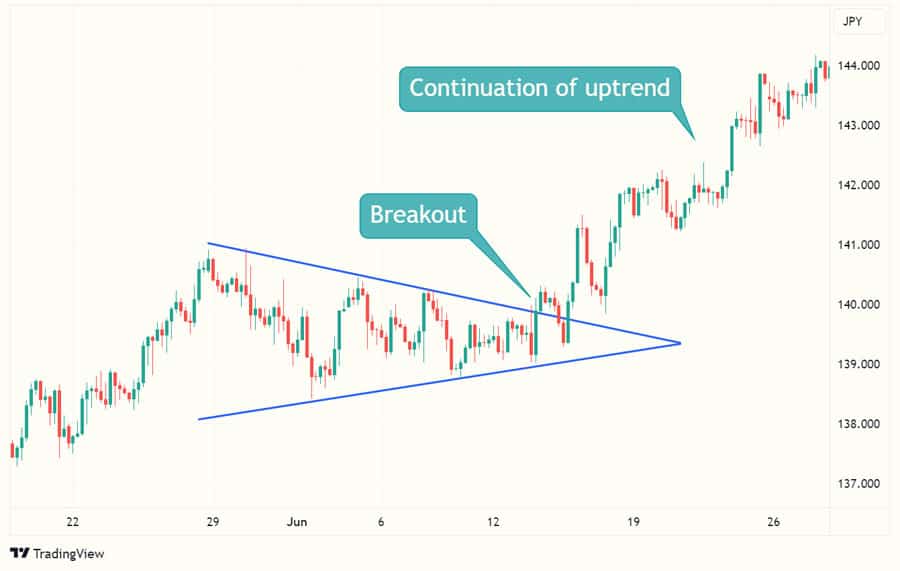
The symmetrical triangle in forex is formed by two converging trendlines of roughly equal slope—one falling (connecting lower highs) and one rising (connecting higher lows). This is the most neutral of the three patterns. It represents a period of pure indecision where neither buyers nor sellers are gaining the upper hand. The price range simply gets tighter and tighter as the market waits for a catalyst.
While technically neutral, the symmetrical triangle in forex often acts as a continuation pattern. This means the breakout is most likely to occur in the direction of the trend that preceded the triangle’s formation. If the market was in a strong uptrend before consolidating, the odds favor an upside breakout. If it was in a downtrend, a downside break is more probable. However, I never assume the direction. I always wait for the market to show its hand with a confirmed breakout before committing to a trade. Because of its neutrality, volume confirmation is absolutely critical when trading a triangle pattern in forex of this type to avoid false moves, or “head fakes.”
Triangle Pattern in Forex Trading | Entry, Stops, and Targets
Identifying a triangle pattern in forex is only the first step; profiting from it requires a clear and disciplined execution plan. A robust trading plan for any pattern should have three core components: a precise entry trigger, a logical stop-loss placement, and a well-defined profit target. Getting these three elements right separates consistent traders from those who rely on guesswork. Over the years, I’ve refined my approach to be systematic, which helps remove emotion and second-guessing from the process.
Entry Strategy
The entry is your trigger, and timing it correctly is crucial to avoid false breakouts. The golden rule is to wait for a decisive close outside the pattern. An aggressive entry might be to trade as soon as the price pierces the trendline, but this is a high-risk approach that often gets you caught in “head fakes.” A much safer method is to wait for a full candle (e.g., a 4-hour or daily candle) to close firmly beyond the trendline. This confirms that momentum is behind the move.
- Breakout Entry: The most common method. You enter a long position on a candle close above the upper trendline or a short position on a close below the lower trendline. The key is to look for an accompanying spike in volume, which acts as a powerful confirmation that institutional money is likely participating in the move.
- Retest Entry: A more conservative and often higher-probability approach. After the initial breakout, price will sometimes return to “retest” the broken trendline, which now acts as support (in an upside breakout) or resistance (in a downside breakdown). Entering on this retest offers a better risk-to-reward ratio, as your entry price is more favorable and your stop-loss can be placed tighter. The downside is that strong breakouts don’t always offer a retest, so you might miss the trade.
Stop-Loss Placement
Your stop-loss is your safety net. Its placement should be logical, not arbitrary. It needs to be far enough away to avoid being triggered by normal market noise but close enough to protect your capital if the trade fails. For a triangle pattern in forex, there are two standard locations:
- Outside the Opposite Trendline: For a long position (breakout above), the stop-loss can be placed just below the lower (rising) trendline. For a short position (breakdown below), it goes just above the upper (falling) trendline. This invalidates the pattern entirely if hit.
- Below/Above the Last Swing Point: A slightly more aggressive placement. For a long trade, you can place the stop just below the last swing low formed inside the triangle before the breakout. For a short trade, it goes just above the last swing high. This tightens the risk but can sometimes be too close to the action. My preference often depends on the volatility of the currency pair.
Take-Profit Target
The classic method for setting a profit target for a triangle pattern in forex is the “measured move” technique. It’s simple, objective, and surprisingly effective.
- Measure the Height: At its widest point (the beginning of the pattern), measure the vertical distance between the upper and lower trendlines.
- Project from the Breakout Point: Take that measured height and project it from the point where the price broke out of the triangle. For an upside breakout, you project upwards. For a downside breakout, you project downwards.
This projected level serves as your primary take-profit target. However, it’s wise to be flexible. I often take partial profits at this level and then trail my stop-loss on the remaining position to capture any further trend continuation. It’s also important to be aware of any major support or resistance levels that might be in the way of your target.
Strategy Playbooks for Each Triangle Pattern
Theory is one thing, but practical application is where trading happens. To successfully trade the triangle pattern in forex, you need a specific playbook for each variation. This means understanding the context, knowing the precise trigger, and having a clear management plan. Here are the step-by-step playbooks I use for each of the three triangle types.
Ascending Triangle Playbook
The ascending triangle forex setup is a personal favorite because of its clear bullish intention. The battle between determined buyers and a fixed supply level creates a very readable scenario.
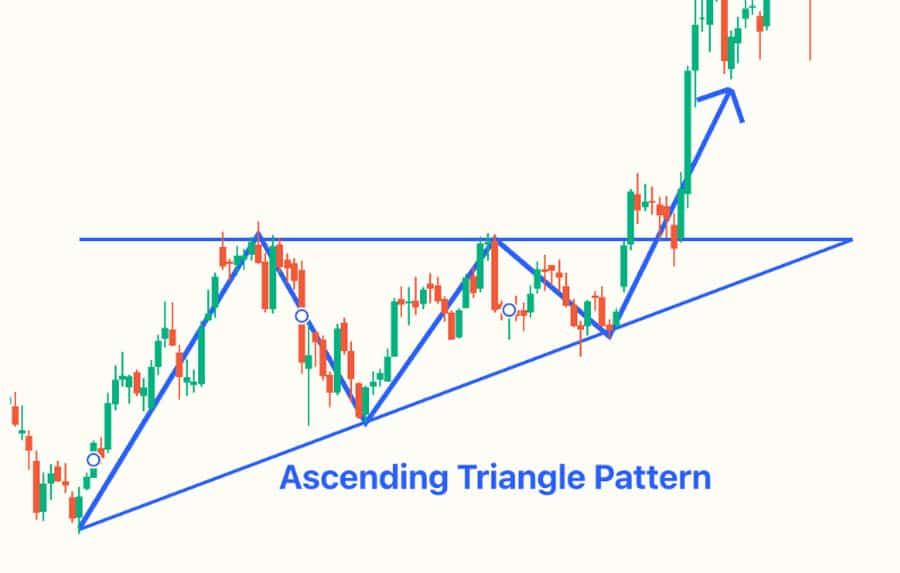
- Context: Look for this pattern within an existing, healthy uptrend. The pattern is a signal that the trend is pausing to gather strength before its next leg up. The cleaner the horizontal resistance (with multiple, near-identical highs), the better.
- Trigger: The primary trigger is a strong candle close above the horizontal resistance line. I want to see a candle with a solid body and minimal wick, indicating conviction. Crucially, I check the volume indicator. A breakout accompanied by a significant spike in volume is an A+ signal. An optional, more conservative trigger is to wait for a retest of the broken resistance level, which should now act as support.
- Management: Place the initial stop-loss just below the rising support trendline or under the most recent swing low within the pattern. The primary profit target is calculated by measuring the height of the triangle and projecting it upward from the breakout point. If the trend is strong, consider taking 50-75% profit at the target and trailing the stop on the remainder to ride the trend.
Descending Triangle Playbook
The descending triangle forex pattern is the mirror image, signaling building bearish pressure. It’s a powerful setup for shorting in a downtrending market.
- Context: This pattern works best when it forms during a clear downtrend. It represents a consolidation phase where sellers are regrouping for another push lower. The horizontal support level should be well-defined, with several touches creating a clear price floor that is under attack.
- Trigger: The signal to enter is a decisive candle close below the horizontal support line. As with the ascending triangle, a surge in volume on the breakdown candle adds a huge amount of confidence to the trade. A pullback to the broken support level (which now becomes new resistance) can offer a second chance to enter with a better risk profile.
- Management: The stop-loss should be placed just above the falling resistance trendline or above the most recent swing high inside the triangle. The profit target is found by projecting the height of the triangle downward from the breakdown point. Be mindful of any major historical support levels below your target.
Symmetrical Triangle Playbook
Trading the symmetrical triangle in forex requires more caution due to its neutral nature. The context of the prior trend is your most important guide here.
- Context: Identify the trend that was in place before the triangle started forming. This gives you a directional bias. If the preceding trend was up, you’re primarily looking for an upside breakout. If it was down, you’re anticipating a downside break. Pay close attention to the contraction in price volatility; the choppiness should visibly decrease as price nears the apex.
- Trigger: Because of the risk of false breakouts, confirmation is everything. Wait for a strong, high-volume candle close outside one of the trendlines. Do not try to guess the direction or enter while the price is still inside the triangle. A breakout against the prevailing trend is possible but is a lower-probability trade and should be approached with more caution or a smaller position size.
- Management: Once a breakout is confirmed, the management rules are the same. For an upside break, place the stop below the lower trendline. For a downside break, place it above the upper trendline. The profit target is still the projected height of the pattern. Because the triangle pattern in forex trading of this type can be tricky, I am often quicker to move my stop to break-even once the trade moves in my favor.
Filtering High-Probability Triangle Trades
Not every chart pattern that looks like a triangle is worth your capital. Over time, experienced traders develop a sense of which setups are pristine and which are problematic. This “filter” is what separates high-probability trading from simply gambling on shapes. Here are the key filters I apply to every potential triangle pattern in forex I consider trading.
- Respect the Higher Timeframe Trend: This is perhaps the most critical filter. A bullish ascending triangle forex pattern on a 1-hour chart is significantly more likely to succeed if the 4-hour and daily charts are also in a clear uptrend. Trading in alignment with the dominant, higher-timeframe trend is like swimming with the current instead of against it. It dramatically reduces the chances of being caught in a false breakout.
- Avoid Late-Stage (Apex) Breakouts: As mentioned earlier, if the price has already moved more than 75% of the way through the triangle toward the apex, the pattern is often exhausted. The coiled energy has dissipated. I’ve learned from experience that breakouts from the tip of the apex are often weak, lack follow-through, and are prone to reversal. The best moves come from breakouts that happen in the middle half of the pattern.
- Demand Volume and Momentum Confirmation: A breakout on weak, anemic volume is a major red flag. It suggests a lack of conviction from larger market participants. I always want to see a clear expansion in volume on the breakout candle itself. This shows that conviction and capital are driving the move. Similarly, the breakout candle should be a strong, decisive one—a Marubozu or a large-bodied candle closing near its high (for a long) or low (for a short).
- Look for Confluence: A triangle pattern in forex becomes exponentially more powerful when it aligns with other technical factors. This is called confluence. For example, does the breakout of an ascending triangle also break a key psychological level like 1.2000? Does the support line of a descending triangle coincide with a 200-period moving average? When a pattern’s breakout point aligns with other significant support or resistance levels, moving averages, or Fibonacci levels, the probability of a successful trade increases substantially.
Common Mistakes and How to Avoid Them
Knowing the theory behind the triangle pattern in forex is easy. Avoiding the common psychological and execution errors in real-time trading is the hard part. Here are the most frequent mistakes I see traders make—and that I’ve made myself—and how you can proactively avoid them.
- Forcing the Pattern: A common error for beginners is seeing triangles everywhere. They connect two random highs and two random lows and call it a pattern. A valid triangle has clean, obvious trendlines with at least two, and preferably three, clear touches on each side. If you have to squint or “force” the lines to fit, the pattern isn’t there. Be patient and wait for the textbook formations.
- Jumping the Gun (Entering Before Confirmation): Excitement and fear of missing out (FOMO) can tempt you to enter a trade before the breakout is confirmed. You might see the price poke through the trendline and immediately jump in, only to see it snap back inside the pattern, stopping you out. Solution: Institute a strict rule to always wait for a candle to *close* outside the pattern. This single piece of discipline will save you from countless false breakouts.
- Ignoring the Prior Trend: This is particularly dangerous with a symmetrical triangle in forex. Traders often treat it as a 50/50 proposition, but it’s not. The preceding trend provides a strong directional bias. Always assume the pattern is one of continuation until the price proves otherwise with a decisive break in the opposite direction. Fighting the underlying trend is a low-probability endeavor.
- Placing Stops Too Tight: Placing your stop-loss just inside the triangle or a few pips outside the breakout line is a recipe for getting stopped out by random market noise. The area around breakout points is often volatile. Solution: Give your trade room to breathe. Place your stop logically on the other side of the pattern—below the last major swing low for a long, or above the last major swing high for a short. This ensures your trade is only stopped out if the entire pattern’s structure fails.
Risk and Trade Management with Triangle Patterns
Even the best-looking triangle pattern in forex can fail. Professional trading is not about being right every time; it’s about managing risk so that your winning trades are significantly larger than your losing trades. Solid risk and trade management are what ensure your long-term survival and profitability.
- Position Sizing: Never risk more than a small, predefined percentage of your account on a single trade (1-2% is standard). Your position size should be calculated based on the distance from your entry point to your stop-loss. A wider stop requires a smaller position size, and a tighter stop allows for a larger one, but the dollar amount at risk should remain the same. This consistency is paramount.
- Scaling Out and Trailing Stops: You don’t have to exit your entire position at the initial target. A powerful strategy is to take partial profits (e.g., 50%) when the price hits the measured move target. At that point, move your stop-loss to your entry price (break-even). This locks in profit and creates a “risk-free” trade on the remaining portion, which you can let run with a trailing stop-loss (e.g., under each new higher low in an uptrend) to capture a larger move if the trend continues.
- Handling Failed Breakouts: What happens if the price breaks out, you enter, and then it quickly reverses and closes back inside the triangle? This is a failed breakout and a sign that your trade thesis is likely wrong. The disciplined approach is to exit the trade immediately for a small loss or at break-even. Don’t “hope” it will turn around. A failed breakout is a clear signal to get out and reassess. You can always re-enter if a new, valid breakout occurs later.
Backtesting and Performance Tracking
You should never trade any strategy, including the triangle pattern in forex, with real money until you have proven its effectiveness for yourself. This is where backtesting and forward-testing come in. It’s the process of going through historical chart data to see how a specific set of rules would have performed.
First, define your rules with absolute clarity:
- Pattern Definition: How many touches are required? What is the maximum angle of convergence?
- Entry Trigger: What constitutes a “confirmed” breakout close? Is there a volume filter?
– Stop-Loss Rule: Exactly where does the stop go? (e.g., 10 pips below the swing low).
- Target Rule: Is it always the measured move, or do you use a fixed risk-reward ratio?
- Filters: Do you only trade during certain market sessions? Do you avoid trading before major news events?
Once you have these rules, go back in time on your charts and simulate every trade you would have taken. Track the results in a spreadsheet. Key metrics to monitor include your win rate, average risk-to-reward ratio (R-multiple), and overall expectancy. This data will tell you if your triangle pattern in forex trading strategy has a positive edge. After successful backtesting, forward-test the strategy on a demo account for a month or two to ensure you can execute it effectively in a live market environment.
Triangle vs Wedge vs Expanding Triangle
It’s easy to confuse triangles with similar consolidation patterns like wedges and expanding triangles. Knowing the difference is important, as they have different implications.
- Triangles: As we’ve discussed, they have one ascending and one descending trendline (symmetrical), or one flat and one sloped line (ascending/descending). They signal a contraction in volatility before a breakout.
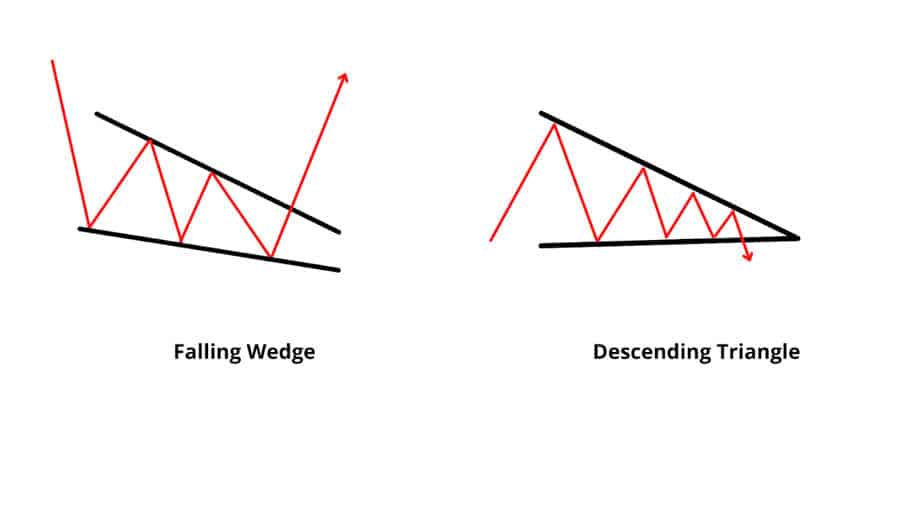
- Wedges: Wedges are similar but have two trendlines that are both sloped in the same direction—either both pointing up (a rising wedge, which is bearish) or both pointing down (a falling wedge, which is bullish). They are often considered reversal patterns.
- Expanding Triangles (Broadening Formations): These are the opposite of a standard triangle pattern in forex. The trendlines diverge from each other, indicating increasing volatility and market uncertainty. They are notoriously difficult to trade due to the wide price swings and are often best avoided by newer traders.
For clarity and reliability, the classical triangles (ascending, descending, symmetrical) offer the clearest risk and target parameters, making them a staple for technical traders.
Trade with Opofinance
Unlock your trading potential with Opofinance, a globally recognized and ASIC-regulated broker. Benefit from our comprehensive suite of tools and secure trading environment.
- Advanced Platforms: Access MT4, MT5, cTrader, and the exclusive OpoTrade platform.
- Innovative AI Tools: Leverage our AI Market Analyzer, AI Coach, and 24/7 AI Support for smarter trading decisions.
- Diverse Opportunities: Explore Social Trading and Prop Trading to expand your strategies.
- Secure & Flexible Transactions: Enjoy safe and convenient deposits and withdrawals, including crypto payments with zero fees.
Start Trading with Opofinance Today
Conclusion
Mastering the triangle pattern in forex is a valuable addition to any technical trader’s toolkit. It provides a clear visual representation of market consolidation and helps you anticipate high-probability breakouts. By learning to differentiate between ascending, descending, and symmetrical triangles, and by applying a disciplined approach to entries, exits, and risk management, you can effectively capitalize on these common formations. Remember, the key is not just identifying the triangle pattern in forex, but trading it with a confirmed, rule-based plan.
Which timeframe is best for trading triangle patterns?
Triangle patterns appear on all timeframes, but they are generally more reliable on higher timeframes like the 4-hour, daily, and weekly charts. These patterns take longer to form, involve more participants, and are less susceptible to short-term market noise, leading to more dependable breakouts.
Can a triangle pattern fail?
Absolutely. No chart pattern is 100% accurate. A triangle can fail through a “false breakout,” where the price breaks out momentarily before reversing back inside the pattern. This is why using a stop-loss and waiting for a confirmed candle close are critical components of risk management.
How is a triangle different from a pennant?
A triangle is a standalone consolidation pattern, while a pennant is a specific type of short-term triangle that forms after a very sharp, near-vertical price move known as the “pole.” Pennants are always considered continuation patterns, whereas triangles can sometimes lead to reversals.
Should I trade a breakout against the main trend?
While possible, trading a triangle breakout against the dominant, higher-timeframe trend is a lower-probability setup. These counter-trend moves often have less follow-through. It is generally safer and more profitable to trade breakouts that are in alignment with the prevailing market direction.
What if volume doesn’t increase on the breakout?
A breakout on low or decreasing volume is a significant warning sign. It suggests a lack of conviction behind the move and increases the risk of a false breakout. While not every low-volume breakout fails, it’s a reason to be extra cautious, perhaps by waiting for further confirmation or taking a smaller position size.
Notes
Meta Title: Triangle Pattern in Forex: 3 Setups for Trading Breakouts
Meta Description: Learn to identify and trade the triangle pattern in forex. This guide covers ascending, descending, and symmetrical triangles with entry, stop, and target strategies.
Slug: triangle-pattern-in-forex-trading-guide
References:


