Imagine predicting a market reversal with pinpoint accuracy, turning potential losses into substantial profits. In the ever-evolving landscape of financial trading, mastering candlestick patterns is akin to possessing a trader’s sixth sense. Among these patterns, the Tweezer Bottom Candlestick Pattern stands out as a potent tool for identifying bullish reversals with remarkable precision. Whether you’re engaging with a regulated forex broker or navigating the complexities of stock markets, understanding this pattern can significantly enhance your trading decisions and profitability. This comprehensive guide delves deep into the Tweezer Bottom Candlestick Pattern Meaning, explores effective Tweezer Bottom Candlestick Pattern Trading Strategies, and analyzes real-life Tweezer Bottom Candlestick Pattern Examples. Equip yourself with expert insights, leverage advanced techniques, and elevate your trading game to unprecedented heights.

What is the Tweezer Bottom Candlestick Pattern?

Understand the Tweezer Bottom pattern and learn to spot bullish reversals with ease.
Definition and Description
The Tweezer Bottom Candlestick Pattern is a bullish reversal indicator that signals a potential shift from a downtrend to an uptrend. This pattern comprises two or more consecutive candles with matching or nearly matching lows, indicating that selling pressure is diminishing and buyers are beginning to take control. Traders view this pattern as a reliable signal to consider entering long positions, anticipating a price increase. By recognizing this pattern, traders can anticipate market reversals and make informed trading decisions that align with the emerging bullish trend.
Read More: Spinning Top Candlestick Pattern
Visual Characteristics of the Pattern
Visually, the Tweezer Bottom pattern is characterized by:
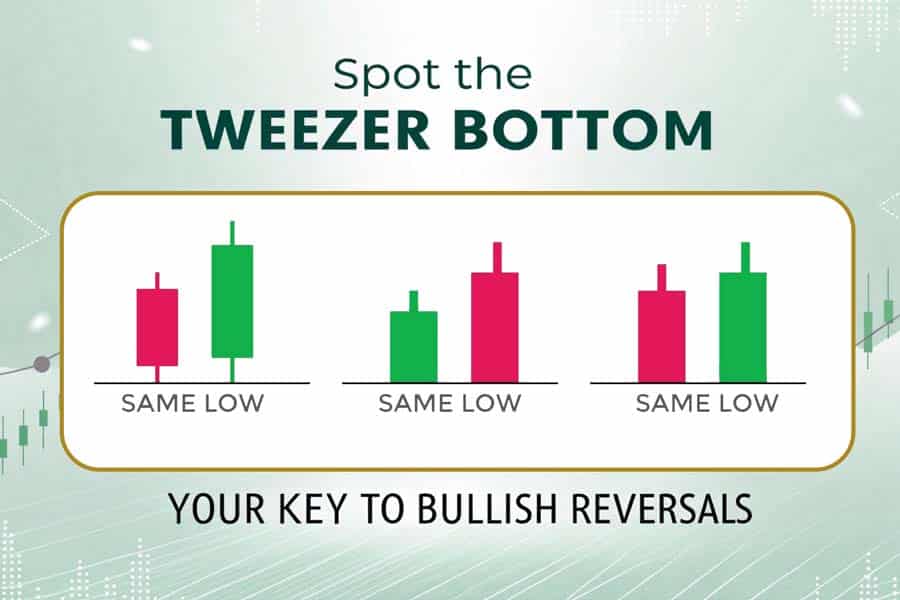
- Two Consecutive Candles: Both candles have similar or identical lows, forming a “tweezer” effect that highlights the balance between buyers and sellers.
- Opposite Wicks: The candles may feature different wicks, indicating varying levels of buying and selling pressure.
- Bullish Confirmation: The second candle often closes higher than the first, reinforcing the reversal signal.
- Location at Support Levels: Typically forms at significant support levels where the price has previously reversed, adding to the pattern’s reliability.
Identifying these visual cues is essential for timely and effective trading decisions.
Understanding the Formation

Discover the key conditions behind the Tweezer Bottom formation and its bullish signals.
Conditions Leading to the Formation of Tweezer Bottoms
The formation of Tweezer Bottoms is influenced by specific market conditions:
- Extended Downtrend: The market has been in a prolonged bearish phase, exhausting selling momentum and setting the stage for a potential reversal.
- Decreasing Volume: A decline in trading volume suggests weakening selling pressure and potential accumulation by buyers, signaling a shift in market sentiment.
- Consolidation Period: Prices stabilize after a significant drop, reflecting indecision among traders about the next move and creating an opportunity for a reversal.
- Support Level Interaction: The pattern often forms near established support levels, where the price has previously found buying interest, increasing the likelihood of a successful reversal.
Market Psychology Behind the Pattern
The Tweezer Bottom pattern encapsulates a critical shift in market sentiment. Initially, sellers dominate, driving prices downward with conviction. However, as the pattern forms, buyers start to gain confidence, sensing that the selling pressure is waning. This psychological battle between bearish and bullish forces creates a balance, leading to the formation of matching lows. The subsequent bullish candle signifies that buyers are stepping in, potentially reversing the trend and pushing prices higher. Grasping the psychological dynamics enhances the interpretation and reliability of the pattern.
Components of Tweezer Bottom Candlestick Pattern

Break down the Tweezer Bottom Pattern and understand its essential components for accurate trading.
Detailed Explanation of Each Candlestick Involved
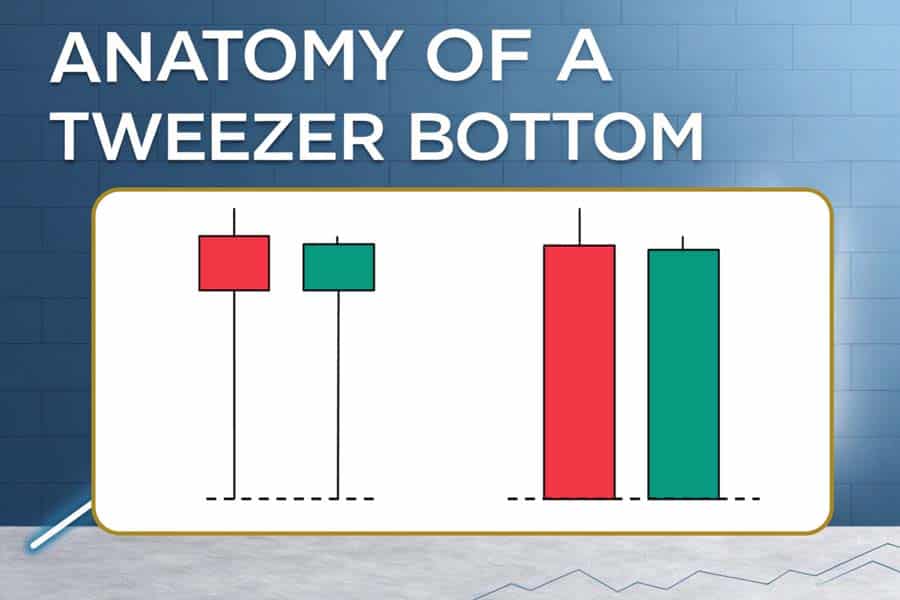
- First Candle:
- Bearish Body: Indicates strong selling pressure with a long body, setting the initial tone for the pattern.
- Lower Shadow: May have a small or no lower shadow, establishing the initial low of the pattern.
- Significance: Establishes the bearish momentum and sets the stage for a potential reversal by highlighting the sellers’ exhaustion.
- Second Candle:
- Bullish Body: Shows buying interest, with the candle closing higher than the first, signaling a shift in momentum.
- Matching Low: The low of the second candle aligns closely with the first, indicating that sellers couldn’t push the price significantly lower.
- Bullish Confirmation: The higher close compared to the first candle reinforces the reversal signal, providing traders with confidence to act.
Understanding these components is crucial for accurate pattern identification and trading decisions.
Comparison with Similar Candlestick Patterns
While the Tweezer Bottom shares similarities with other reversal patterns like the Hammer or Bullish Engulfing, it remains distinct due to specific characteristics:
- Hammer Pattern: Features a single candle with a small body and long lower shadow, typically signaling a reversal. Unlike the Tweezer Bottom, it doesn’t require a matching low.
- Bullish Engulfing: Involves two candles where the second completely engulfs the first, indicating a strong reversal. The Tweezer Bottom focuses on matching lows rather than engulfing bodies.
- Tweezer Bottom: Differentiates itself with two consecutive candles having matching lows, emphasizing the balance between buyers and sellers.
Differentiating between these patterns ensures accurate trading signals and reduces the risk of misinterpretation.
Interpreting the Tweezer Bottom Pattern
What the Pattern Indicates About Market Trends
The Tweezer Bottom Candlestick Pattern is a powerful indicator that suggests a potential reversal from a bearish to a bullish trend. When this pattern forms, it signifies that the downtrend may be losing momentum, and buyers are starting to gain control. This shift in momentum can lead to an upward price movement, presenting lucrative trading opportunities for those who recognize and act upon the signal promptly. Understanding this indication allows traders to position themselves advantageously in the market.
Read More: Tweezer Top Candlestick Pattern
Bullish Reversal Signals
Several key signals reinforce the bullish reversal indicated by the Tweezer Bottom pattern:
- Confirmation on the Next Candle: A strong bullish candle following the Tweezer Bottom pattern enhances the reliability of the reversal signal, providing clear evidence of buyer dominance.
- Increased Volume: Higher trading volumes during the formation suggest strong buyer interest and commitment, validating the reversal signal.
- Breakout Above Resistance: Price moving above previous resistance levels after the pattern confirms the upward trend, signaling a robust bullish movement.
- Support Level Holding: The pattern’s formation near a significant support level increases the likelihood of a successful reversal, as the support acts as a foundation for the upward move.
These signals provide traders with the confidence to make informed and strategic trading decisions.
Trading Strategies Using Tweezer Bottom

Learn how to use the Tweezer Bottom Pattern for strategic entries and profitable exits.
Entry and Exit Points
Implementing effective Tweezer Bottom Candlestick Pattern Trading Strategies involves precise identification of entry and exit points:
- Entry Point: Enter a long position at the close of the second candle or when the price breaks above the high of the second candle. This ensures that the reversal signal is confirmed before committing to the trade.
- Exit Point: Set a target based on recent resistance levels or use a predetermined risk-reward ratio (e.g., 1:2 or 1:3). Alternatively, exit when a reversal signal appears, such as a bearish candlestick pattern or when the price approaches the next significant resistance level.
Strategic entry and exit points are essential for maximizing profits and minimizing losses.
Risk Management Techniques
Effective risk management is vital to protect trading capital and maximize profits:
- Stop-Loss Orders: Place stop-loss orders below the pattern’s low to limit potential losses if the trade doesn’t go as expected. This ensures that losses are contained within a manageable range.
- Position Sizing: Allocate only a small percentage of your trading capital to each trade (e.g., 1-2%) to manage risk effectively and prevent significant losses from any single trade.
- Diversification: Spread investments across different assets or markets to reduce the impact of adverse movements in any single position.
Implementing robust risk management techniques safeguards your trading portfolio against unexpected market movements.
Combining with Other Indicators for Confirmation
Enhance the reliability of the Tweezer Bottom pattern by integrating additional technical indicators:
- Relative Strength Index (RSI): Confirms overbought or oversold conditions, providing additional context to the reversal signal.
- Moving Averages (MA): Identifies trend direction and potential support levels, helping to confirm the bullish trend.
- MACD (Moving Average Convergence Divergence): Signals momentum shifts in the market, validating the strength of the reversal.
- Volume Indicators: Assess the strength of the move by analyzing trading volumes, ensuring that the reversal is supported by significant buying activity.
Combining these indicators creates a robust trading strategy, increasing the probability of successful trades.
Examples of Tweezer Bottom in Action
Real-Life Chart Examples
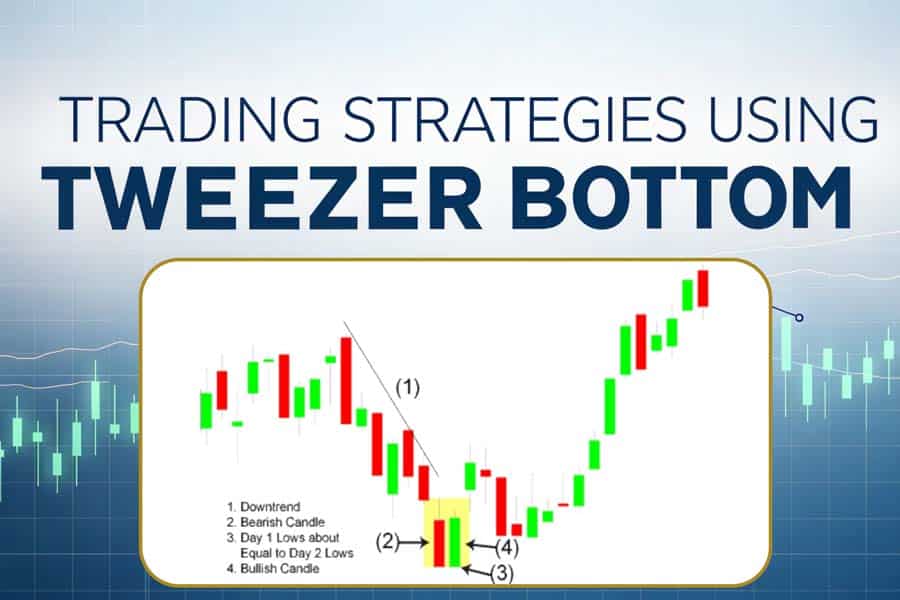
Consider a scenario where a stock has been in a steady decline for several weeks, consistently testing a support level without breaking it. Suddenly, two consecutive days show similar lows with the second day closing higher than the first, forming a Tweezer Bottom pattern. This formation suggests that buyers are stepping in, overcoming the previous selling pressure, and signaling a potential reversal.
This real-life chart example illustrates the formation and significance of the Tweezer Bottom pattern in signaling a bullish reversal.
Step-by-Step Analysis of Trades Based on the Pattern
- Identify the Downtrend: Recognize the extended bearish movement and the presence of a strong support level.
- Spot the Tweezer Bottom: Look for two consecutive candles with matching lows, where the second candle closes higher.
- Confirm with Indicators: Use RSI to check for oversold conditions and MACD to assess momentum shifts.
- Execute the Trade: Enter a long position as the price breaks above the high of the second candle, confirming the reversal.
- Set Stop-Loss Orders: Place stop-loss orders below the pattern’s low to protect against unexpected reversals.
- Monitor and Manage the Trade: Track the trade’s progress, adjust stop-loss levels as necessary, and exit based on target levels or reversal signals.
Following this step-by-step approach can lead to profitable trades by systematically leveraging the Tweezer Bottom pattern.
Advantages and Limitations
Benefits of Using the Tweezer Bottom Pattern in Trading
- High Accuracy: When confirmed with additional indicators, the pattern has a high probability of indicating a successful reversal, making it a valuable tool for traders.
- Versatility: Applicable across various markets and timeframes, including stocks, forex, commodities, and cryptocurrencies, allowing traders to utilize the pattern in multiple trading environments.
- Clarity: Clear visual cues make it easier to identify compared to other complex patterns, facilitating quicker decision-making.
- Psychological Insight: Reflects the balance between buyers and sellers, providing deeper market sentiment understanding and enhancing trading strategies.
- Complementary: Can be effectively combined with other technical analysis tools to enhance trading strategies, offering a comprehensive approach to market analysis.
Potential Pitfalls and How to Avoid Them
- False Signals: Market volatility can sometimes trigger false reversals, leading to incorrect trading decisions.
- Solution: Use additional indicators and confirmation signals to validate the pattern before acting.
- Overreliance: Relying solely on the Tweezer Bottom pattern without incorporating other analysis tools can increase the risk of losses.
- Solution: Integrate the pattern within a broader trading strategy that includes multiple indicators and risk management techniques.
- Misinterpretation: Incorrectly identifying the pattern may result in poor trading decisions and financial losses.
- Solution: Ensure thorough understanding and practice in pattern recognition, possibly using demo accounts to hone skills before trading with real capital.
Awareness and mitigation of these limitations ensure more effective and reliable use of the Tweezer Bottom pattern in trading.
Common Mistakes to Avoid
Misidentifying the Pattern
One of the most common mistakes traders make is misidentifying the Tweezer Bottom pattern. Ensuring that both candles have matching lows and that the second candle closes higher is crucial. Misinterpreting similar patterns, such as the Hammer or Bullish Engulfing, can lead to incorrect trading signals and potential losses.
Accurate pattern identification is foundational to successful trading based on the Tweezer Bottom pattern.
Overreliance on the Pattern Without Confirmation
Another prevalent mistake is relying solely on the Tweezer Bottom pattern without seeking additional confirmation from other indicators. Market conditions can be influenced by various factors, and a single pattern may not always provide a complete picture.
To enhance trading accuracy, always use additional indicators like RSI, MACD, or Moving Averages to confirm the reversal signal before executing trades.
Ignoring Market Context
Trading the Tweezer Bottom pattern without considering the broader market context, such as overall trend direction or significant news events, can result in misguided trading decisions.
Incorporate an analysis of the overall market environment and be aware of macroeconomic factors that might influence price movements alongside pattern recognition.
Avoiding these common mistakes enhances the effectiveness and reliability of trading strategies based on the Tweezer Bottom pattern.
Pro Tips for Advanced Traders
Elevate your trading strategy with these advanced Pro Tips when using the Tweezer Bottom Candlestick Pattern:
- Combine with Trend Analysis: Utilize trend lines or moving averages to align trades with the overall market direction, increasing the likelihood of successful reversals.
- Monitor Volume: Pay attention to trading volumes during the formation of the pattern. Higher volume during the second candle formation indicates stronger buyer interest and enhances the pattern’s reliability.
- Diversify Indicators: Incorporate multiple technical indicators, such as Fibonacci retracements or Bollinger Bands, to identify optimal entry and exit points and confirm the pattern.
- Backtest Strategies: Test the Tweezer Bottom pattern on historical data to evaluate its effectiveness across different market conditions and refine your trading approach accordingly.
- Stay Updated with Market News: Economic events, earnings reports, and geopolitical developments can influence market sentiment and impact the pattern’s reliability. Stay informed to anticipate potential market movements.
- Implement Partial Profit-Taking: Lock in profits by taking partial positions as the trade moves in your favor. This strategy helps in securing gains while allowing the remaining position to capture further upward movement.
- Use Advanced Order Types: Leverage advanced order types like trailing stops or OCO (One Cancels the Other) orders to automate your trading strategy and manage trades more effectively.
- Analyze Multiple Timeframes: Examine the Tweezer Bottom pattern across different timeframes (e.g., daily, weekly, monthly) to gain a comprehensive understanding of its significance and strength.
- Psychological Preparedness: Cultivate discipline and emotional control to avoid impulsive decisions, ensuring that trades based on the Tweezer Bottom pattern are executed with precision.
- Continuous Learning: Engage in ongoing education through webinars, courses, and trading communities to stay abreast of the latest strategies and refinements related to the Tweezer Bottom pattern.
Incorporating these advanced strategies can significantly enhance your trading performance and maximize the benefits of the Tweezer Bottom Candlestick Pattern.
Opofinance Services: Your Trusted ASIC Regulated Broker
When it comes to executing trades based on the Tweezer Bottom Candlestick Pattern, partnering with a reliable broker is paramount. Opofinance, an ASIC regulated forex broker, offers unparalleled services designed to optimize your trading experience:
- Social Trading Service:
- Connect with a vibrant community of experienced traders.
- Share and discover effective trading strategies.
- Learn from real-time trading insights and collaborative analysis.
- Featured on MT5 Brokers List:
- Access to the advanced MetaTrader 5 platform, renowned for its robust trading tools and user-friendly interface.
- Benefit from high-speed execution, customizable charts, and comprehensive analytical capabilities.
- Safe and Convenient Deposits and Withdrawals:
- Multiple secure payment methods, including bank transfers, credit/debit cards, and e-wallets.
- Fast and reliable processing to ensure your funds are available when you need them.
- Enhanced security measures to protect your financial transactions and personal information.

Choose Opofinance for a seamless, secure, and supportive trading journey, enabling you to make the most of trading opportunities like the Tweezer Bottom Candlestick Pattern.
Ready to elevate your trading? Join Opofinance today!
Conclusion
The Tweezer Bottom Candlestick Pattern is a potent tool in the arsenal of any trader, offering valuable insights into potential bullish reversals. By understanding its formation, interpreting its signals, and implementing robust trading strategies, traders can enhance their decision-making process and improve their profitability. However, it’s essential to complement the pattern with additional technical indicators and adhere to sound risk management principles to maximize its effectiveness and mitigate potential risks. Whether you’re a novice trader or an experienced market participant, mastering the Tweezer Bottom pattern can significantly contribute to your trading success. Embrace this pattern, refine your strategies, and navigate the markets with confidence and precision.
Key Takeaways
- Accurate Recognition: Master the identification of the Tweezer Bottom pattern with its distinctive matching lows and bullish confirmation.
- Comprehensive Confirmation: Utilize additional indicators like RSI, MACD, and Moving Averages to validate the reversal signal and enhance trade reliability.
- Strategic Entry and Exit: Implement well-defined entry and exit points, supported by effective risk management techniques such as stop-loss orders and position sizing.
- Informed Broker Choice: Partner with a regulated broker like Opofinance to ensure a secure and optimized trading experience.
- Continuous Improvement: Engage in ongoing learning and practice to refine your trading strategies, adapt to market changes, and maintain a competitive edge.
Mastering the Tweezer Bottom Candlestick Pattern empowers you to navigate market reversals with confidence and precision, paving the way for sustained trading success.
How does the Tweezer Bottom pattern differ across different timeframes?
The Tweezer Bottom Candlestick Pattern can exhibit variations across different timeframes, each offering unique insights:
Short-Term Timeframes (e.g., 15-minute, hourly charts):
Often used by day traders and scalpers.
Signals quicker reversals and short-term trading opportunities.
Requires swift decision-making and tighter risk management.
Medium-Term Timeframes (e.g., 4-hour, daily charts):
Suitable for swing traders.
Provides a balance between short-term fluctuations and long-term trends.
Allows for more significant price movements and potentially higher profits.
Long-Term Timeframes (e.g., weekly, monthly charts):
Ideal for position traders and investors.
Indicates major trend reversals with substantial market impact.
Requires patience and a longer holding period to realize gains.
Understanding how the pattern behaves across various timeframes enables traders to align their strategies with their trading styles and objectives.
Can the Tweezer Bottom pattern be effectively used in algorithmic trading?
Yes, the Tweezer Bottom Candlestick Pattern can be effectively integrated into algorithmic trading systems. Here’s how:
Pattern Recognition Algorithms: Develop algorithms that can accurately identify the Tweezer Bottom pattern based on specific criteria such as matching lows and bullish confirmation.
Automated Entry and Exit: Program the algorithm to execute trades automatically when the pattern is detected, ensuring timely and emotion-free trading decisions.
Backtesting and Optimization: Use historical data to backtest the algorithm’s performance, refining parameters to enhance accuracy and profitability.
Integration with Other Indicators: Incorporate additional technical indicators within the algorithm to provide comprehensive confirmation and reduce false signals.
Risk Management Rules: Embed risk management protocols, such as stop-loss orders and position sizing, to protect against potential losses and optimize risk-reward ratios.
By incorporating the Tweezer Bottom pattern into algorithmic trading strategies, traders can leverage automation to capitalize on market opportunities efficiently and effectively.
What role does market volatility play in the effectiveness of the Tweezer Bottom pattern?
Market volatility significantly influences the effectiveness of the Tweezer Bottom Candlestick Pattern:
High Volatility:
Can lead to frequent false signals as price swings may create matching lows without genuine reversals.
Requires stricter confirmation from additional indicators to validate the pattern.
Traders should exercise caution and consider wider stop-loss levels to account for increased price fluctuations.
Low Volatility:
Enhances the reliability of the Tweezer Bottom pattern, as price movements are more controlled and less prone to abrupt reversals.
Easier to identify genuine reversal signals with fewer false positives.
Suitable for traders seeking more predictable and stable trading opportunities.
Understanding the impact of market volatility on the pattern’s effectiveness allows traders to adjust their strategies accordingly, optimizing their approach based on prevailing market conditions.


