

Volume Spread Analysis (VSA) is a powerful methodology that helps traders understand the relationship between price, spread (the bar’s range), and volume to predict market direction. It’s about decoding the story behind the charts—a story of supply and demand driven by professional traders, or “smart money.” By mastering VSA, you can learn to read the market’s true intentions, a skill that is invaluable whether you are trading with a leading online forex broker or in other markets. This guide will explore everything from the core principles of VSA to building a robust VSA trading system, offering a clear path to interpreting the actions of institutional players.

Key Takeaways
- Decode Smart Money: Volume Spread Analysis is primarily used to track the activities of professional or institutional traders by analyzing volume, the price spread, and the closing price.
- Three Core Laws: VSA is built on Richard Wyckoff’s three fundamental laws: the Law of Supply and Demand, the Law of Cause and Effect, and the Law of Effort vs. Result.
- Market Phases are Key: Understanding the four market phases—Accumulation, Mark-Up, Distribution, and Mark-Down—is crucial for applying a VSA trading strategy effectively.
- Actionable Signals: VSA provides specific trading signals like “No Demand,” “No Supply,” “Stopping Volume,” and “Upthrusts” that indicate potential market turning points.
- Systematic Approach: A successful VSA trading system requires more than just signal recognition; it involves a disciplined workflow, proper risk management, and continuous backtesting.
- Universal Application: While its roots are in the stock market, Volume Spread Analysis is adaptable to forex, commodities, and cryptocurrency markets on various timeframes.
What is Volume Spread Analysis?
Volume Spread Analysis (VSA) is a unique method of market analysis that seeks to establish the cause of price movements. The “cause” is the imbalance between supply and demand in the market, which is created by the activity of professional traders (the “smart money”). VSA examines the interplay of three key variables on a price chart: the amount of volume on a price bar, the price spread or range of that bar (from high to low), and the closing price.
By understanding this relationship, traders can anticipate future price direction with greater accuracy. It’s less about complex indicators and more about reading the market’s narrative, bar by bar. This approach helps traders see when a market is being accumulated (bought) or distributed (sold) by institutional players, giving them an edge over those who rely solely on conventional technical analysis.
The History and Evolution of VSA
The origins of Volume Spread Analysis trace back to Richard D. Wyckoff, a legendary trader and market analyst from the early 20th century. Wyckoff developed a method based on observing the activities of top market operators. He was the first to detail the concepts of accumulation and distribution and the importance of volume in confirming price trends. His work laid the foundation for VSA.
Decades later, Tom Williams, a former professional syndicate trader, refined Wyckoff’s principles. Williams was the first to use a computer to analyze these relationships, coining the term “Volume Spread Analysis.” He authored “Master the Markets,” the definitive book on the subject, which brought VSA to a modern audience and cemented its status as a critical tool for understanding market dynamics.
VSA Explained: The Core Components
At its heart, Volume Spread Analysis is about linking the actions of professional money to the patterns you see on a chart. It operates on the premise that the “smart money”—market makers, institutions, and large financial players—leave clues in the volume data. By learning to spot these clues, a retail trader can align their trades with the dominant market force instead of trading against it. This is the fundamental advantage of VSA over classic technical analysis, which often relies on lagging indicators that only report what has already happened. VSA, in contrast, is a leading indicator of future price action.
The Three Pillars of VSA
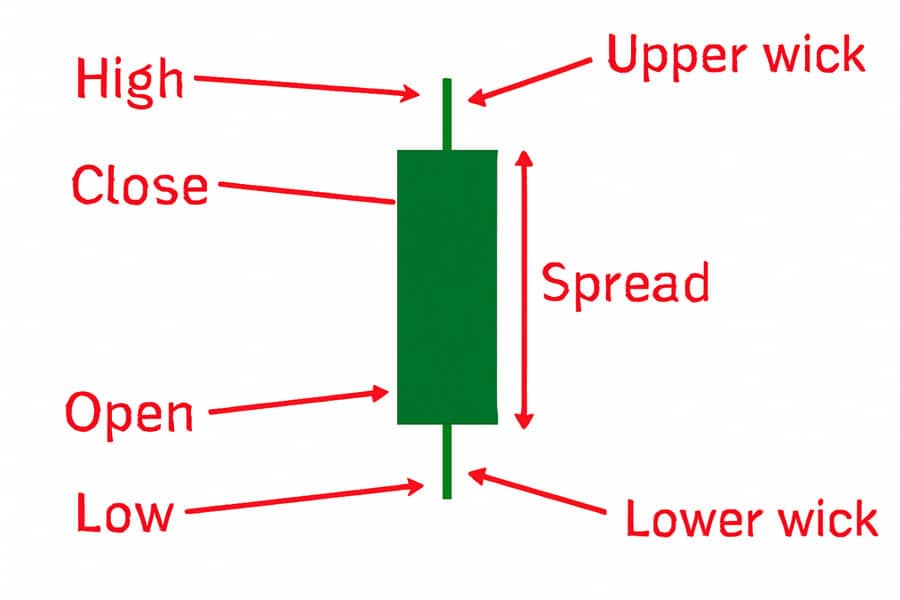
To properly apply VSA, one must focus on three essential variables for each price bar:
- Volume: This represents the total activity or number of shares/contracts traded during that period. High volume indicates strong interest from professional money, while low volume signals their absence.
- Spread (or Range): This is the distance between the high and low of the price bar. A wide spread shows significant price movement, while a narrow spread indicates little movement. The meaning of the spread is always interpreted in the context of its associated volume.
- Closing Price: The location of the closing price relative to the spread is a critical piece of the puzzle. It tells you who won the battle for that session—the buyers or the sellers. A close near the high suggests strength, while a close near the low indicates weakness.
Smart Money vs. Weak Holders
VSA categorizes market participants into two groups: “Smart Money” and “Weak Holders.” Smart money refers to institutional traders, hedge funds, and other large-volume players who have the capital and knowledge to move markets. “Weak Holders” are typically the uninformed retail public who often trade based on emotion, news headlines, or lagging indicators. The goal of smart money is to accumulate assets at a low price from weak holders and then distribute them at a high price back to the same group. VSA is the tool that helps you identify which side of this transaction you are on.
Read More: how to use bollinger bands in forex trading
The Foundational Principles of VSA
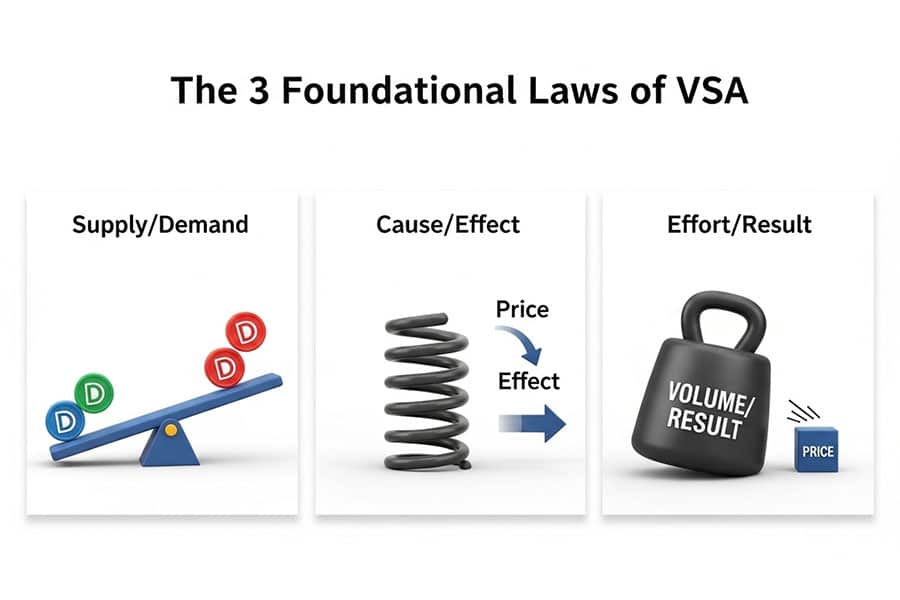
The entire framework of Volume Spread Analysis rests on three universal laws first articulated by Richard Wyckoff. These laws are not arbitrary rules but fundamental principles that govern all financial markets. Understanding them is essential for correctly interpreting VSA signals and developing a sound VSA trading strategy.
1. The Law of Supply and Demand
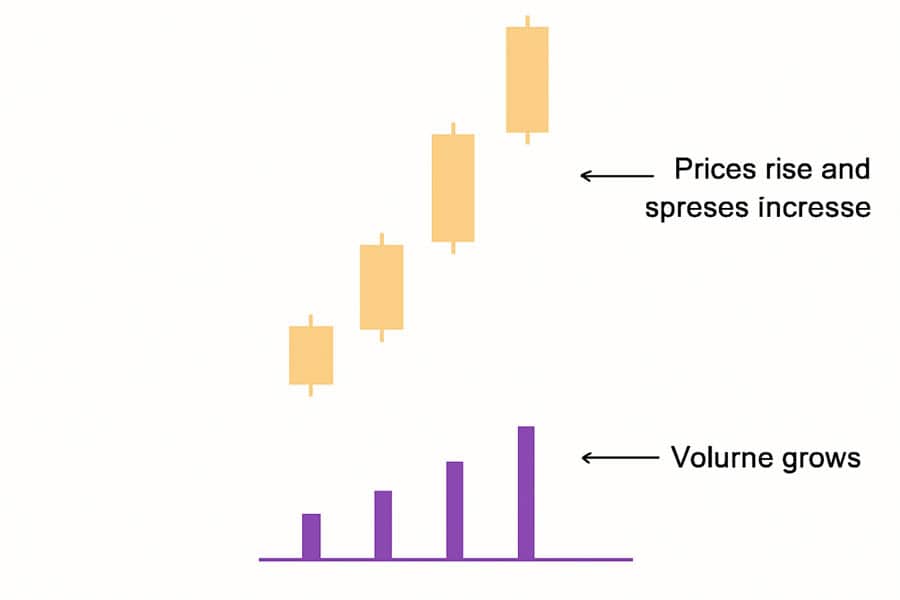
This is the most basic economic principle. When demand for an asset is greater than its supply, prices will rise. Conversely, when supply is greater than demand, prices will fall. VSA visualizes this law in action. For example, a wide spread up-bar closing on its high with high volume indicates strong demand. A wide spread down-bar closing on its low with high volume shows that supply is overwhelming demand. When volume is low, it suggests that neither supply nor demand is a significant force, often leading to a static or choppy market.
2. The Law of Cause and Effect
This law states that for every effect (a price movement), there must be a cause. The cause, in VSA terms, is a period of accumulation or distribution. A significant trend (the effect) can only occur after a period of consolidation where smart money builds its position (the cause). The longer and more intense the accumulation or distribution phase, the more substantial the subsequent mark-up or mark-down will be. VSA helps traders identify these “cause” phases on a chart, allowing them to position themselves for the impending “effect.”
3. The Law of Effort vs. Result
This is arguably the most nuanced and powerful law in the VSA toolkit. It states that the volume (the effort) should be in harmony with the price movement (the result). If there is a great deal of volume (effort), there should be a significant price move (result). If this harmony is broken, it signals a potential anomaly. For example:
- Harmony: A wide spread up-bar on high volume shows effort aligning with the result. The market is strong.
- Disharmony (Anomaly): A narrow spread bar on ultra-high volume is a red flag. It shows a huge amount of effort, but it produced very little result in terms of price movement. This often means smart money is absorbing the pressure. For instance, if this occurs after a long uptrend, it suggests distribution—smart money is selling into the buying pressure from weak holders. Conversely, after a downtrend, it can signal accumulation, where smart money is buying up all the selling.
The Four Market Phases in VSA
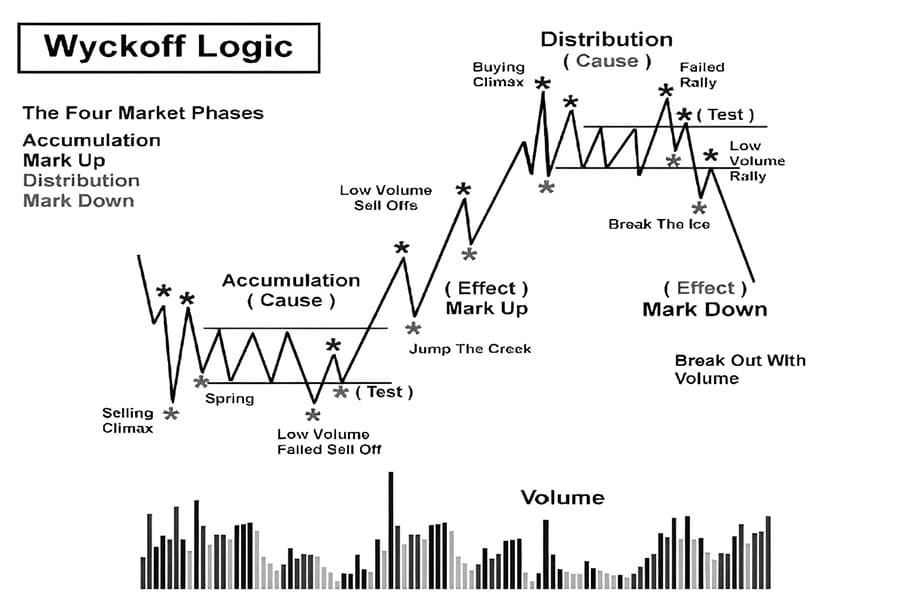
According to the Wyckoff-VSA methodology, markets move in a cyclical four-phase pattern. Identifying the current market phase is the first step in applying any Volume Spread Analysis strategy, as it provides the overarching context for all trading decisions. The right strategy in one phase will likely fail in another.
Accumulation
This phase occurs after a prolonged downtrend. It is a sideways price range where smart money begins to buy, or “accumulate,” assets from weak holders who are panic-selling. On a chart, this phase is characterized by signs of strength (SOS), such as Stopping Volume (high volume on a down-bar that fails to push price much lower) and Shakeouts. Volume may be high at the start as sellers are washed out, but it tends to quiet down as supply is absorbed. The goal for a VSA trader is to identify the end of the accumulation phase to enter a long position for the subsequent mark-up.
Mark-Up
Once accumulation is complete and supply has been removed from the market, the path of least resistance is upwards. The mark-up phase is a sustained uptrend. Price moves up easily on moderate, healthy volume. Pullbacks or corrections during this phase should occur on lower volume, indicating a lack of selling pressure. VSA traders look to hold their long positions during this phase, using signs of weakness to signal a potential end to the trend.
Distribution
Distribution is the opposite of accumulation. After a significant mark-up, smart money begins to sell, or “distribute,” their holdings to the enthusiastic but late-to-the-party public. This phase often looks like a choppy, sideways market at the top of a trend. Key VSA signals in this phase are signs of weakness (SOW), such as Upthrusts and high-volume churning on narrow spread bars. The goal for a VSA trader is to exit long positions and look for opportunities to go short.
Mark-Down
After distribution is complete, demand is exhausted, and supply is in control. The path of least resistance is now downwards. The mark-down phase is a sustained downtrend. Price falls on increasing volume, while rallies or bounces are weak and occur on low volume. This indicates a lack of buying interest. VSA traders aim to hold short positions during this phase, watching for signs of strength that might signal the beginning of a new accumulation phase.
Read More: Keltner Channels vs Bollinger Bands
Building a Volume Spread Analysis Strategy
A successful trading approach is more than just recognizing patterns; it’s a complete framework. A robust VSA trading strategy integrates market context, signal identification, and strict risk management into a cohesive plan. It’s about creating a repeatable process that can be applied consistently across different market conditions.
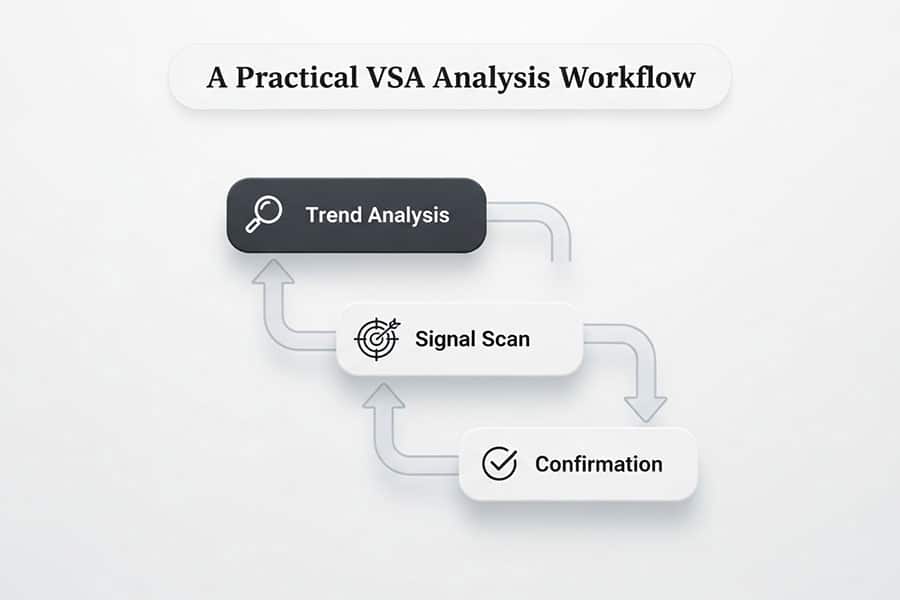
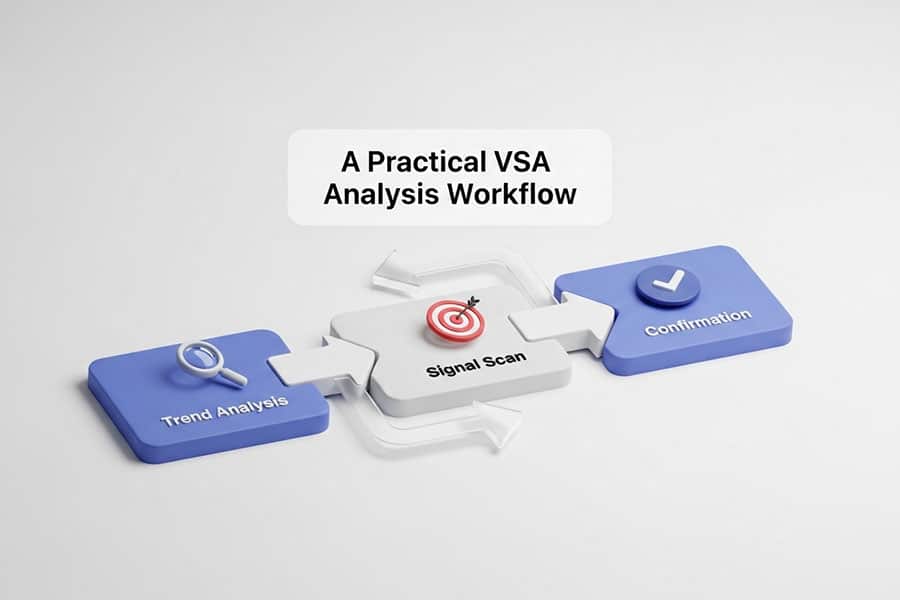
A Practical VSA Analysis Workflow
Here is a step-by-step workflow for analyzing a chart using Volume Spread Analysis:
- Identify the Background Trend: Before analyzing individual bars, look at the bigger picture. Is the market in a clear uptrend, downtrend, or trading range? This context is critical. A sign of weakness is much more significant at the top of a long uptrend than in the middle of a consolidation phase.
- Scan for Signs of Strength (SOS) or Weakness (SOW): Look for key VSA principles that indicate a potential shift in the supply/demand balance. Are you seeing high-volume bars that are stopping a trend? Or perhaps ultra-high volume on a narrow spread, indicating absorption? These are the major clues.
- Analyze Individual VSA Setups: Once you have a background opinion, zoom in on specific bars and two-bar patterns. Look for signals like No Demand or No Supply bars to confirm your thesis. For example, if you see a sign of strength in a downtrend, you would then wait for a No Supply bar (a narrow spread down-bar on low volume) to confirm that selling pressure has dried up before considering a long entry.
- Look for Confirmation: VSA should not be used in a vacuum. Confirm your VSA signals with classic technical analysis tools. Does your signal appear at a known support or resistance level? Is a moving average crossover confirming the trend change? This confluence of signals adds immense power to your trade setup.
Using VSA for Trends, Reversals, and Breakouts
A core strength of the Volume Spread Analysis strategy is its versatility. It can be applied to identify all types of market behavior:
- Trend Following: In a healthy uptrend, pullbacks should occur on low volume. This is a sign of “No Supply” and a great opportunity to join the trend. In a downtrend, small rallies on low volume signal “No Demand” and offer a chance to enter a short position.
- Reversal Trading: The most powerful reversal signals are climactic actions. A “Selling Climax” occurs at the bottom of a downtrend, marked by a wide spread down-bar on ultra-high volume. This indicates panic selling by the public is being absorbed by smart money. A “Buying Climax” is the opposite at a market top.
- Breakout Confirmation: VSA is excellent for validating breakouts. A true breakout above a resistance level should occur on high volume, showing commitment from smart money. If a breakout happens on low volume, it is likely a false move (an Upthrust) and a trap.
Key VSA Trading Patterns and Signals
The essence of a VSA trading system is the recognition and correct interpretation of specific price-volume patterns. These signals provide actionable insights into the intentions of smart money. Below are some of the most important VSA patterns.
No Demand and No Supply Bars
These are among the most frequent and reliable signals:
- No Demand Bar: This is an up-bar with a narrow spread and lower volume than the previous two bars. It indicates a lack of buying interest. If it appears during a rally in a downtrend, it’s a strong signal to go short. If it appears after a sign of weakness at a market top, it confirms that the buying pressure has been exhausted.
- No Supply Bar: This is a down-bar with a narrow spread and lower volume than the previous two bars. It shows a lack of selling pressure. In an uptrend, it’s a classic sign that a pullback is over and the trend is ready to resume. After a sign of strength at a market bottom, it confirms that sellers are gone, providing a safe entry point for a long trade.
Stopping Volume and Climactic Volume
- Stopping Volume: This appears as a down-bar with a wide spread and high or ultra-high volume, but the price closes in the middle or near the high. It often occurs after a sharp fall in price. This indicates that despite the high selling pressure (high volume), smart money stepped in to absorb it, preventing the price from falling further. It is a sign of strength.
- Climactic Action (Buying or Selling Climax): This is an extreme version of Stopping Volume. A Selling Climax is a very wide spread down-bar on panic-level volume. It signals the end of a downtrend. A Buying Climax is a very wide spread up-bar on extreme volume, signaling the end of an uptrend as professionals distribute their holdings to an ecstatic public.
Upthrusts and Springs
These are classic trap moves designed to mislead retail traders.
- Upthrust: An Upthrust is a false breakout to the upside. Price moves above a previous high or resistance level, often on low volume, and then quickly reverses to close below it. This is a sign of weakness designed to trap breakout buyers. It’s an excellent shorting opportunity.
- Spring (or Shakeout): A Spring is a false breakout to the downside. Price temporarily drops below a key support level, only to rally and close back within the range. This move is designed to trigger stop-loss orders from weak holders and induce panic selling, which smart money happily buys. It is a powerful sign of strength.
Read More: Keltner Channel vs Donchian
Building a Complete VSA Trading System
Transitioning from understanding VSA concepts to implementing a full-fledged VSA trading system requires structure, discipline, and the right tools. A trading system is a complete set of rules that governs every aspect of your trading, from entry to exit, leaving no room for emotional decision-making.
Essential Tools for VSA
- Charting Platform: You need a platform that provides high-quality charting with clear, real-time volume data. Popular choices include TradingView, MetaTrader (MT4/MT5), and other platforms offered by your broker.
- Volume Indicators: While VSA is not indicator-heavy, a good volume indicator that clearly displays volume bars is essential. Some traders use VSA-specific software or indicators that automatically label potential signals, though manual analysis is always recommended for confirmation.
- Market Scanners: Manually scanning dozens of charts for VSA setups can be time-consuming. A market scanner can be configured to alert you when specific volume and spread conditions are met (e.g., volume greater than 2x the 20-period average), allowing you to focus your attention only on high-probability setups.
Defining Entry and Exit Rules
Your VSA trading system must have precise rules:
- Entry Trigger: What exact VSA signal will trigger your entry? For example: “Enter long 1 tick above the high of a No Supply bar that appears after a test of a Shakeout.”
- Stop-Loss Placement: Where will you place your initial stop-loss? A logical place is just below the low of the signal bar or the VSA pattern. For a Spring, the stop would go just below the low of the Spring itself.
- Profit Targets: How will you take profits? You could use a fixed risk-to-reward ratio (e.g., 2:1 or 3:1), or you could trail your stop-loss until an opposing VSA sign of weakness appears, allowing you to capture the entire trend move.
Backtesting and Forward-Testing
No trading system should be used with real money until it has been thoroughly tested.
- Backtesting: Manually or automatically go through historical chart data to see how your system’s rules would have performed in the past. This helps you identify flaws and refine your parameters.
- Forward-Testing (Paper Trading): After successful backtesting, trade your system in a demo account with real-time data. This tests your ability to execute the system under live market conditions without financial risk.
Advanced Volume Spread Analysis Tactics
Once you’ve mastered the basics, you can begin to incorporate more advanced tactics into your Volume Spread Analysis. These nuances separate proficient traders from the rest and allow for a deeper understanding of market behavior across different assets and timeframes.
Adapting VSA to Different Markets
While the principles of supply and demand are universal, their manifestation can vary across markets:
- Stocks: VSA was originally designed for the stock market, where centralized volume reporting (e.g., from NYSE or NASDAQ) provides very accurate data. This makes it an ideal market for classic VSA.
- Forex: The forex market is decentralized, meaning there is no single source for volume data. Instead, forex platforms provide “tick volume,” which measures the number of price changes. While not a true measure of order size, tick volume is highly correlated with actual volume and is widely and successfully used by forex VSA traders.
- Cryptocurrencies: Crypto markets are highly volatile and retail-driven, but VSA is still incredibly effective. The principles of accumulation and distribution are clearly visible. Volume data from major exchanges is reliable and can be used to spot climactic moves and absorption patterns.
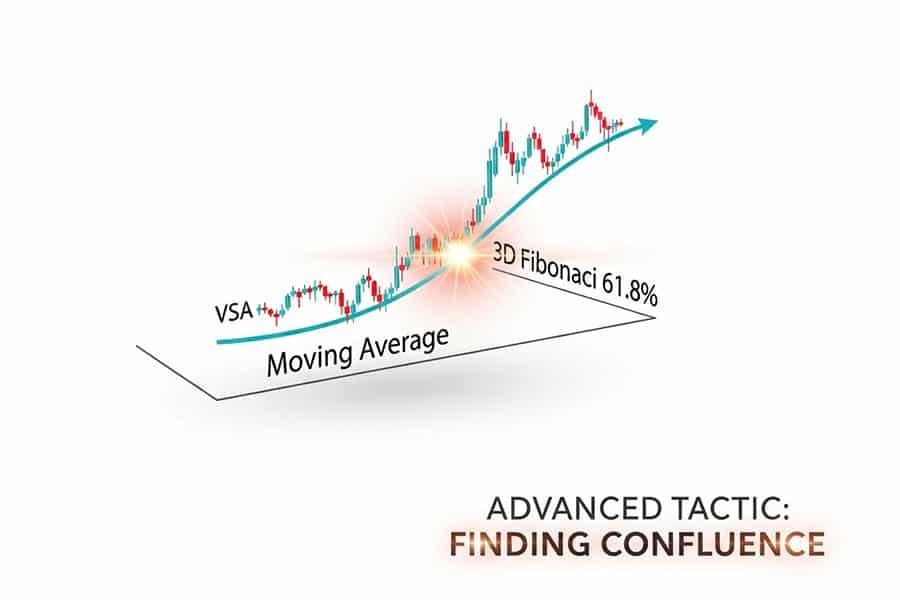
Combining VSA with Other Strategies
Volume Spread Analysis is not a standalone island. Its predictive power is magnified when combined with other forms of analysis.
- Support and Resistance: A VSA signal becomes exponentially more powerful if it occurs at a pre-identified, major support or resistance level. An Upthrust at a key weekly resistance level is a much higher-probability short than one that occurs in the middle of a range.
- Moving Averages: Moving averages help define the trend. A No Supply signal in an uptrend that finds support at the 50-day moving average is a high-confidence long entry.
- Fibonacci Levels: Traders often look for VSA signals at key Fibonacci retracement levels (e.g., 61.8%). A sign of strength at this level suggests the correction is over and the primary trend is resuming.
Pro Tips for Mastering VSA
Mastering Volume Spread Analysis is a journey of continuous learning and refinement. It requires patience, discipline, and a commitment to understanding market psychology. Here are some experience-driven tips to accelerate your learning curve and trade like a professional.
Keep a Detailed Trading Journal
This is non-negotiable for serious traders. Your journal should include screenshots of your VSA setups before, during, and after the trade. For each trade, record:
- Your reason for entry (the specific VSA signal).
- The market context (trend, phase).
- Your stop-loss and profit target levels.
- The outcome of the trade.
- A review of what you did right and what you could have done better.
Over time, this journal will become your personal textbook, highlighting the patterns you trade best and the mistakes you need to eliminate. This process of self-review is fundamental to improving your pattern recognition skills.
Focus on Quality, Not Quantity
A common mistake is trying to trade every potential VSA signal you see. Professionals wait patiently for the “A+” setups where multiple factors align in their favor. This means waiting for a clear signal, at a logical location on the chart (like a support/resistance level), with the background trend confirming your bias. It is far more profitable to take three high-quality trades a week than ten mediocre ones. Trading less often leads to better decision-making and reduced stress.
Unlock Your Trading Potential with Opofinance
Take your trading to the next level with a broker that supports your strategy. Opofinance, regulated by ASIC, offers a suite of powerful tools designed for modern traders.
- Advanced Trading Platforms: Choose from industry standards like MT4, MT5, cTrader, and the proprietary OpoTrade platform.
- Innovative AI Tools: Gain an edge with an AI Market Analyzer, AI Coach, and instant AI Support.
- Flexible Trading Options: Explore opportunities in Social Trading and Prop Trading.
- Secure & Easy Transactions: Enjoy safe and convenient deposits and withdrawals, including crypto payments with zero fees.
Start trading with Opofinance today!
Conclusion
Volume Spread Analysis offers traders a profound advantage by shifting their focus from lagging indicators to the real forces of supply and demand. By learning to interpret the relationship between volume, spread, and price, you can decode the actions of institutional money and align your trades with the dominant market trend. Building a successful VSA trading system requires discipline, practice, and a systematic approach, but the reward is a deeper, more intuitive understanding of market behavior that can elevate your trading results for years to come.
Glossary: Key VSA Terms
Accumulation:
The phase where smart money buys assets at low prices, absorbing supply from the market.
Distribution:
The phase where smart money sells assets at high prices, offloading them to the public.
Effort vs. Result:
A core VSA law comparing volume (effort) to price movement (result) to spot market anomalies.
No Demand Bar:
An up-bar with a narrow spread on low volume, signaling a lack of buying interest.
No Supply Bar:
A down-bar with a narrow spread on low volume, signaling a lack of selling pressure.
Smart Money:
Institutional traders, market makers, and large financial entities whose trading volume can move the market.
Spread:
The range of a price bar from its high to its low.
Spring:
A false breakout below a support level that quickly reverses, designed to trap sellers.
Stopping Volume:
High volume on a down-bar that fails to push prices significantly lower, indicating professional buying is absorbing the selling pressure.
Upthrust:
A false breakout above a resistance level that quickly fails, designed to trap buyers.
Weak Holders:
Retail or uninformed traders who often buy at tops and sell at bottoms based on emotion.
Is Volume Spread Analysis hard to learn?
VSA has a learning curve, but it is logical. It requires practice to recognize patterns, but it is less complex than many indicator-based systems. Starting with major signals like No Demand/Supply is a good entry point for beginners.
What is the best timeframe for VSA?
VSA principles are fractal and apply to all timeframes. However, signals are often more reliable on higher timeframes (like the 4-hour, daily, or weekly charts) as they reflect more significant institutional activity and are less affected by market noise.
Can I use VSA without volume data?
No, volume is a mandatory component of Volume Spread Analysis. Without it, you are only analyzing price action, which is an incomplete picture. The “spread” and “volume” parts of the name are essential.
How does VSA differ from Wyckoff Theory?
VSA is a specialized branch of the Wyckoff Method. Wyckoff provided the overarching theory of market cycles (accumulation, distribution). VSA, as refined by Tom Williams, provides the bar-by-bar specifics and named signals (like Upthrusts and No Demand) to execute trades within that framework.
Are there VSA indicators I can use?
Yes, many platforms like TradingView offer VSA indicators that automatically highlight potential signals (e.g., by coloring bars based on volume and spread analysis). While useful for scanning, traders should always manually verify these signals against the market context before acting on them.


