

The Dow Jones Industrial Average (DJIA) is a stock market index that tracks the performance of 30 large, publicly traded companies in the United States. Often referred to simply as “The Dow” or “Dow 30,” it serves as one of the most widely recognized indicators of the overall health of the U.S. stock market and economy. The DJIA’s performance is seen as a barometer for the broader market and the economy, influencing investment decisions and economic policies. For those involved in forex trading, working with a regulated forex broker can help manage risks and provide more security in the financial markets.

History and Creation of the DJIA
The DJIA was established in 1896 by Charles Dow, co-founder of Dow Jones & Company and the Wall Street Journal. Initially, the index included 12 companies, primarily from the industrial sector, reflecting the industrial economy of the United States at the time. The original companies in the DJIA included names like General Electric, which remained part of the index for over a century. Over the years, the composition of the DJIA has evolved to include a diverse range of companies across various sectors, adapting to the changing landscape of the American economy.
Nicknames
The DJIA is commonly referred to as “The Dow” or “Dow 30.” These nicknames reflect its status as a benchmark for the U.S. stock market and its focus on 30 significant companies. The Dow has become synonymous with the broader market’s performance in everyday conversations and financial reporting.
Composition of the DJIA
Selection Criteria for Companies
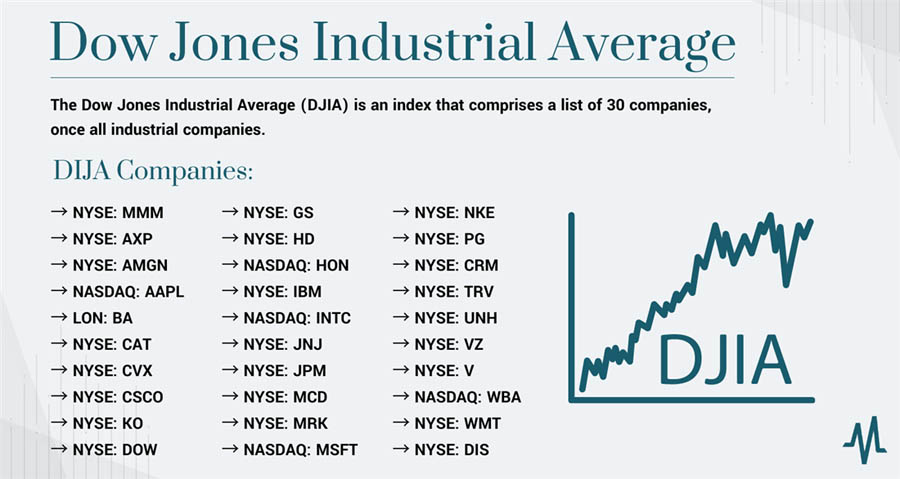
The Dow Jones Industrial Average (DJIA) includes 30 companies selected based on specific criteria to ensure the index accurately represents the broader U.S. economy. These criteria focus on the size, stability, and significance of the companies:
- Large, Publicly Traded Companies: The DJIA comprises large-cap companies that are publicly traded on major U.S. stock exchanges, such as the New York Stock Exchange (NYSE) and NASDAQ. These companies typically have a market capitalization in the tens or hundreds of billions of dollars.
- Blue-Chip Status: Companies included in the DJIA are often referred to as “blue-chip” companies. This term signifies well-established firms known for their reliable earnings, stable growth, and solid financial foundations. Blue-chip companies are typically industry leaders with a long history of success and resilience.
- Significant Presence in the U.S. Economy: The DJIA aims to include companies that play a substantial role in the U.S. economy. These companies are leaders in their respective industries and have a broad impact on economic activities, employment, and consumer behavior.
- Investor Interest and Trading Volume: To be considered for inclusion, companies must generate significant interest from investors and have high trading volumes. This ensures that the DJIA remains a relevant and actively traded index.

Importance of Industry Representation in the DJIA
Industry representation in the Dow Jones Industrial Average (DJIA) ensures a comprehensive reflection of the U.S. economy, minimizing the influence of any single sector and providing a balanced view of economic performance.
- Technology Companies like Apple, Microsoft, and Intel lead in computing, software, and digital innovation, driving global technological advancements.
- Healthcare Johnson & Johnson and Merck contribute to medical advancements and pharmaceutical research, critical for public health.
- Finance Goldman Sachs and JPMorgan Chase represent banking and financial services, crucial for economic stability.
- Consumer Goods Coca-Cola, Procter & Gamble, and McDonald’s dominate retail and consumer products, reflecting consumer spending trends.
- Industrials Caterpillar and 3M contribute to manufacturing and industrial innovation, supporting infrastructure development.
Read More: 7 USDJPY mistakes that Will Burn Your Forex Portfolio
Changing Composition Over Time
The DJIA adapts its composition to reflect economic shifts, adding or removing companies based on market capitalization, industry relevance, and financial health. Recent adjustments reflect trends towards technology and biotechnology.
Balancing Traditional and Modern Industries
Including legacy companies alongside innovators like Apple and Visa ensures the DJIA remains relevant. This mix captures both traditional industrial strengths and emerging economic sectors.
Summary of Current DJIA Components
The DJIA includes:
- Technology: Apple, Microsoft, Intel
- Healthcare: Johnson & Johnson, Merck, Amgen
- Finance: Goldman Sachs, JPMorgan Chase, Visa
- Consumer Goods: Coca-Cola, Procter & Gamble, McDonald’s
- Industrials: Caterpillar, 3M, Boeing
- Energy: Chevron
This balanced composition makes the DJIA a robust indicator of overall market performance, offering insights into the U.S. economy and its leading sectors.
Calculating the DJIA
Price-Weighted Average
The Dow Jones Industrial Average (DJIA) is a price-weighted index, which means that its value is derived from the stock prices of its 30 constituent companies. Unlike market-capitalization-weighted indices, where the influence of each company is proportional to its market value, the DJIA gives more weight to companies with higher stock prices. Here’s a detailed breakdown of how this calculation works:
- Sum of Stock Prices: The first step in calculating the DJIA is to sum the stock prices of all 30 companies included in the index. For instance, if the stock prices of the companies are $150, $100, and $50, the total sum would be $300.
- Dow Divisor: The total sum of the stock prices is then divided by the Dow Divisor, a constantly adjusted figure that accounts for stock splits, dividends, and other changes that could affect the index’s value. The Dow Divisor is a critical component that ensures the index remains consistent and comparable over time. As of recent adjustments, the Dow Divisor is approximately 0.147, but this value changes to reflect corporate actions and maintain the continuity of the index.
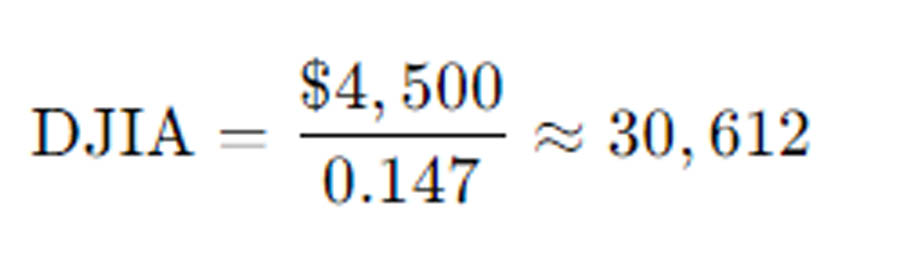
- Calculation Example: Suppose the sum of the stock prices of all 30 DJIA companies is $4,500. To calculate the DJIA, you would divide this sum by the Dow Divisor:
This calculation results in the DJIA value, representing a snapshot of the average stock price of the index’s components adjusted by the Dow Divisor.
Limitations of a Price-Weighted Index
While the price-weighted method used to calculate the DJIA is straightforward, it comes with certain limitations that can affect its representation of the market:
- Disproportionate Influence: Higher-priced stocks have a greater impact on the DJIA’s movements. This means that a significant change in the price of a high-value stock can disproportionately affect the index, even if the overall market trend remains stable. For example, if a stock priced at $300 experiences a 10% increase, it will have a more substantial impact on the DJIA than a 10% increase in a stock priced at $50.
- Not Reflective of Market Capitalization: The price-weighted nature of the DJIA does not take into account the market capitalization of the companies. As a result, smaller companies with higher stock prices can exert more influence on the index than larger companies with lower stock prices. This can lead to a skewed representation of the market’s performance.
Read More: Forex market holidays
The Concept of the Dow Divisor
The Dow Divisor plays a crucial role in maintaining the integrity and continuity of the DJIA. It is an adjustable figure that accounts for changes such as stock splits, spin-offs, and other corporate actions that could affect the calculation of the index. Here’s how the Dow Divisor functions:
- Adjusting for Stock Splits: When a company undergoes a stock split, its share price is reduced, and the number of outstanding shares increases proportionally. To prevent this change from artificially lowering the DJIA, the Dow Divisor is adjusted. For example, if a company with a stock price of $200 undergoes a 2-for-1 split, its price drops to $100, but the Dow Divisor is altered to keep the DJIA value unchanged.
- Handling Corporate Actions: The Dow Divisor also adjusts for other corporate actions like spin-offs, mergers, and acquisitions. These events can alter the stock price or the number of outstanding shares, and the Dow Divisor ensures that such changes do not distort the index.
- Maintaining Continuity: By continuously adjusting the Dow Divisor, the DJIA can provide a consistent measure of market performance over time. This adjustment process is essential for accurately reflecting the index’s historical performance and making meaningful comparisons.
Historical Adjustments and Impact
Over the years, the Dow Divisor has been adjusted numerous times to account for various corporate actions and market changes. Some notable historical adjustments include:
- Stock Splits: High-profile stock splits, such as Apple’s 4-for-1 split in 2020 and Microsoft’s 2-for-1 split in 2003, required significant adjustments to the Dow Divisor to ensure the DJIA remained consistent.
- Component Changes: When companies are added to or removed from the DJIA, the Dow Divisor is adjusted to reflect these changes. For example, when Salesforce was added to the index in 2020, replacing ExxonMobil, the Dow Divisor was recalibrated to account for the differing stock prices and market impacts.
- Mergers and Acquisitions: Corporate mergers and acquisitions also necessitate adjustments to the Dow Divisor. For instance, when DowDuPont was split into three separate companies (Dow, DuPont, and Corteva), the divisor was adjusted to reflect the changes in stock prices and market value.
The Dow Jones Industrial Average as a Market Indicator
The Dow Jones Industrial Average (DJIA) is globally recognized as one of the premier stock market indices. It serves not only as a gauge of the U.S. economy but also as a crucial indicator of market sentiment. This section delves into its role as a market indicator, its reflection of the U.S. economy, its utilization by investors and the media, and the importance of considering other indices alongside it.

Perceived Reflection of the U.S. Economy
The DJIA is often perceived as a microcosm of the U.S. economy due to its composition of 30 large, influential companies spanning various sectors. These companies, which include leaders in technology, finance, healthcare, consumer goods, and industrials, are deeply embedded in economic activities.
Pros
- Representative Companies: The inclusion of well-established blue-chip companies that lead their respective industries allows the DJIA to mirror the health of the U.S. economy effectively.
- Economic Trends: Movements in the DJIA can indicate broader economic trends. A rising DJIA typically signifies investor confidence and economic growth, whereas a declining index may suggest economic challenges or investor pessimism.
- Historical Data: With a history dating back to 1896, the DJIA offers extensive historical data. This wealth of information enables analysts to study market trends, economic cycles, and the impacts of significant events on the economy.
Cons
- Limited Number of Stocks: Comprising only 30 companies out of thousands traded publicly in the U.S., the DJIA represents a small fraction of the economy. Therefore, it may not fully capture the diversity and complexity of all economic sectors.
- Price-Weighted Index: The DJIA’s price-weighted nature means higher-priced stocks exert more influence on its movements. This can lead to skewed results that do not accurately reflect the overall market performance.
- Sector Representation: While diverse, the DJIA’s composition may not always mirror the fastest-growing or emerging sectors of the economy, potentially limiting its ability to encompass the entirety of economic activity.
Read More: The Ultimate US30 Strategy for Maximum Profits
Use by Investors and Media to Gauge Market Sentiment
The DJIA serves as a vital tool for investors and the media to gauge market sentiment and trends.
- Investor Confidence: Movements in the DJIA signal investor sentiment. An upward trend suggests optimism and confidence, while a downward trend may indicate caution or concern, influencing investment decisions.
- Media Coverage: Among the most reported financial indicators globally, the DJIA’s daily movements receive extensive media coverage. News outlets analyze these fluctuations to provide insights into economic health and investor behavior, shaping public perception of market conditions.
- Market Trends: Analysts and traders use the DJIA to identify trends and potential investment opportunities. By monitoring its performance, they gain insights into sectoral performance and market dynamics.
Importance of Considering Other Market Indices
While invaluable, the DJIA should be complemented with other indices to provide a comprehensive market overview.
- S&P 500: Comprising 500 of the largest U.S. companies, the S&P 500 offers a broader and more balanced perspective due to its market-cap weighting.
- NASDAQ Composite: Focused on over 3,000 stocks, particularly in technology and growth sectors, the NASDAQ provides insights into these industries beyond the DJIA’s scope.
- Russell 2000: Tracking 2,000 small-cap companies, the Russell 2000 highlights trends in smaller, domestically focused firms crucial for economic growth assessment.
- Global Indices: International indices like the FTSE 100 (UK), Nikkei 225 (Japan), and DAX (Germany) provide insights into global economic trends that may impact the U.S. market, offering a broader perspective beyond domestic indicators.
Analyzing the DJIA in Context
To accurately interpret the DJIA’s movements, it is essential to consider the broader economic context and other market indicators. Here are a few key points to keep in mind:
- Economic Data: Economic indicators such as GDP growth, unemployment rates, and inflation should be analyzed alongside the DJIA to understand the broader economic environment. For example, a rising DJIA during a period of strong GDP growth suggests robust economic health.
- Corporate Earnings: The earnings reports of the 30 DJIA companies can provide insights into the index’s performance. Strong earnings can drive the DJIA higher, while disappointing results can lead to declines.
- Market Sentiment: Investor sentiment, as reflected in market surveys and sentiment indices, can influence the DJIA. Positive sentiment can drive the index higher, while negative sentiment can lead to declines.
- Global Events: Geopolitical events, international trade developments, and global economic trends can impact the DJIA. It is important to consider these factors when analyzing the index’s movements.
Conclusion
The Dow Jones Industrial Average is a cornerstone of the financial world, providing insight into the performance of major U.S. companies and serving as a key indicator of economic health. While it has its limitations, the DJIA remains a widely used and influential metric for investors, analysts, and the media. Its historical significance, ease of understanding, and the prominence of its components make it a valuable tool for gauging market trends and sentiment.
Reference: +
Why is the Dow Jones Industrial Average considered important?
The DJIA is considered important because it tracks the performance of 30 major U.S. companies, providing a snapshot of the overall health of the stock market and economy. Its movements are closely watched by investors, policymakers, and the media, making it a key indicator of market sentiment.
How often is the composition of the DJIA reviewed?
The composition of the DJIA is reviewed regularly and can change as needed to ensure it remains representative of the current market landscape. The review process considers various factors, including company performance, industry relevance, and overall economic trends.
What is the significance of the Dow Divisor?
The Dow Divisor is used to adjust the calculation of the DJIA for stock splits and other changes, ensuring the continuity and comparability of the index over time. It helps maintain the index’s stability and accuracy despite changes in the stock prices of its components.


