

Have you ever wondered why some forex traders seem to have the Midas touch, while others struggle to stay afloat? The truth is, it’s not about luck or even natural talent. It’s about knowing which tools to use and how to use them effectively. Whether you’re working with a forex broker or trading independently, having the right strategies can make all the difference. Today, we’re going to dive into the world of forex indicators and reveal the five that separate the winners from the losers. Ready to take your trading game to the next level? Let’s get started!
1. The Moving Average Convergence Divergence (MACD): Your Crystal Ball for Trend Reversals
Picture this: you’re watching the forex market, and suddenly, you spot a golden opportunity. But how can you be sure it’s the right time to make your move? Enter the MACD, your trusty sidekick in the world of forex trading.
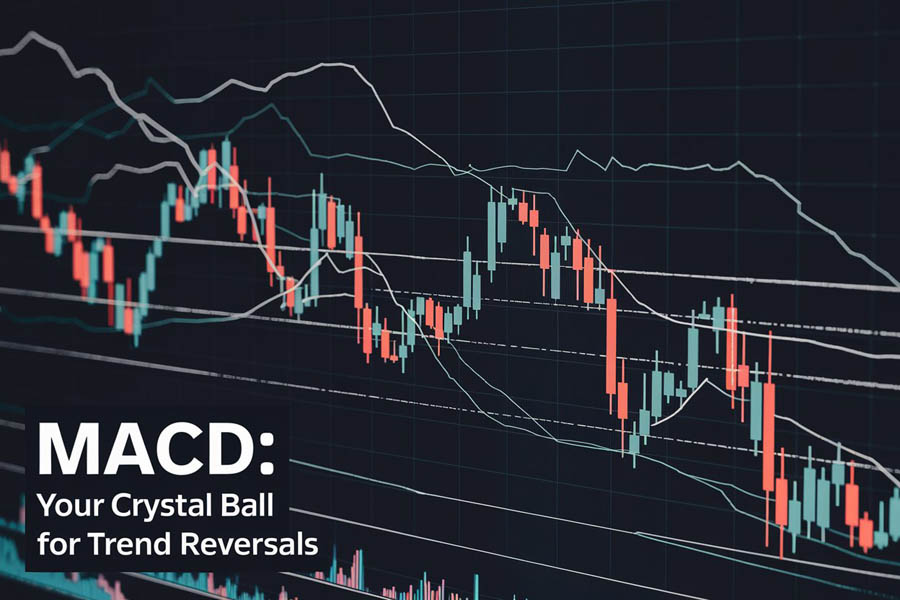
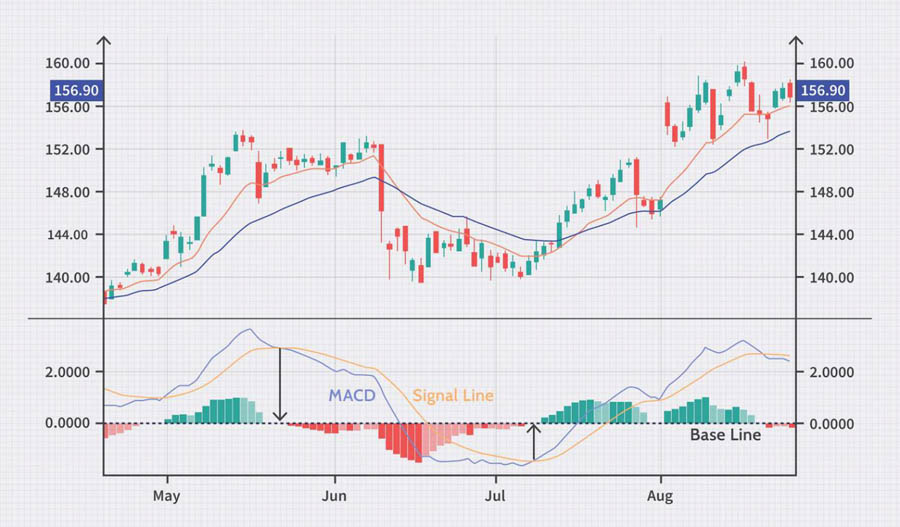
The MACD is like having a crystal ball that helps you predict trend reversals. It’s made up of two moving averages that dance around each other, creating signals when they cross. When the faster line crosses above the slower line, it’s giving you a thumbs up to buy. When it crosses below, it’s telling you it might be time to sell.
But here’s the kicker: the MACD isn’t just about crossovers. It also has a histogram that shows the difference between these two lines. When the histogram starts shrinking, it’s whispering, “Hey, a trend change might be coming!”
The real power of the MACD lies in its ability to confirm trends and signal potential reversals before they happen.
Real-life example: Sarah, a beginner trader, was hesitant to enter the market. She started using the MACD and noticed a bullish crossover on the EUR/USD pair. Taking a leap of faith, she opened a long position. To her delight, the pair rallied, and she made her first significant profit. The MACD had given her the confidence to act at the right moment.
But remember, the MACD isn’t infallible. It’s most effective when used in conjunction with other indicators and analysis. Think of it as one piece of a larger puzzle – important, but not the whole picture.
2. Relative Strength Index (RSI): Your Overbuying and Overselling Detector
Ever bought something on impulse, only to regret it later? The forex market can be just as tempting, but the RSI is here to keep you in check.
Think of the RSI as your personal shopping assistant. It measures the speed and change of price movements, helping you spot when a currency pair might be overbought or oversold. It’s like having a friend who tells you, “Hey, maybe you don’t need another pair of shoes” when you’re about to overspend.
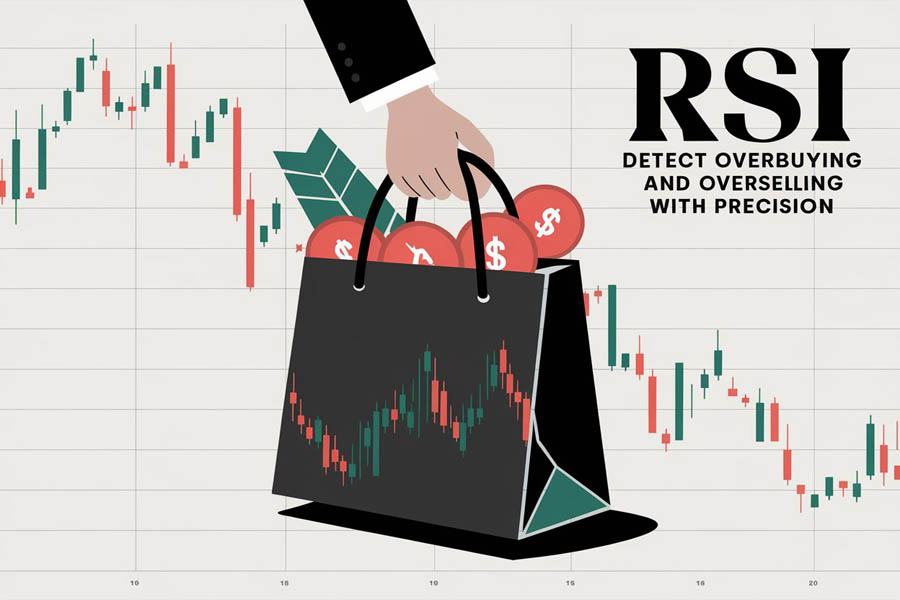
The RSI runs on a scale from 0 to 100. When it climbs above 70, it’s waving a red flag, suggesting the pair might be overbought. When it dips below 30, it’s giving you a green light, hinting that the pair might be oversold.
But here’s a pro tip: don’t just jump in at these levels. Wait for the RSI to cross back over these thresholds. It’s like waiting for the sale to start before you go shopping – patience pays off!
The RSI is most powerful when used to identify potential trend reversals and to confirm the strength of an existing trend.

Real-life example: Mike, an enthusiastic trader, used to jump into trades at the first sign of movement. After incorporating the RSI into his strategy, he learned to be more patient. When the GBP/JPY pair hit an RSI of 75, instead of selling immediately, he waited. Sure enough, the RSI crossed back below 70, and Mike opened a short position, riding the downtrend to a tidy profit.
One often overlooked aspect of the RSI is its ability to show divergences. If the price is making new highs, but the RSI isn’t, it could be a sign that the uptrend is losing steam. This divergence can be a powerful signal for potential trend reversals.
3. Bollinger Bands: Your Market Volatility Compass
Have you ever felt lost in the forex market, unsure which direction prices might move? Bollinger Bands are like your personal GPS, helping you navigate through market volatility.
Imagine a river with two banks. The middle of the river is the simple moving average, and the banks are the upper and lower Bollinger Bands. When the river is calm (low volatility), the banks are close together. When it’s turbulent (high volatility), the banks spread apart.

Here’s where it gets interesting: prices tend to bounce between these bands. When prices touch the upper band, it might be time to think about selling. When they hit the lower band, it could be a buying opportunity. It’s like playing tennis with the market – you’re anticipating where the ball (price) will go next.
Bollinger Bands excel at identifying periods of high and low volatility, which can be crucial for timing your entries and exits in the forex market.
But remember, no indicator is perfect on its own. Bollinger Bands work best when confirmed by other indicators or analysis.
Read More: Most Effective Forex Trading Indicators
Real-life example: Lisa, a part-time trader, was always nervous about market volatility. She started using Bollinger Bands and noticed the USD/CAD pair was consistently bouncing off the lower band. Feeling more confident, she opened a long position when the price touched the lower band again. The pair rallied, moving towards the middle band, and Lisa closed her trade with a smile on her face.
An advanced technique with Bollinger Bands is to watch for “squeezes” – periods when the bands come very close together. This often precedes a significant price move, though it doesn’t predict the direction. Savvy traders watch for these squeezes and prepare for potential breakouts.
4. Fibonacci Retracement: Your Market Psychology Decoder
Have you ever wondered if there’s a hidden structure to market movements? Enter Fibonacci retracement, the tool that helps you decode the psychology of the market.
Fibonacci retracement is like finding the rhythm in market chaos. It’s based on the idea that after a significant price move, the market often retraces a predictable portion of that move before continuing in the original direction.
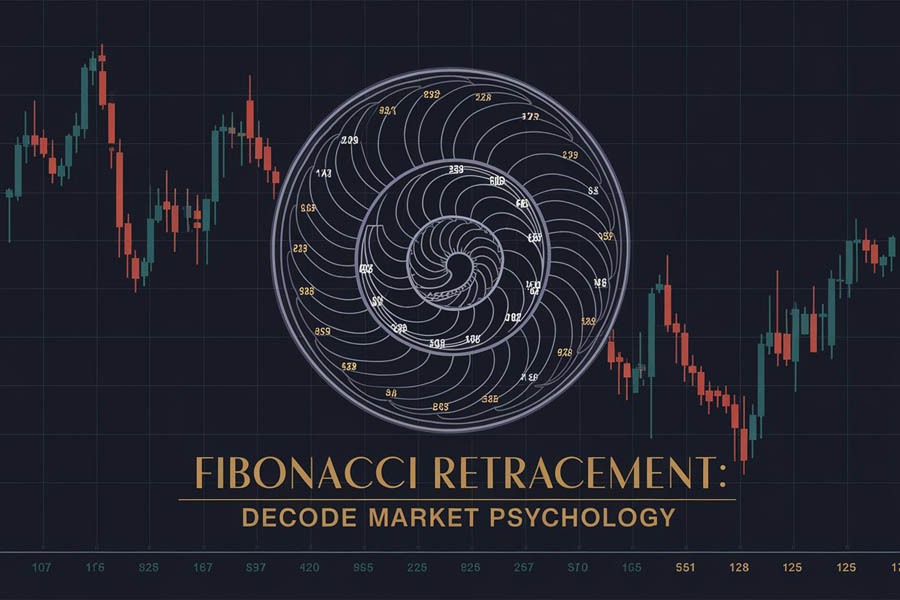
The key Fibonacci levels are 23.6%, 38.2%, 50%, 61.8%, and 78.6%. These levels act like support and resistance zones. It’s as if the market is taking a breather at these pit stops before deciding its next move.
Here’s the cool part: these levels often coincide with psychological price points where traders make decisions. By identifying these levels, you can anticipate where the market might pause, reverse, or continue its trend.
Fibonacci retracements are particularly powerful because they tap into the collective psychology of the market, revealing hidden levels where price action often responds.
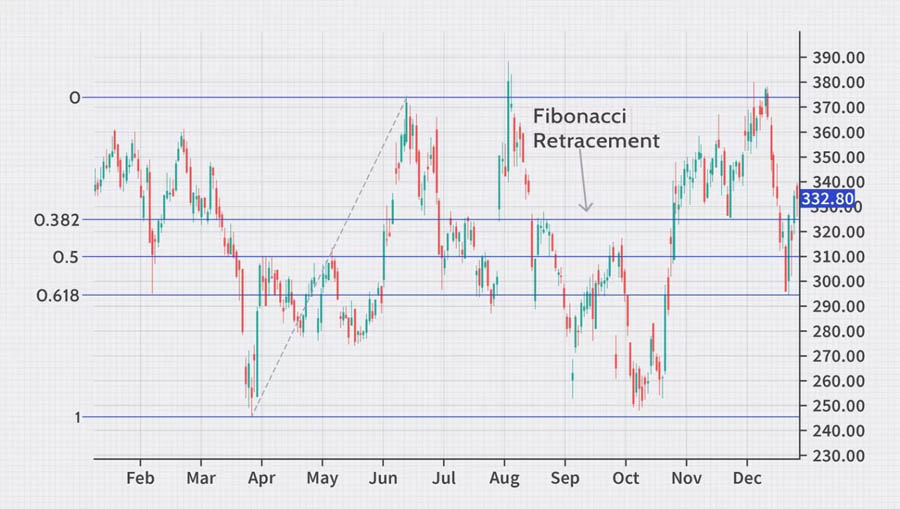
Real-life example: Tom, a skeptical trader, didn’t believe in “magic numbers.” But after studying Fibonacci retracements, he decided to give it a try. He noticed the EUR/GBP pair had made a significant move up and was now pulling back. The price paused near the 61.8% retracement level, a key Fibonacci number. Tom, seeing this as a potential buying opportunity, opened a long position. The pair resumed its upward trend, and Tom became a Fibonacci believer.
It’s worth noting that Fibonacci retracements are not just about predicting reversal points. They can also help you set profit targets. Many traders use the next Fibonacci level as a potential take-profit point, allowing for systematic and disciplined trading.
5. Stochastic Oscillator: Your Momentum Meter
Ever wish you had a speedometer for the forex market? The Stochastic Oscillator is just that – a tool that measures the momentum of price movements.
Think of the Stochastic Oscillator as a car’s tachometer. It doesn’t tell you how fast you’re going, but how hard the engine is working. In forex terms, it shows you how strong the current price movement is compared to its recent range.
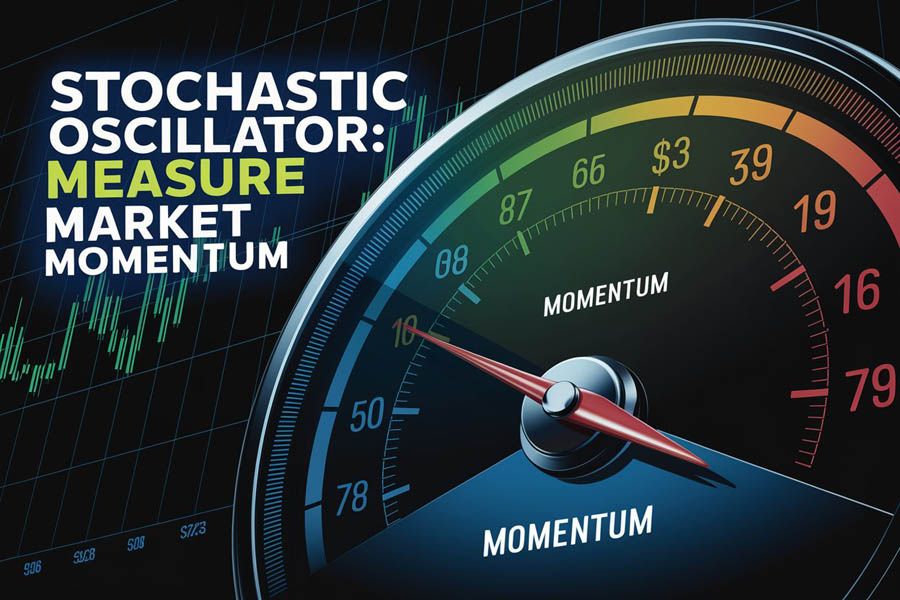
The Stochastic Oscillator has two lines: %K (the fast line) and %D (the slow line). These lines bounce between 0 and 100. When they cross, it can signal a potential trend change. But that’s not all – when these lines move into overbought (above 80) or oversold (below 20) territory, it’s like a yellow traffic light, warning you that the current move might be running out of steam.
Pro tip: Look for divergences between the Stochastic Oscillator and price. If prices are making new highs, but the Stochastic is not, it could be a sign that the uptrend is weakening. It’s like noticing your car isn’t accelerating as fast, even though you’re pressing the gas pedal harder.
Read More: Best Forex Indicators For Day Trading
The Stochastic Oscillator shines in its ability to identify potential turning points in the market, especially when price action is range-bound.
Real-life example: Emma, a cautious trader, always felt she was late to the party in trending markets. After incorporating the Stochastic Oscillator, she caught a great trade on the AUD/USD pair. The pair had been trending down, but Emma noticed the Stochastic Oscillator was showing oversold conditions and starting to turn up. She opened a long position, catching the start of a new uptrend and boosting her trading confidence.
An advanced application of the Stochastic Oscillator is to use it on multiple timeframes. By confirming signals on both longer and shorter timeframes, you can increase the reliability of your trading signals and potentially reduce false positives.
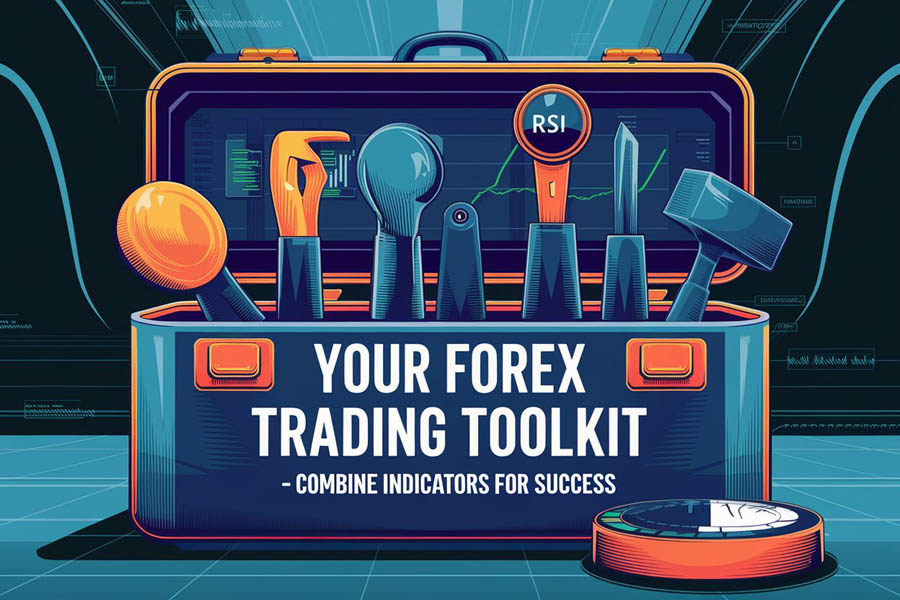
Putting It All Together: Your Forex Trading Toolkit
Now that we’ve unveiled these five powerful indicators, you might be wondering how to use them together. The key is to understand that no single indicator is perfect. They’re like instruments in an orchestra – each plays its part, but the real magic happens when they work in harmony.
Start by using the MACD to identify the overall trend. Then, use the RSI to gauge whether the market is overbought or oversold. Bollinger Bands can give you a sense of market volatility and potential reversal points. Fibonacci retracements can help you find key levels where the market might pause or reverse. Finally, the Stochastic Oscillator can confirm momentum and potential trend changes.
Remember, successful trading isn’t about predicting the future. It’s about making informed decisions based on the information at hand. These indicators are your tools, but you’re the craftsman. With practice and patience, you’ll learn to read the story these indicators are telling and make smarter trading decisions.
The true power of these indicators lies not in using them individually, but in combining them to create a comprehensive trading strategy that suits your personal style and risk tolerance.
It’s also crucial to remember that no indicator is infallible. They are based on past price action and don’t account for future events that could impact the market. Always use these tools in conjunction with fundamental analysis and stay informed about economic events that could affect your trades.
Ready to Put These Indicators to Work? Try OpoFinance!
Now that you’re armed with knowledge about these game-changing indicators, why not put them to the test on a reliable platform? Enter OpoFinance, your gateway to smarter, more informed forex trading.
OpoFinance isn’t just another forex broker. As an ASIC-regulated platform, it offers the security and peace of mind you need to focus on what really matters – making smart trades. But here’s where it gets exciting: OpoFinance offers a unique social trading feature that takes your trading experience to the next level.
Imagine having access to a community of traders, all using these powerful indicators and sharing their insights. With OpoFinance’s social trading platform, you can follow successful traders, see their strategies in action, and even automatically copy their trades if you choose. It’s like having a team of trading mentors at your fingertips!
OpoFinance’s social trading feature allows you to learn from experienced traders, potentially shortening your learning curve and improving your trading results.
But don’t worry if you’re not ready to dive into social trading just yet. OpoFinance provides a user-friendly interface where you can apply all the indicators we’ve discussed and more. Whether you’re a beginner looking to learn or an experienced trader seeking to refine your strategy, OpoFinance has the tools and support you need.
Read More: Your First Steps In Forex: Mastering These 5 Essential Indicators
One of the standout features of OpoFinance is its commitment to education. They offer a wealth of resources, including webinars, tutorials, and market analysis, to help you make the most of these indicators and develop your trading skills.
So why wait? Take the next step in your forex trading journey. Visit OpoFinance today and start turning these indicator insights into real trading success. Remember, in the world of forex, knowledge is power – and with OpoFinance, you’re powering up your trading potential!
Key Takeaways:
- The MACD helps predict trend reversals and momentum shifts.
- RSI identifies overbought and oversold conditions, helping you avoid impulsive trades.
- Bollinger Bands give you a visual representation of market volatility and potential reversal points.
- Fibonacci retracements reveal hidden support and resistance levels based on market psychology.
- The Stochastic Oscillator measures momentum and can signal potential trend changes.
How often should I check these indicators?
It depends on your trading style. For day traders, checking these indicators multiple times a day is common. For swing traders, daily or even weekly checks might suffice. The key is consistency and finding a rhythm that works for you.
Can these indicators guarantee profitable trades?
While these indicators are powerful tools, no indicator can guarantee profits. They provide valuable insights, but successful trading also requires good risk management, emotional control, and continuous learning.
Are there any other important indicators I should know about?
Yes, there are many other useful indicators like the Average Directional Index (ADX), Ichimoku Cloud, and Parabolic SAR. As you grow as a trader, you might want to explore these and find the combination that works best for your trading style.


