Trade with standard conditions for all experience levels
Access deep liquidity and tighter spreads for fast trades
Professional-grade ECN with lower spreads for expert traders
Copy top traders or share strategies with the community
Boost your trading with funded accounts
Advanced ECN with cTrader platform for fast execution
Upgraded ECN features for high-volume and active traders
Easily copy successful traders on the cTrader platform
Compare account features to find the right trading option
Explore deposit and withdrawal options for your transactions
Classic platform with fast execution and essential tools
Multi-asset platform with advanced features for smooth trading
Innovative platform with powerful tools and charting features
Compare trading Platforms to find the best fit for you.
Access TradingView’s charts, real-time data, and tools, all in one platform.
Copy and follow top traders for proven strategies
Join our partnership program to expand your trading opportunities
Trade with funded accounts and increase your profit potential
Use our app for quick, efficient, and accessible trading tools
Our promise of compliance and fund security
Access agreements that support transparent trading operations.
Access our dedicated support for any assistance
In the world of technical analysis, the Keltner Channels vs Bollinger Bands debate is a cornerstone for traders aiming to master market volatility. Both are powerful envelope-based indicators that help
Keltner Channels are a volatility-based technical indicator composed of three lines that help traders identify trends, potential reversals, and overbought or oversold conditions. Unlike other channel indicators, they use the Average
Volume Spread Analysis (VSA) is a powerful methodology that helps traders understand the relationship between price, spread (the bar’s range), and volume to predict market direction. It’s about decoding the
The core difference between Market Profile vs Volume Profile is what they measure: Market Profile charts how much time the price spends at each level, while Volume Profile charts how much volume was traded
The absolute best time for forex scalping is during the London and New York session overlap, from 8:00 AM to 12:00 PM EST. This period offers the highest liquidity and volatility,
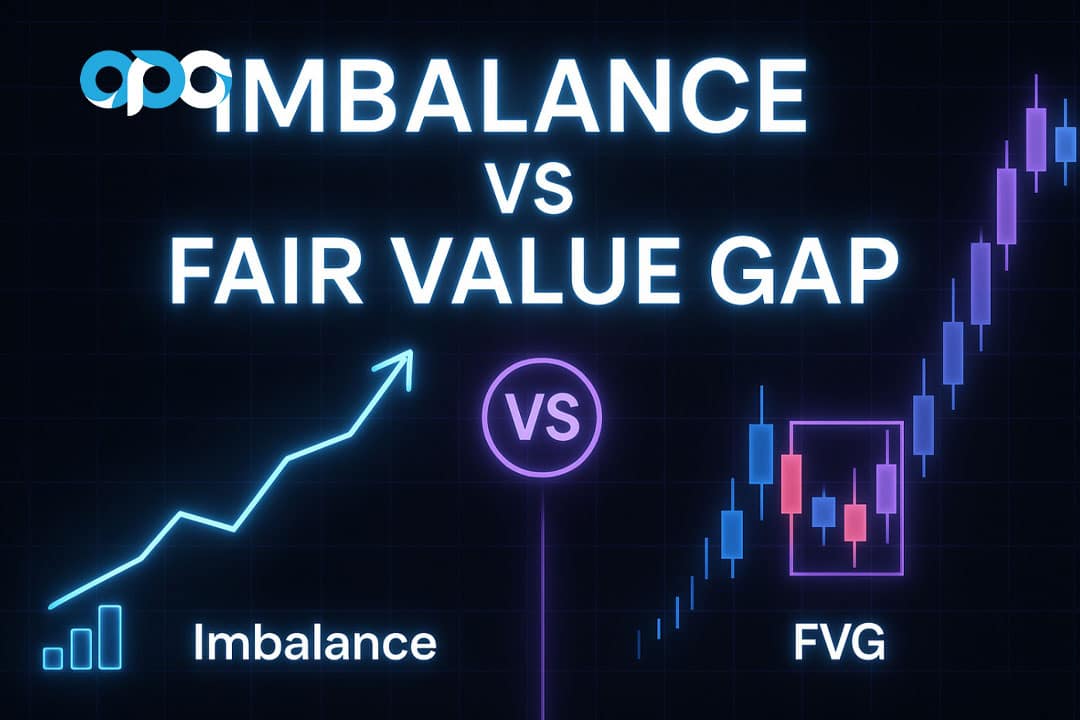
In the world of technical analysis, particularly within Smart Money Concepts (SMC), you’ll constantly hear the terms “imbalance” and “fair value gap.” While many traders use them interchangeably, understanding the
What is POC in trading? Simply put, the Point of Control (POC) represents the price level where the highest volume of trades occurred over a specific period. It is the market’s
A volume profile strategy is a technical analysis approach that reveals where the majority of trading volume has occurred at specific price levels over a set period. Unlike traditional volume indicators that
Opofinance, a regulated, multi-asset brokerage, today announced a strategic partnership with TradingView, the world’s most popular charting platform and social network for traders. This landmark collaboration enables Opofinance clients to
Drop your phone number below and take the first step today.🚀