

In the fast-paced world of short-term trading, finding the best EMA for 5-minute charts can be a game-changer. Exponential Moving Averages (EMAs) are powerful tools that help traders identify trends and make informed decisions. This article, brought to you by a trusted broker for forex, will reveal the top 5 EMAs that professional traders use on 5-minute charts to maximize their profits and minimize risks.

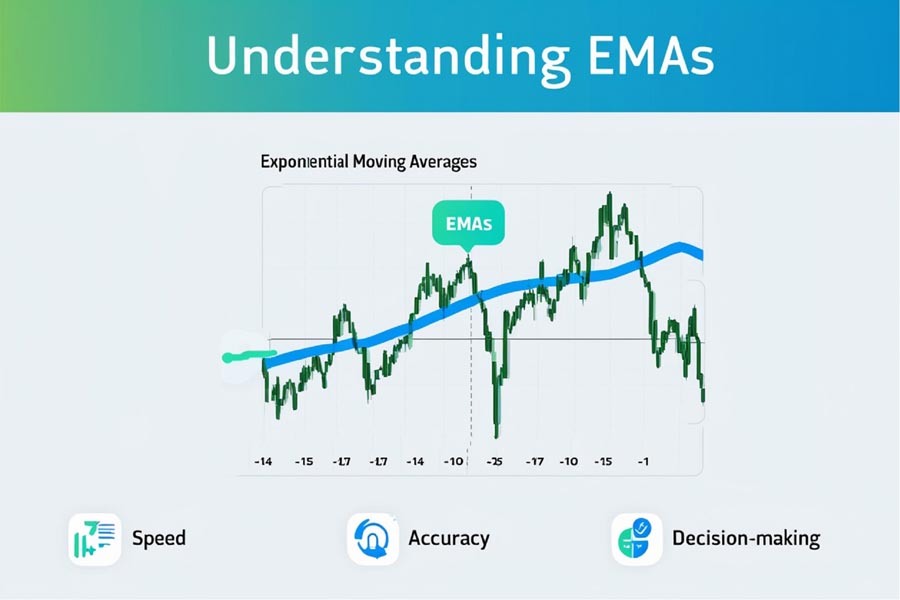
Understanding EMAs and Their Importance
EMAs are popular indicators that smooth out price data, giving more weight to recent prices. They’re especially useful on 5-minute charts, where quick decisions can make or break a trade. The best EMA for 5-minute charts depends on various factors, including your trading style and market conditions.
What Makes EMAs Unique?
Unlike Simple Moving Averages (SMAs), EMAs respond more quickly to recent price changes. This responsiveness makes them particularly valuable for short-term trading on 5-minute charts. EMAs calculate a percentage of the difference between the current price and the previous average, adding this to the previous average. This method gives more weight to recent data, making EMAs more sensitive to new information.
Why 5-Minute Charts?
Five-minute charts strike a balance between providing enough detail for short-term trading and filtering out some of the noise present in even shorter timeframes. They offer a good compromise for day traders and swing traders alike, allowing for multiple trading opportunities throughout the day without the extreme volatility of 1-minute charts.
Read More: 30 minute forex trading strategy
Top 5 EMAs for 5-Minute Charts
1. 9 EMA: The Quick Responder
The 9 EMA is highly responsive to price changes, making it ideal for capturing short-term trends. It’s often used by scalpers and day traders who need to make split-second decisions.
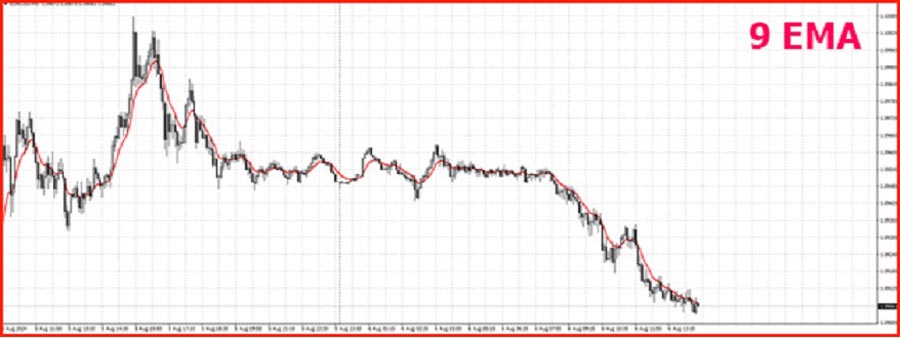
Key Benefits of the 9 EMA:
- Rapid response to price changes
- Excellent for identifying short-term trends
- Useful for pinpointing potential entry and exit points
How to Use the 9 EMA:
- Look for price crosses above or below the 9 EMA as potential trade signals
- Use in combination with other indicators for confirmation
- Be aware of its sensitivity to market noise
Advanced 9 EMA Strategies:
- Use the 9 EMA as a dynamic support/resistance level in strong trends
- Combine with momentum indicators like RSI for enhanced accuracy
- Implement a trailing stop-loss strategy based on the 9 EMA
2. 20 EMA: The Balanced Performer
The 20 EMA strikes a balance between responsiveness and reliability. It’s less prone to false signals than the 9 EMA but still quick enough for short-term trading.
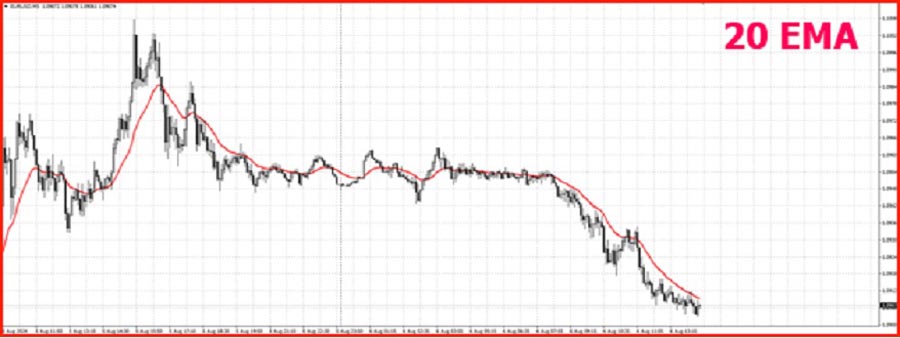
Advantages of the 20 EMA:
- Provides a good balance between speed and accuracy
- Helps filter out some market noise
- Popular among day traders and swing traders
Implementing the 20 EMA:
- Use as a dynamic support and resistance level
- Look for price bounces off the 20 EMA as potential trade opportunities
- Combine with the 9 EMA for crossover signals
Advanced 20 EMA Techniques:
- Use the angle of the 20 EMA to gauge trend strength
- Implement a breakout strategy when price decisively moves away from the 20 EMA
- Combine with volume analysis for more reliable signals
3. 50 EMA: The Trend Confirmer
The 50 EMA is excellent for confirming trends on 5-minute charts. It helps traders avoid false breakouts and identify stronger, more sustainable moves.
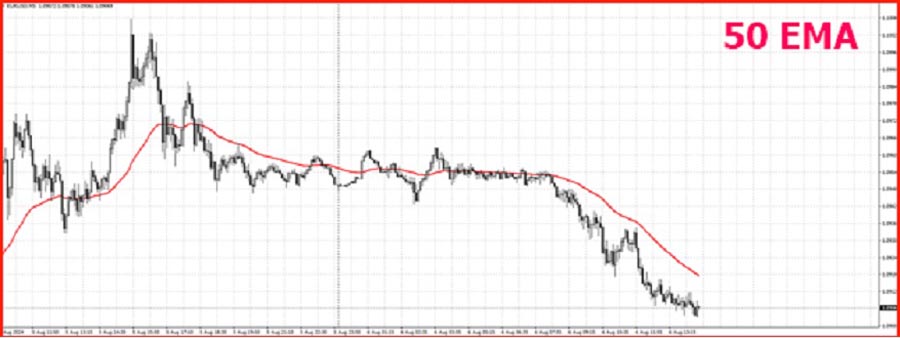
Benefits of the 50 EMA:
- Provides a clearer picture of the overall trend
- Helps distinguish between genuine breakouts and false moves
- Useful for setting stop-loss levels
Strategies for the 50 EMA:
- Use as a trend confirmation tool
- Look for price action around the 50 EMA to identify potential trend reversals
- Combine with shorter-term EMAs for a comprehensive view of market dynamics
Advanced 50 EMA Applications:
- Implement a “zone trading” strategy using the area around the 50 EMA
- Use the 50 EMA crossover with price as a trend reversal signal
- Combine with Fibonacci retracement levels for precise entry points
4. 100 EMA: The Support and Resistance Indicator
The 100 EMA acts as a dynamic support and resistance level on 5-minute charts. It’s particularly useful for swing traders looking for entry and exit points.
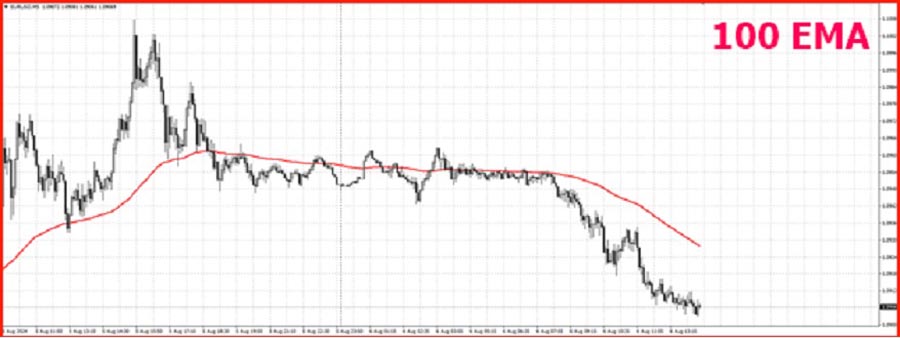
Advantages of the 100 EMA:
- Provides clear support and resistance levels
- Helps identify potential trend reversals
- Useful for longer-term perspective on 5-minute charts
Using the 100 EMA Effectively:
- Look for price reactions when approaching the 100 EMA
- Use as a target for profit-taking in trending markets
- Combine with shorter-term EMAs to identify potential breakout points
Advanced 100 EMA Strategies:
- Implement a “mean reversion” strategy using the 100 EMA as the central point
- Use the distance between price and the 100 EMA to gauge overbought/oversold conditions
- Combine with pivot points for enhanced support and resistance analysis
5. 200 EMA: The Big Picture Perspective
While less common on 5-minute charts, the 200 EMA provides a broader market context. It helps traders align their short-term trades with the overall trend.
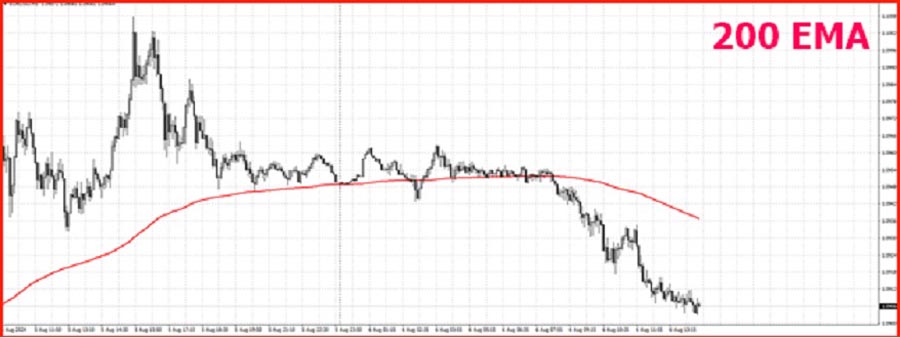
Benefits of the 200 EMA:
- Offers a long-term trend perspective
- Helps identify major support and resistance areas
- Useful for aligning short-term trades with the bigger picture
Implementing the 200 EMA:
- Use as a final confirmation for major trend changes
- Look for divergences between price action and the 200 EMA
- Combine with shorter-term EMAs to identify potential trend exhaustion points
Advanced 200 EMA Techniques:
- Use the 200 EMA as a “line in the sand” for overall market sentiment
- Implement a “trend-following” strategy based on 200 EMA crossovers
- Combine with weekly and monthly chart analysis for a multi-timeframe approach
Read More: 5-Minute Trading Strategy
Combining EMAs for Maximum Effectiveness
Many traders use multiple EMAs together to gain a more comprehensive view of the market. Here are some popular combinations and strategies:
1. 9 and 20 EMA Combination
This combination is perfect for quick trend identification and potential crossover signals.
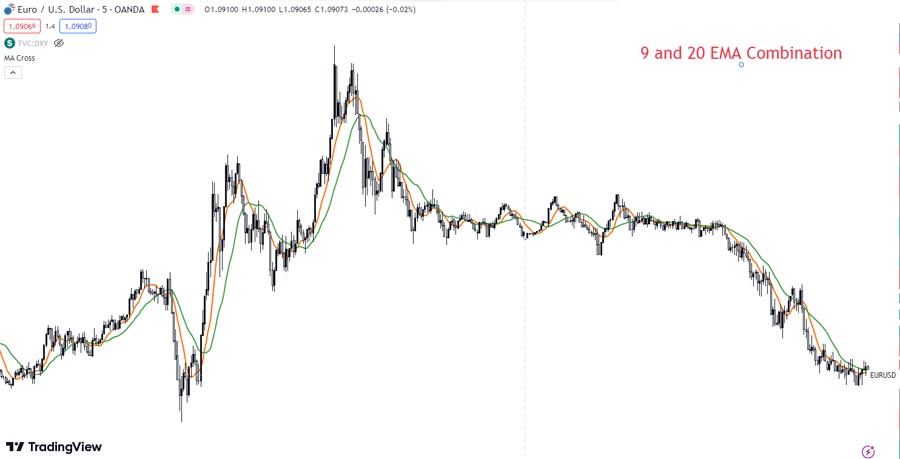
Strategy:
- Look for the 9 EMA crossing above the 20 EMA as a bullish signal
- Watch for the 9 EMA crossing below the 20 EMA as a bearish signal
- Use the space between the two EMAs to gauge trend strength
2. 20 and 50 EMA Combination
This pairing helps confirm trends and spot potential reversals.
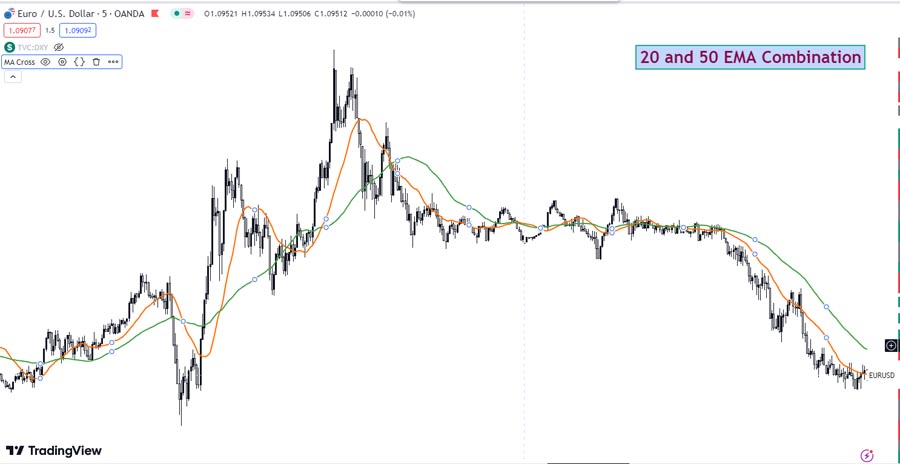
Approach:
- Use the 20 EMA crossing the 50 EMA as a medium-term trend change signal
- Look for price action between the two EMAs to identify potential breakouts
- Use the 50 EMA as a dynamic support/resistance level in trending markets
3. 50 and 200 EMA Combination
This combination is excellent for identifying long-term trend direction on shorter timeframes.
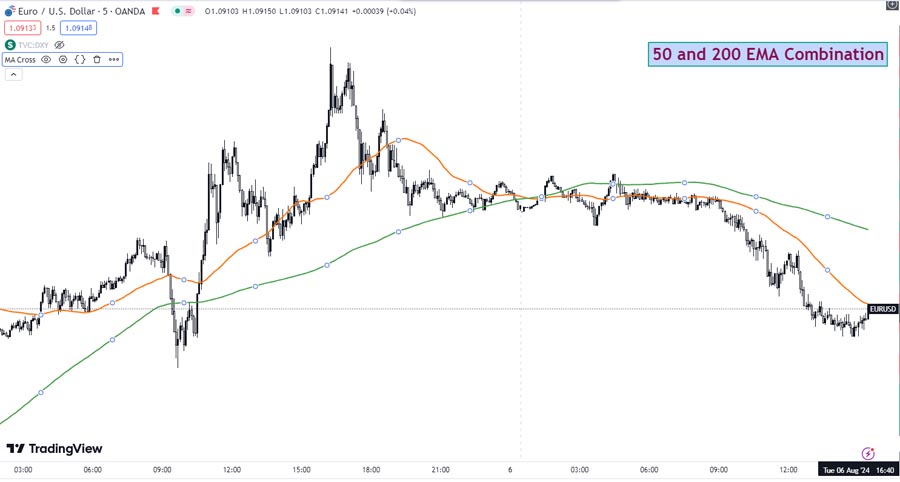
Implementation:
- Use the 50 EMA crossing the 200 EMA (known as the “Golden Cross” or “Death Cross”) as a major trend change signal
- Look for price action around these levels to identify potential long-term support or resistance
- Use this combination to align short-term trades with the overall market direction
Best Moving Average for 5-Minute Charts: EMA vs. SMA
While Simple Moving Averages (SMAs) are also popular, EMAs are generally considered the best moving average for 5-minute charts. EMAs react faster to price changes, which is crucial in short-term trading.
Advantages of EMAs over SMAs:
- Faster response to price changes
- Greater weight given to recent data
- Smoother curves, reducing lag in trend identification
When to Consider SMAs:
- In highly volatile markets where a slower response might filter out noise
- For longer-term trend analysis on higher timeframes
- When looking for more stable support and resistance levels
Implementing EMAs in Your Trading Strategy
To effectively use EMAs on 5-minute charts, consider the following tips:
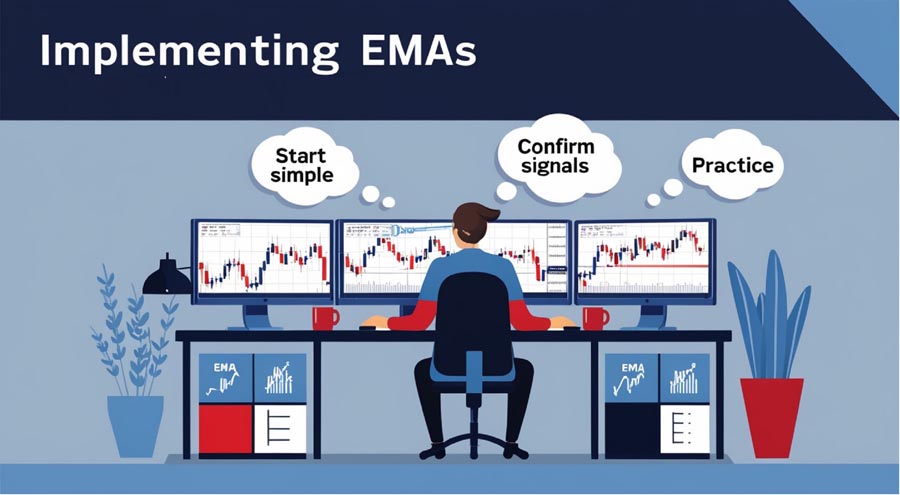
1. Start Simple
Begin with one or two EMAs and gradually add more as you become comfortable. This approach prevents overwhelming yourself with too much information initially.
2. Use Confirmation Techniques
Combine EMAs with other technical indicators for confirmation. Popular choices include:
- Relative Strength Index (RSI)
- Moving Average Convergence Divergence (MACD)
- Stochastic Oscillator
3. Practice on a Demo Account
Before risking real capital, practice your EMA strategy on a demo account. This allows you to refine your approach without financial risk.
4. Adapt to Market Volatility
Be aware of market volatility and adjust your strategy accordingly. In highly volatile markets, you may need to use longer EMA periods or combine them with volatility indicators.
5. Develop a Comprehensive Trading Plan
Incorporate EMAs into a broader trading plan that includes:
- Risk management rules
- Entry and exit criteria
- Position sizing guidelines
- Market analysis techniques
Read More: best 15 minute forex trading strategy
Common Mistakes to Avoid
When using EMAs on 5-minute charts, be wary of these common pitfalls:
1. Over-relying on EMAs
Don’t use EMAs as your sole decision-making tool. Always consider other factors such as fundamental analysis, market sentiment, and broader economic conditions.
2. Analysis Paralysis
Using too many EMAs can lead to conflicting signals and indecision. Stick to a few key EMAs that complement your trading style.
3. Ignoring the Broader Context
While 5-minute charts provide detailed short-term information, always be aware of the bigger picture. Regularly check higher timeframes to ensure your trades align with the overall market direction.
4. Failing to Adapt
Markets evolve, and what works today may not work tomorrow. Continuously evaluate and adjust your EMA strategy based on changing market conditions.
5. Neglecting Risk Management
Even the best EMA strategy can’t guarantee success. Always use proper risk management techniques, including stop-loss orders and position sizing.
Advanced EMA Techniques for 5-Minute Charts
As you become more comfortable with basic EMA strategies, consider these advanced techniques:
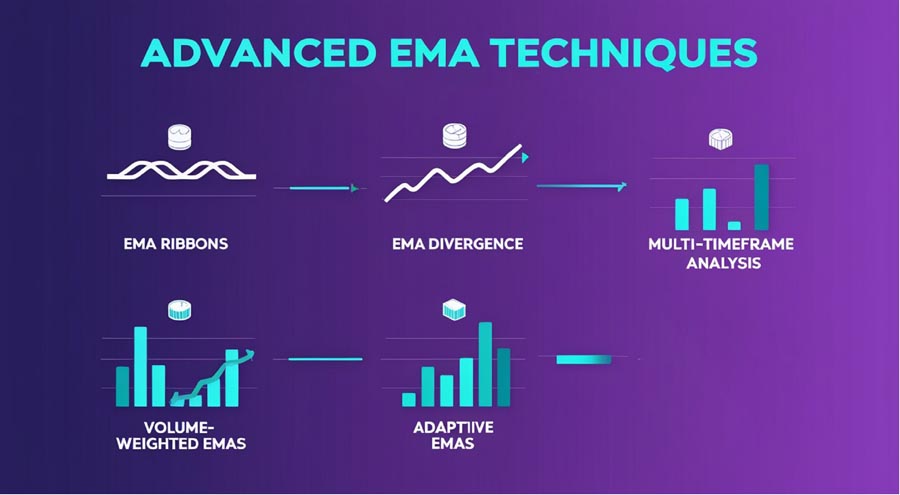
1. EMA Ribbons
Plot multiple EMAs with incrementally larger periods to create an “EMA ribbon.” This can provide a visual representation of trend strength and potential reversals.
2. EMA Divergence
Look for divergences between price action and EMA movements. When price makes new highs or lows that aren’t confirmed by the EMAs, it could signal a potential reversal.
3. Multi-Timeframe Analysis
Use EMAs on multiple timeframes simultaneously. For example, combine 5-minute chart signals with confirmations from 15-minute or 1-hour charts.
4. Volume-Weighted EMAs
Incorporate volume data into your EMA calculations for a more comprehensive view of market dynamics.
5. Adaptive EMAs
Experiment with adaptive EMAs that automatically adjust their periods based on market volatility.
OpoFinance Services: Your Trusted ASIC-Regulated Broker
When it comes to implementing your EMA strategy on 5-minute charts, having a reliable broker is crucial. OpoFinance, an ASIC-regulated broker, offers top-notch trading services tailored to both novice and experienced traders. With their advanced trading platforms, competitive spreads, and exceptional customer support, OpoFinance provides the ideal environment for executing your EMA-based trades.
Key Benefits of Trading with OpoFinance:
- ASIC Regulation: Ensures the highest standards of financial security and transparency
- Advanced Trading Platforms: Access to state-of-the-art charting tools and EMA indicators
- Competitive Spreads: Minimize trading costs and maximize potential profits
- Exceptional Customer Support: Get assistance whenever you need it
- Educational Resources: Enhance your trading skills with comprehensive learning materials
Their commitment to security and transparency ensures that you can focus on your trading strategy without worrying about the safety of your funds. Experience the difference with OpoFinance and take your 5-minute chart trading to the next level.
Conclusion
Finding the best EMA for 5-minute charts is a personal journey that depends on your trading style and goals. By experimenting with the EMAs discussed in this article and combining them effectively, you can develop a powerful trading strategy that suits your needs. Remember to always practice proper risk management and continuously refine your approach based on market conditions and your trading results.
As you continue to explore and refine your EMA strategy on 5-minute charts, keep in mind that successful trading is a combination of technical analysis, fundamental understanding, and psychological discipline. EMAs are powerful tools, but they are most effective when used as part of a comprehensive trading approach.
Stay committed to your learning journey, remain adaptable in the face of changing market conditions, and always prioritize risk management. With dedication and practice, you can master the art of using EMAs on 5-minute charts to enhance your trading performance and achieve your financial goals.
How do I choose the right EMA period for my trading style?
A: Selecting the right EMA period depends on your trading timeframe and risk tolerance. Shorter periods like 9 or 20 are suitable for aggressive, short-term traders, while longer periods like 50 or 100 are better for more conservative traders. Experiment with different periods on a demo account to find what works best for you.
Can I use EMAs on other timeframes besides 5-minute charts?
A: Absolutely! EMAs are versatile indicators that can be applied to any timeframe, from 1-minute charts to daily or weekly charts. The principles remain the same, but you may need to adjust the EMA periods based on the chosen timeframe.
Are there any specific market conditions where EMAs perform better or worse?
A: EMAs tend to perform well in trending markets, providing clear signals for entries and exits. However, they may generate false signals in choppy or sideways markets. It’s essential to use EMAs in conjunction with other indicators and analysis techniques to confirm signals and adapt to different market conditions.


