

Staring at your 5-minute chart, feeling like you’re caught in a whirlwind of fleeting price movements? Are false signals from your indicators leading to more frustration than profit? You’re likely not alone. Many traders find the rapid-fire nature of the 5-minute timeframe challenging, especially when trying to pinpoint reliable entry and exit points. The Relative Strength Index (RSI) is a powerful tool that can offer clarity, but the default settings often fall short in this fast-paced environment.
So, what are the best RSI settings for a 5 minute chart? Generally, a shorter lookback period, often between 5 and 10, combined with adjusted overbought and oversold levels like 80 and 20, tends to perform better. This article will guide you through the optimal RSI parameters for 5-minute trading, empowering you to navigate the noise and potentially enhance your trading outcomes with the assistance of a reputable forex broker. We will explore the specific challenges of this timeframe, delve into effective strategies, and help you sidestep common mistakes. Choosing the right online forex broker is also crucial for executing your strategies effectively.
Introduction to RSI and Its Importance in Short-Term Trading

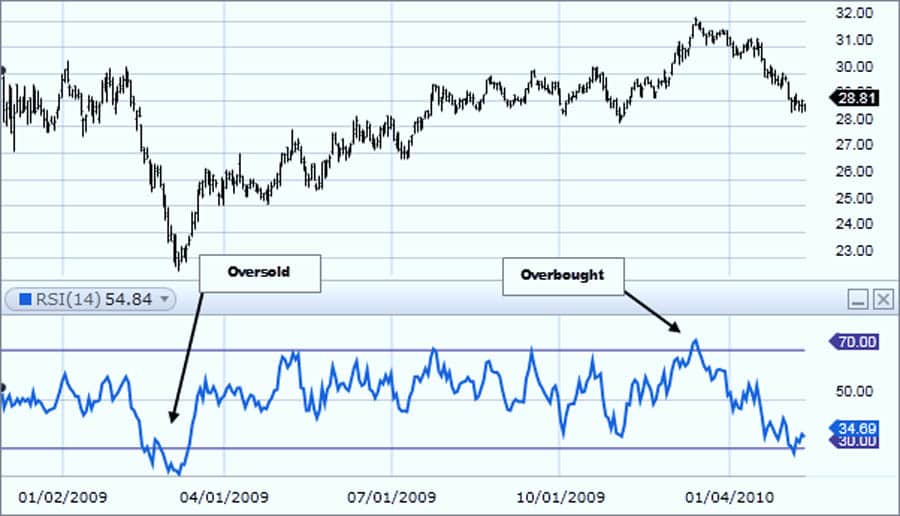
The Relative Strength Index (RSI) is a cornerstone of technical analysis, acting as a momentum oscillator to gauge the velocity and magnitude of recent price changes. Developed by J. Welles Wilder Jr., it oscillates between 0 and 100, providing valuable insights into potential overbought and oversold conditions. Think of it as a gauge that measures the strength behind price movements, helping traders identify potential turning points.
Explanation of RSI as a momentum oscillator
As a momentum oscillator, the RSI doesn’t directly indicate the direction of a trend but rather the strength of that trend. It calculates the ratio of upward price changes to downward price changes over a specific period. When the RSI value is high, it suggests that buying pressure has been dominant, potentially leading to overbought conditions. Conversely, a low RSI value indicates strong selling pressure and potential oversold conditions. This understanding is crucial for anticipating potential reversals or continuations of price movements.
Why RSI is crucial for 5-minute chart trading
In the hyper-sensitive environment of the 5-minute chart, where every second counts, the RSI becomes an indispensable tool. These short timeframes are characterized by rapid price fluctuations and a high volume of trades, making it difficult to discern genuine signals from market noise. The RSI helps traders cut through this noise by highlighting when an asset might be excessively bought or sold in the short term.
This early indication can be invaluable for capturing swift profits and avoiding entries just before a reversal. For day traders and scalpers who thrive on quick entries and exits, mastering the RSI is often a key differentiator between success and frustration. A reliable broker for forex trading is essential for executing these short-term trades efficiently.
Read More: 5-Minute Trading Strategy
Understanding the 5-Minute Chart and Its Unique Challenges
The 5-minute chart is the preferred arena for day traders and scalpers seeking to capitalize on intraday price fluctuations. It offers a highly detailed view of price action, allowing traders to identify and exploit even the smallest market movements. However, this level of detail also presents unique challenges that require specific strategies and indicator settings.
Characteristics of 5-minute charts (volatility, noise, etc.)
The defining characteristics of 5-minute charts are their inherent volatility and susceptibility to market noise. Prices can fluctuate significantly within short periods, driven by news events, order flow, and even algorithmic trading. This rapid price action can create numerous false signals for indicators with longer lookback periods. The increased “noise” refers to random, insignificant price movements that can obscure the underlying trend and lead to misinterpretations. Traders operating on this timeframe need tools that can react quickly and filter out this noise effectively. Choosing the right broker for forex can also impact your ability to navigate this volatility.
Why standard RSI settings may not work for 5-minute charts
The default RSI setting of 14 periods is often too slow to react to the rapid price changes observed on a 5-minute chart. This longer lookback period averages price movements over a broader timeframe, causing the RSI to lag behind significant short-term shifts. Consequently, by the time the standard RSI signals an overbought or oversold condition, the opportunity might have already passed. Furthermore, the increased noise on a 5-minute chart can cause the standard RSI to generate more false positives and negatives, leading to whipsaws and losses. Therefore, adjusting the RSI parameters is crucial for aligning the indicator’s sensitivity with the speed of the 5-minute timeframe. A good forex broker will provide the tools to customize these settings.
Best RSI Settings for 5 Minute Chart
To effectively harness the power of the RSI on a 5-minute chart, you need to adjust its settings to be more responsive to the rapid price fluctuations. The goal is to find a balance that captures genuine momentum shifts while minimizing the impact of market noise. Finding the best rsi settings for 5-minute chart forex is a common goal for day traders.
Recommended RSI period (e.g., 5-10 periods)
Instead of the conventional 14 periods, consider using a shorter RSI period, typically ranging from 5 to 10 periods. A 7 or 9 period RSI often strikes an optimal balance between sensitivity and noise reduction for the 5-minute timeframe. A shorter period makes the RSI more attuned to recent price action, allowing it to react more swiftly to potential reversals and momentum shifts. This increased responsiveness is crucial for capturing timely entries and exits in the fast-paced environment of short-term trading. When considering a broker for forex trading, ensure they offer the flexibility to adjust indicator parameters.
Adjusting overbought/oversold levels (e.g., 70/30 or 80/20)
The default overbought level of 70 and oversold level of 30 might be reached too frequently on a 5-minute chart due to its inherent volatility, leading to a barrage of potentially false signals. To mitigate this, consider adjusting these levels to more extreme values. Setting the overbought level to 80 and the oversold level to 20 can help filter out some of the noise and provide more reliable signals, as it requires stronger price momentum to reach these thresholds.
Alternatively, some traders find success with levels of 75 and 25. The optimal levels can vary slightly depending on the specific asset and market conditions, so experimentation and backtesting are encouraged. A regulated forex broker will provide a stable platform for testing these settings.
Benefits of shorter RSI periods for responsiveness
The primary advantage of using shorter RSI periods on a 5-minute chart is enhanced responsiveness. A shorter lookback period means the RSI calculation is based on fewer recent price bars, making it more sensitive to immediate price changes. This allows traders to identify potential turning points earlier, potentially leading to more profitable entry and exit points. By reacting quickly to shifts in momentum, traders can capitalize on short-term opportunities that might be missed with slower RSI settings. This responsiveness is a key factor in successfully navigating the volatility of the 5-minute timeframe. Choosing the right online forex broker can further enhance your ability to react quickly to market changes.
Read More: What is RSI Indicator
How to Set Up RSI for 5-Minute Trading
Configuring the RSI indicator on your trading platform is a straightforward process that can significantly impact your trading effectiveness on the 5-minute chart. Understanding how to properly set up and customize the RSI is a fundamental skill for any short-term trader.
Step-by-step guide to configuring RSI on popular platforms (TradingView, MetaTrader)
The process for setting up the RSI is similar across most popular trading platforms:
- TradingView: Open your desired chart, click on the “Indicators” button at the top of the screen, search for “Relative Strength Index,” and select it. Once the indicator is added to your chart, hover over the RSI indicator name and click on the “Settings/Format” (gear) icon. In the settings window, you can adjust the “Length” (which corresponds to the RSI period) and the “Upper Band” and “Lower Band” (for overbought and oversold levels, respectively).
- MetaTrader (MT4/MT5): Go to the “Insert” menu, then select “Indicators,” then “Oscillators,” and finally choose “Relative Strength Index.” In the indicator settings window, you can modify the “Period” (RSI period), “Apply to” (typically set to “Close”), and the “Levels” tab where you can customize the overbought and oversold thresholds.
Remember to apply your chosen settings (e.g., a period of 7 or 9, and overbought/oversold levels of 80/20) and click “OK” to apply the changes to your chart.
Importance of backtesting settings before live trading
Before deploying any new RSI settings in your live trading, it is absolutely crucial to backtest them using historical price data. Backtesting allows you to simulate how your chosen settings would have performed in the past, providing valuable insights into their potential effectiveness and identifying any potential weaknesses. This process helps you gain confidence in your strategy and avoid costly mistakes when trading with real capital. Most trading platforms offer backtesting capabilities, allowing you to define entry and exit rules based on RSI signals and evaluate their historical performance. This step is non-negotiable for responsible and informed trading. A reliable broker for forex will often provide historical data for backtesting.
Combining RSI with Other Indicators for Better Accuracy
While the RSI is a powerful indicator in its own right, its effectiveness on the 5-minute chart can be significantly enhanced by combining it with other technical analysis tools. This confluence of signals can help filter out false positives and provide higher-probability trading setups. Using the optimal RSI parameters for 5-minute trading is just one piece of the puzzle.
Using moving averages, MACD, or trendlines to confirm RSI signals
Combining the RSI with other indicators can provide valuable confirmation for your trading signals:
- Moving Averages: Use moving averages (like the 20-period Exponential Moving Average – EMA) to identify the prevailing trend. Only consider RSI buy signals when the price is trading above the moving average and sell signals when the price is below it. This helps align your trades with the dominant trend and filter out counter-trend signals.
- MACD (Moving Average Convergence Divergence): Look for divergence or convergence between the RSI and the MACD. For example, if the RSI is showing an overbought condition while the MACD is about to make a bearish crossover, it strengthens the sell signal. Conversely, oversold RSI combined with a bullish MACD crossover can signal a potential buying opportunity.
- Trendlines: Draw trendlines to identify the direction of the trend and potential support and resistance levels. Use the RSI to confirm potential breakouts or bounces off these trendlines. For instance, if the price is bouncing off an upward trendline and the RSI is moving out of oversold territory, it provides a stronger buy signal.
Example of a multi-indicator strategy for 5-minute charts
A practical example of a multi-indicator strategy for 5-minute charts involves using a 9-period RSI with overbought/oversold levels set at 80 and 20, combined with a 20-period Exponential Moving Average (EMA).
- Buy Signal: The price crosses above the 20-period EMA, and simultaneously, the RSI moves above the 20 level, indicating a potential shift in momentum to the upside.
- Sell Signal: The price crosses below the 20-period EMA, and concurrently, the RSI moves below the 80 level, suggesting a potential shift in momentum to the downside.
This combination helps to confirm the direction of the trend and filter out some of the inherent noise present on the 5-minute chart, leading to potentially more reliable trading signals. Remember to always practice proper risk management when implementing any trading strategy.
Common Mistakes to Avoid When Using RSI on 5-Minute Charts
Even with the best RSI settings for 5-minute trading, traders can fall prey to common mistakes that can hinder their profitability. Awareness of these pitfalls is crucial for maximizing the effectiveness of the RSI and avoiding unnecessary losses.
Read More: Best ema settings for 5 minute chart
Over-reliance on RSI without confirmation
One of the most frequent errors traders make is relying solely on RSI signals without seeking confirmation from other sources. The RSI, like any other indicator, is not infallible and can generate false signals, especially on the volatile 5-minute timeframe. Treating RSI signals as standalone triggers without considering price action, trend analysis, or other confirming indicators can lead to numerous losing trades. Always look for confluence with other technical tools or fundamental analysis before making trading decisions based on RSI alone. Remember, the optimal rsi parameters for 5-minute trading are just one tool in your arsenal.
Ignoring market context (trending vs. ranging markets)
The effectiveness of the RSI can vary significantly depending on the prevailing market conditions. In strongly trending markets, the RSI can be highly effective at identifying pullbacks and potential continuation patterns. However, in ranging or sideways markets, the RSI can oscillate between overbought and oversold levels without a clear directional bias, leading to whipsaws and frustration. It’s crucial to assess the overall market context before interpreting RSI signals. Strategies that work well in trending markets might need adjustments or should be avoided altogether in ranging conditions. Understanding whether the market is trending or ranging is a fundamental aspect of successful RSI application.
Tips for Optimizing RSI Settings for Different Market Conditions
The “best” RSI settings for 5-minute trading are not set in stone. They can and should be adjusted based on the prevailing market conditions and the specific characteristics of the assets you are trading. Adaptability is key to maximizing the effectiveness of the RSI.
Adjusting RSI settings during high volatility
During periods of heightened market volatility, such as around major news announcements or unexpected events, the price action can become erratic and prone to sharp, sudden movements. In such conditions, you might consider making slight adjustments to your RSI settings to avoid being prematurely triggered by short-lived price spikes. One approach is to widen the overbought and oversold levels slightly, perhaps to 85 and 15, to require stronger momentum for the RSI to reach these thresholds. Another option is to slightly increase the RSI period, for example, from 7 to 9, to smooth out some of the extreme fluctuations and reduce sensitivity to noise. Experimentation and observation are key to finding the optimal adjustments for high-volatility periods.
Tailoring RSI for specific assets (e.g., forex, crypto, stocks)
Different asset classes exhibit varying degrees of volatility and price behavior. What works effectively for a highly volatile cryptocurrency might not be optimal for a more stable stock or a less volatile forex pair. It’s essential to tailor your RSI settings to the specific assets you are trading. For instance, currency pairs with higher liquidity and tighter spreads might respond well to slightly shorter RSI periods, allowing you to capture smaller, more frequent price movements.
Conversely, less liquid assets or those prone to sudden spikes might benefit from slightly longer periods to filter out noise and provide more reliable signals. Thorough backtesting on each specific asset is crucial for identifying the RSI parameters that yield the best results. Remember that the best rsi settings for 5 minute chart forex might differ from those for other asset classes.
Backtesting and Validating Your RSI Strategy
Backtesting is an indispensable step in developing and refining any trading strategy, including those utilizing the RSI on a 5-minute chart. It provides empirical evidence of how your chosen settings and strategy would have performed historically, allowing you to assess its viability and identify potential weaknesses before risking real capital.
Importance of historical data for testing RSI settings
Utilizing historical price data to test your RSI settings allows you to simulate trading scenarios and evaluate the potential profitability, win rate, drawdown, and other key performance metrics of your strategy. By applying your entry and exit rules to past market conditions, you can gain valuable insights into how the strategy performs under different market dynamics, including trending and ranging periods, as well as periods of high and low volatility. This process helps you build confidence in your approach and identify areas for improvement before deploying it in live trading. Access to reliable historical data is crucial for effective backtesting.
Tools and platforms for backtesting 5-minute RSI strategies
Most reputable trading platforms, including TradingView and MetaTrader, offer robust built-in backtesting tools. These tools allow you to define your trading rules based on RSI signals and other indicators, specify the timeframe and historical period for testing, and then run simulations to evaluate the strategy’s performance. Pay close attention to metrics such as the profit factor, maximum drawdown, average trade duration, and the total number of trades executed during the backtesting period. Analyzing these metrics will provide a comprehensive understanding of the strengths and weaknesses of your 5-minute RSI strategy and help you make informed decisions about its implementation. Leveraging these tools is essential for validating your approach.
Opofinance Services
For traders looking to implement their 5-minute chart RSI strategies, a reliable and regulated broker is essential. Opofinance, an ASIC regulated broker, offers a robust platform and services tailored to the needs of active traders.
- ASIC Regulated: Trade with confidence knowing Opofinance adheres to the strict regulatory standards of the Australian Securities and Investments Commission (ASIC).
- Featured on MT5 Brokers List: Access the powerful MetaTrader 5 platform, a favorite among experienced traders, where Opofinance is officially recognized.
- Safe and Convenient Deposits and Withdrawals: Enjoy secure and efficient methods for funding your account and accessing your profits.
- Explore Social Trading: Potentially enhance your trading by learning from and copying the strategies of experienced traders on the Opofinance platform.

Ready to take your 5-minute chart trading to the next level? Visit opofinance.com to learn more and open an account today!
Conclusion: Mastering RSI for 5-Minute Trading Success
Successfully utilizing the RSI on a 5-minute chart requires a combination of understanding the indicator’s mechanics, adapting its settings to the specific timeframe, and integrating it with other analysis techniques. By employing shorter RSI periods and adjusting overbought/oversold levels, you can significantly enhance the responsiveness and accuracy of your trading signals in the fast-paced world of short-term trading. Remember that consistent profitability stems from a well-defined strategy, disciplined execution, and continuous refinement of your approach.
Key Takeaways
- For optimal performance on 5-minute charts, consider RSI periods between 5 and 10.
- Adjust overbought/oversold levels to 80/20 or 75/25 to minimize false signals.
- Always seek confirmation from other indicators before acting on RSI signals.
- Thorough backtesting is crucial for validating your RSI strategy.
- Adapt your RSI settings based on prevailing market conditions and the specific assets you trade.
Can I use the same RSI settings for all currency pairs on a 5-minute chart?
While a shorter RSI period between 5 and 10 is generally recommended for 5-minute charts, the optimal settings can vary slightly depending on the specific volatility characteristics of individual currency pairs. It’s advisable to backtest your chosen settings on each currency pair you intend to trade to fine-tune them for optimal performance. Some pairs might exhibit more erratic price action and benefit from slightly different adjustments to the overbought/oversold levels.
How frequently should I expect RSI to generate trading signals on a 5-minute chart with optimized settings?
Using shorter RSI periods and adjusted overbought/oversold levels on a 5-minute chart will naturally lead to more frequent trading signals compared to using default settings on longer timeframes. However, the exact frequency will depend on the prevailing market volatility and the specific asset being traded. It’s crucial to remember that the quality of the signals is more important than the quantity. Focus on identifying high-probability setups that align with your overall trading strategy rather than chasing every signal generated by the RSI.
What is the impact of broker spreads on the profitability of an RSI strategy on a 5-minute chart?
Broker spreads can have a significant impact on the profitability of short-term trading strategies employed on a 5-minute chart, where traders aim to capture small price movements. Wider spreads can erode potential profits and even turn winning trades into losing ones. Therefore, selecting a broker with tight spreads is particularly important for traders utilizing RSI strategies on this timeframe. The cost of each trade, represented by the spread, directly affects the net profitability of your strategy.


