Did you know that traders who master the combination of Elliott Wave and RSI indicators can significantly outperform the market? In the competitive arena of forex trading, leveraging these powerful tools can provide a decisive edge. This comprehensive guide explores the synergy between Elliott Wave and RSI, including elliott wave and rsi divergence and how RSI and Elliott Wave work together to optimize your trading strategies. Whether you’re using a regulated forex broker like Opofinance or exploring new analytical techniques, understanding this integration is crucial for achieving consistent trading excellence. Unlock the secrets to precise market predictions and enhanced trading strategies in this comprehensive guide.

Overview of Elliott Wave Theory
Elliott Wave Theory is a cornerstone in technical analysis, offering a framework to predict market trends through wave patterns. Developed in the 1930s by Ralph Nelson Elliott, this theory has stood the test of time, becoming a fundamental tool for traders worldwide. By recognizing the natural ebb and flow of market sentiments, traders can anticipate future price movements with greater accuracy.
Overview of Relative Strength Index (RSI)
The Relative Strength Index (RSI) is a momentum oscillator that measures the speed and change of price movements, helping traders identify overbought or oversold conditions. RSI is crucial for gauging market momentum and making informed trading decisions. It provides insights into the strength of a trend and potential reversal points, complementing the wave-based analysis of Elliott Wave Theory.
Purpose of Combining Elliott Wave and RSI
By merging Elliott Wave with RSI, traders can enhance their market predictions, validate wave counts, and identify potential reversals with greater accuracy. This powerful combination allows for a more nuanced analysis of market movements, maximizing trading success. The integration leverages the structural insights of Elliott Wave with the momentum signals of RSI, creating a robust analytical framework.
Read More: elliott wave and macd
Understanding Elliott Wave Theory

Definition and Historical Background
Developed by Ralph Nelson Elliott in the 1930s, Elliott Wave Theory posits that market prices unfold in predictable patterns called waves. Elliott observed that investor psychology tends to follow repetitive cycles, influenced by external factors and collective behavior. This theory integrates aspects of psychology and mathematics to map out market sentiment and price movements.
Key Components: Impulse and Corrective Waves
Key Components of Elliott Wave Theory:
- Impulse Waves: Drive the market in the direction of the trend.
- Corrective Waves: Move against the prevailing trend, correcting the impulse waves.
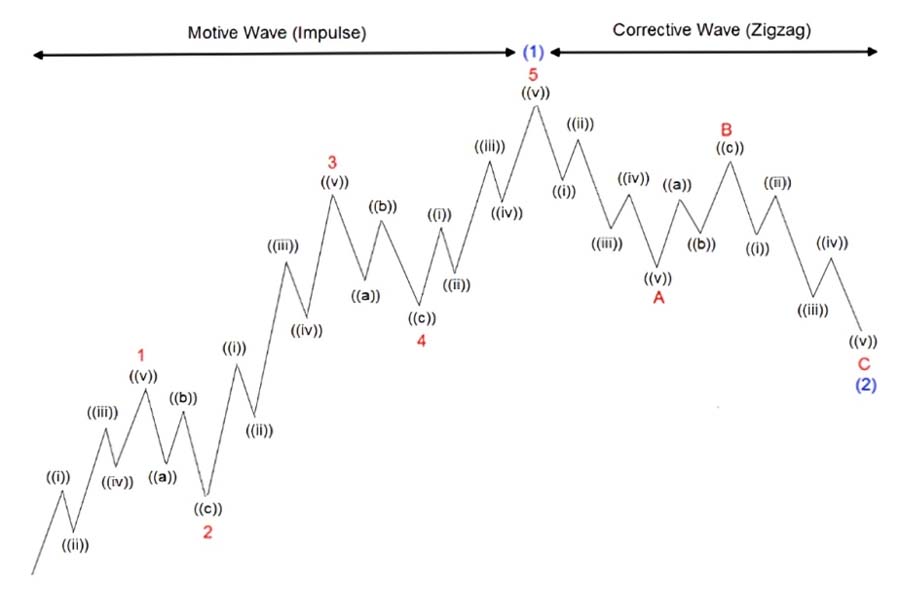
Understanding these wave types is essential for mapping out market structures and predicting future movements.
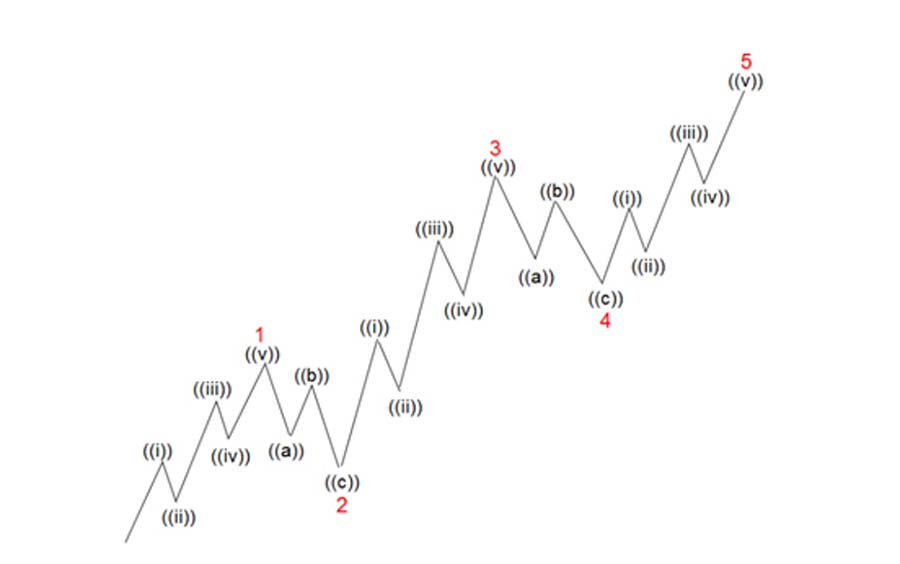
Impulse Waves
Impulse waves are characterized by strong, sustained moves in the direction of the prevailing trend. They consist of five sub-waves (three motive and two corrective) and are responsible for establishing the primary trend.
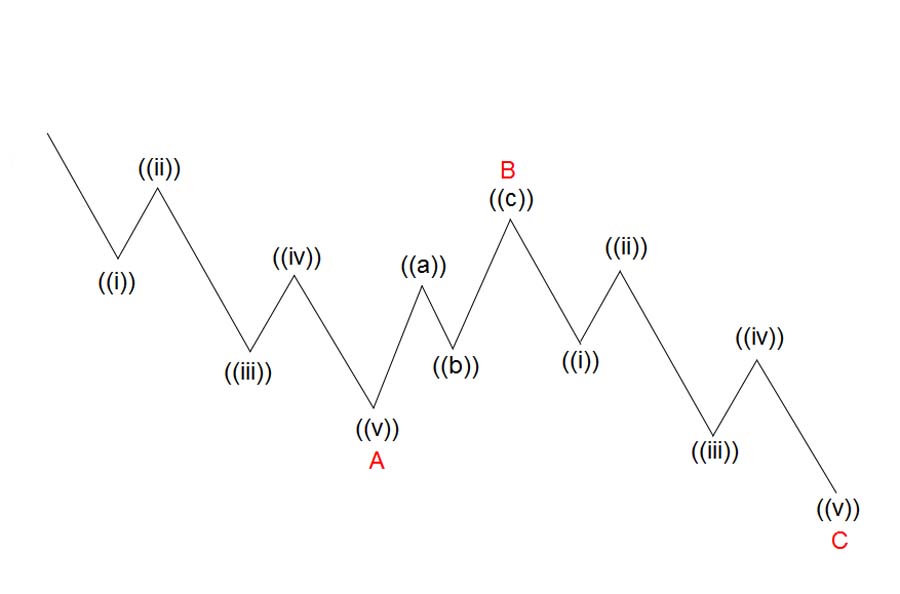
Corrective Waves
Corrective waves counteract the trend established by impulse waves. They typically consist of three sub-waves and help in consolidating or retracing the progress made by impulse waves.
Application in Market Trend Analysis
Traders use Elliott Wave patterns to forecast future market movements by identifying the likely progression of waves. For example, recognizing a five-wave impulse pattern can signal the continuation of a trend, while a three-wave corrective pattern may indicate a temporary reversal. This application allows traders to make informed decisions based on the anticipated direction of the market.
Historical Application Example
During the 2008 financial crisis, Elliott Wave Theory helped traders anticipate significant market downturns by identifying the formation of corrective waves. By recognizing the wave patterns early, traders were able to position themselves advantageously, minimizing losses and capitalizing on market rebounds.
Understanding Relative Strength Index (RSI)

Definition and Calculation Methodology
RSI is calculated using the formula:

This calculation helps determine the momentum behind price movements, providing insights into potential trend reversals. RSI values range from 0 to 100, offering a clear indication of market momentum.
Read More: elliott wave and trendline
Interpretation of RSI Values: Overbought and Oversold Conditions
- Overbought: RSI above 70 indicates a potential price reversal.
- Oversold: RSI below 30 suggests a possible upward correction.
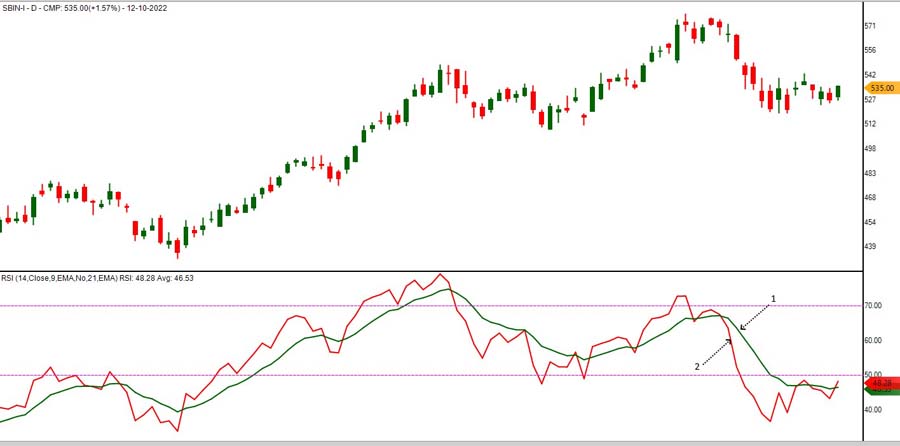
These thresholds help traders identify optimal entry and exit points, enhancing trading efficiency.
Extended RSI Thresholds
Some traders adjust RSI thresholds based on market conditions:
- Extreme Overbought: RSI above 80 may signal an imminent reversal.
- Extreme Oversold: RSI below 20 could indicate a strong buying opportunity.
Role of RSI in Momentum Analysis
RSI helps traders gauge the strength of a trend, identifying potential entry and exit points based on momentum shifts. For instance, an RSI value consistently above 50 may indicate a strong bullish trend, while values below 50 could signal bearish momentum. This role is pivotal in confirming the direction and strength of market movements.
RSI in Action: A Hypothetical Scenario
Imagine a trader observes that the RSI of EUR/USD has dropped below 30, indicating an oversold condition. Concurrently, Elliott Wave analysis reveals the completion of a corrective wave. Combining these signals, the trader decides to enter a long position, anticipating a market reversal and capitalizing on the upcoming bullish trend.
Synergizing Elliott Wave and RSI
Identifying Wave Patterns Using RSI Divergences
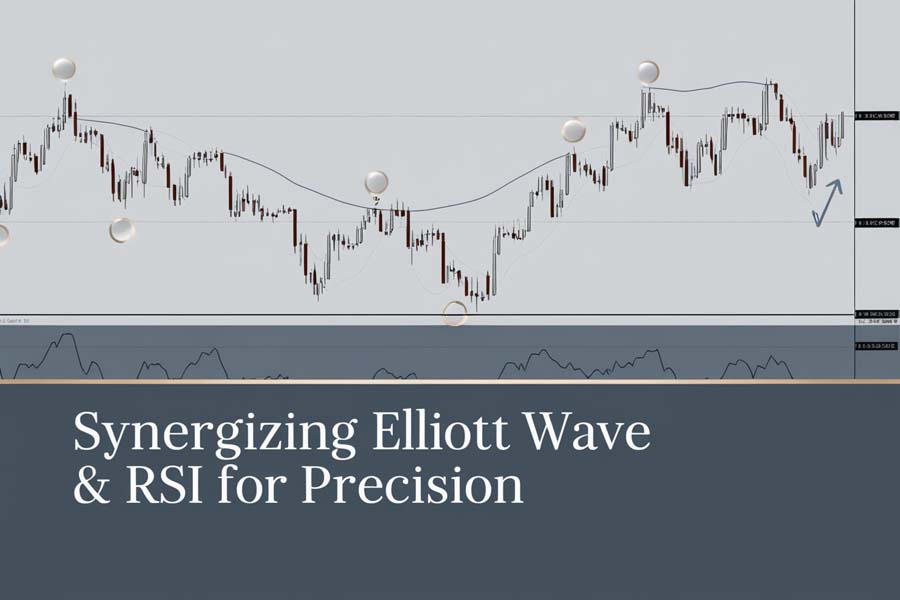
Divergences between RSI and price movements can signal the end of a wave pattern, providing early warnings for potential reversals. For example, if the price forms a new high but RSI fails to do so, it may indicate weakening momentum and the possible termination of an impulsive wave. This divergence serves as a critical indicator for anticipating market shifts.
Types of Divergences
- Regular Divergence: Indicates potential trend reversals.
- Bullish Divergence: Price makes a lower low while RSI makes a higher low.
- Bearish Divergence: Price makes a higher high while RSI makes a lower high.
- Hidden Divergence: Suggests trend continuation.
- Bullish Hidden Divergence: Price makes a higher low while RSI makes a lower low.
- Bearish Hidden Divergence: Price makes a lower high while RSI makes a higher high.
Confirming Wave Counts with RSI Signals
RSI can validate the accuracy of Elliott Wave counts, ensuring that the identified wave structures align with momentum indicators. If an Elliott Wave count suggests the completion of a wave, an RSI signal confirming overbought or oversold conditions can reinforce the wave count’s validity. This confirmation increases the reliability of trading signals derived from wave analysis.
Practical Validation Example
A trader identifies the fifth impulsive wave in a bullish trend using Elliott Wave Theory. RSI simultaneously reaches an overbought level above 70, confirming the wave count and signaling a potential reversal. This dual confirmation allows the trader to confidently execute a short position or secure profits from the existing long position.
Enhancing Accuracy in Predicting Market Reversals
The combination of Elliott Wave and RSI allows for more precise predictions, reducing the likelihood of false signals and improving trade outcomes. By cross-referencing wave patterns with RSI indicators, traders can better anticipate market reversals and adjust their strategies accordingly. This enhanced accuracy is key to successful trading.
Integrated Analysis Example
During an ongoing bullish trend, a trader notices the formation of an Elliott Wave corrective pattern (ABC). Concurrently, RSI begins to show bearish divergence, with price making higher highs while RSI fails to reach new highs. This integrated analysis suggests a high probability of a trend reversal, prompting the trader to tighten stop-loss levels or prepare for a potential short entry.
Read More: Elliott Wave and Fibonacci
Practical Applications

Case Studies Demonstrating Combined Analysis
- Case Study 1: Utilizing RSI Divergence to Confirm the Termination of an Impulsive Wave.
In this scenario, the trader identifies an impulsive wave reaching its fifth wave using Elliott Wave Theory. RSI divergence occurs as the RSI fails to reach a new high alongside the price, signaling a potential reversal. The trader acts by entering a short position, anticipating a decline. This strategy helped the trader capitalize on the market reversal, resulting in substantial profits.
- Case Study 2: Applying RSI Signals to Validate Corrective Wave Patterns.
Here, a corrective wave is identified within a larger trend. RSI moves into oversold territory, aligning with the corrective wave’s completion. The trader uses this confirmation to enter a long position, expecting the trend to resume. This approach minimized losses during the correction and positioned the trader for gains when the bullish trend continued.
Step-by-Step Guide to Applying Both Tools in Trading Decisions
- Identify the Wave Pattern: Use Elliott Wave to map out the current market structure.
- Analyze RSI Indicators: Check RSI for overbought or oversold conditions.
- Look for Divergences: Spot any discrepancies between RSI and price movements.
- Validate with Additional Indicators: Use other technical tools (e.g., moving averages) for confirmation.
- Make Informed Decisions: Use the combined insights to enter or exit trades.
- Implement Risk Management: Set stop-loss and take-profit levels based on wave and RSI signals.
- Review and Adjust: Continuously monitor the trade and adjust strategies as needed.
This systematic approach ensures that trading decisions are based on robust, multi-faceted analysis.
Common Pitfalls and How to Avoid Them
- Overreliance on Indicators: Avoid using Elliott Wave and RSI in isolation. Always consider other factors such as market news and broader trends.
- Ignoring Market Context: Always consider broader market trends and news to provide context to technical indicators.
- Misinterpreting Signals: Ensure proper understanding of wave structures and RSI readings to avoid incorrect conclusions.
- Overcomplicating Analysis: Keep the analysis straightforward to prevent confusion and decision paralysis.
- Neglecting Risk Management: Always implement risk management strategies to protect against unexpected market movements.
Awareness of these pitfalls and proactive strategies to mitigate them can significantly enhance trading performance.
Advanced Strategies
Utilizing RSI to Pinpoint Wave Terminations
Advanced traders use RSI to identify precise points where waves are likely to conclude, optimizing entry and exit points. For instance, an RSI peak aligning with the end of an impulsive wave can signal the optimal moment to secure profits or adjust positions. This precision aids in maximizing trading efficiency and profitability.
Advanced Termination Techniques
- RSI Exhaustion: Identifying extreme RSI values (e.g., above 80 or below 20) as potential wave termination points.
- RSI Swing Failures: Recognizing RSI failing to sustain new highs or lows despite price movements, indicating possible wave completions.
- Multi-Timeframe RSI Analysis: Using RSI signals across different timeframes to confirm wave terminations.
Incorporating Fibonacci Retracements with Elliott Wave and RSI
Combining Fibonacci levels with Elliott Wave and RSI enhances the accuracy of predicting support and resistance levels. For example, applying Fibonacci retracement to a corrective wave can identify key levels where RSI might signal overbought or oversold conditions, providing actionable trading signals. This integration offers a more comprehensive analytical framework.
Practical Integration Example
A trader identifies a corrective wave (ABC) within an uptrend using Elliott Wave Theory. Applying Fibonacci retracement to the corrective wave reveals key retracement levels (e.g., 38.2%, 50%, 61.8%). Simultaneously, RSI reaches oversold levels at the 50% retracement, confirming a potential continuation of the uptrend. The trader enters a long position at this juncture, anticipating the resumption of the bullish trend.
Developing a Trading Plan Based on Combined Analysis
Create a comprehensive trading plan that integrates Elliott Wave patterns, RSI indicators, and other relevant tools to guide your trading strategy. This plan should include:
- Risk Management: Define your risk tolerance and set stop-loss levels accordingly.
- Entry and Exit Criteria: Establish clear rules based on wave patterns and RSI signals.
- Performance Review: Regularly assess the effectiveness of your strategies and make necessary adjustments.
- Diversification: Apply combined analysis across different asset classes to spread risk.
- Continuous Improvement: Update your trading plan based on market changes and new insights.
A well-structured trading plan ensures disciplined and consistent trading practices.
Pro Tips
- Stay Disciplined: Adhere to your trading plan and avoid emotional decisions.
- Continuous Learning: Regularly update your knowledge on market trends and analytical techniques.
- Use Multiple Timeframes: Analyze charts across different timeframes for a holistic view.
- Backtest Strategies: Test your combined Elliott Wave and RSI strategies on historical data to evaluate their effectiveness.
- Stay Updated with Market News: Incorporate fundamental analysis to complement your technical strategies.
- Leverage Technology: Use advanced trading platforms and tools to enhance your analysis and execution.
- Maintain a Trading Journal: Document your trades, strategies, and outcomes to identify patterns and areas for improvement.
These pro tips can help advanced traders refine their strategies and achieve sustained success.
Opofinance Services
For traders seeking a reliable and regulated partner, Opofinance stands out as an ASIC-regulated forex broker. Opofinance offers exceptional social trading services, allowing you to mirror the strategies of successful traders. Being officially featured on the MT5 brokers list, Opofinance ensures seamless and secure trading experiences with safe and convenient deposit and withdrawal methods. Whether you’re engaging in forex trading or exploring advanced trading strategies, Opofinance provides the tools and support you need to succeed.

Unique Features of Opofinance:
- Social Trading Service: Connect with and replicate the trades of experienced traders, enabling you to learn and profit from their strategies.
- MT5 Platform Integration: Access advanced trading tools and analytics on the robust MT5 platform, enhancing your technical analysis capabilities.
- Secure Transactions: Enjoy peace of mind with safe and convenient deposit and withdrawal methods, ensuring your funds are always protected.
- Regulated Environment: Trade confidently with an ASIC-regulated broker ensuring compliance and security, safeguarding your investments.
- Educational Resources: Benefit from a wealth of educational materials and resources to improve your trading knowledge and skills.
- Customer Support: Receive dedicated support from a professional team, ready to assist you with any trading-related inquiries or issues.
Join Opofinance today to leverage advanced trading tools and expert support, enhancing your Elliott Wave and RSI trading strategies.
User Testimonials
“Opofinance’s social trading service has transformed my trading approach. Being able to follow and replicate the strategies of top traders has significantly boosted my profits.”
— Sarah M., Experienced Trader
“The MT5 platform provided by Opofinance offers unparalleled analytical tools. Combining Elliott Wave and RSI on this platform has made my market predictions more accurate than ever.”
— John D., Forex Enthusiast
Ready to elevate your trading strategies? Join Opofinance today to access cutting-edge trading tools, secure transactions, and expert support. Start leveraging the power of Elliott Wave and RSI to maximize your trading success.
Conclusion
Summary of Key Insights
Combining Elliott Wave and RSI provides a robust framework for market analysis, enhancing the precision of trade signals and improving overall trading performance. This integration allows traders to make more informed and strategic decisions, leading to better trading outcomes.
Benefits of Integrating Elliott Wave and RSI
- Enhanced Predictive Power: More accurate forecasting of market movements.
- Validation of Signals: Increased confidence in trade decisions.
- Improved Risk Management: Better identification of potential reversals and trend continuations.
- Comprehensive Analysis: A multi-faceted approach that combines trend patterns with momentum indicators.
- Adaptability: Applicable across various asset classes and market conditions.
- Increased Trading Efficiency: Streamlined decision-making process through combined insights.
These benefits collectively contribute to a more effective and reliable trading strategy.
Encouragement for Further Study and Practice
Mastering the integration of Elliott Wave and RSI requires dedication and continuous practice. Embrace the learning journey to unlock the full potential of these powerful analytical tools. By consistently applying and refining your strategies, you can navigate the markets with confidence and precision. Stay committed to your trading education, utilize advanced tools like those offered by Opofinance, and continuously adapt to evolving market dynamics to achieve sustained trading success.
Key Takeaways
- Elliott Wave Theory and RSI are essential tools for technical analysis.
- Combining these indicators enhances market prediction accuracy.
- Opofinance offers reliable services to support your trading strategies.
- Continuous learning and disciplined application are key to successful trading.
- Advanced strategies and pro tips can further optimize trading performance.
- Integrating multiple analytical tools leads to more informed and strategic trading decisions.
These key takeaways reinforce the importance of integrating Elliott Wave and RSI for optimal trading success.
Can Elliott Wave and RSI be applied to different asset classes beyond forex?
Yes, Elliott Wave and RSI can be effectively applied to various asset classes, including stocks, commodities, cryptocurrencies, and indices. The principles of wave patterns and momentum analysis are universal, allowing traders to adapt these tools to diverse markets for enhanced trading strategies. Whether you’re trading tech stocks, precious metals, or digital currencies, the combination of Elliott Wave and RSI can provide valuable insights into market dynamics.
How does market volatility affect the effectiveness of Elliott Wave and RSI?
Market volatility can influence the reliability of both Elliott Wave and RSI indicators. High volatility may lead to more frequent wave corrections and RSI fluctuations, potentially causing false signals. Conversely, low volatility can result in prolonged trends, making wave patterns more predictable. Understanding the impact of volatility is crucial for adjusting strategies and maintaining accuracy in analysis. Traders may need to modify their wave counts or RSI thresholds based on prevailing volatility conditions to maintain effective trading signals.
Are there automated tools that integrate Elliott Wave and RSI for trading?
Yes, there are automated trading tools and software that integrate Elliott Wave and RSI indicators, providing traders with real-time analysis and trading signals. These tools can enhance efficiency by automating the identification of wave patterns and RSI signals, allowing traders to execute strategies more swiftly and accurately. Examples include custom indicators for platforms like MetaTrader 5 (MT5) and specialized trading algorithms that combine wave analysis with momentum indicators for automated trading decisions.


