

In the ever-evolving world of financial markets, understanding the distinction between fair value gap (FVG) and supply and demand is essential for traders and investors. However, what precisely differentiates these concepts, and how do they influence your trading decisions, especially when working with a regulated forex broker?
Fair value gaps are specific chart patterns showing rapid price movements that create noticeable “gaps,” often signaling potential short-term reversal points. In contrast, supply and demand represent the fundamental forces driving all market prices, based on an asset’s availability and the desire to acquire it. While FVGs offer tactical trading opportunities, supply and demand principles form the foundation of both short-term and long-term market trends.
This comprehensive guide will explore how these concepts shape market movements and can be leveraged to enhance your trading strategies. Whether you’re a seasoned trader or just starting out, you’ll learn how to combine FVG analysis with supply and demand principles to gain a more nuanced understanding of market behavior. We’ll cover practical applications, advanced strategies, common pitfalls, and even touch on how emerging technologies are transforming market analysis.
By the end of this guide, you’ll be equipped with the knowledge to make more informed trading decisions, potentially boosting your performance in the competitive world of financial markets.
Fair Value Gap (FVG)
Definition and Concept
A Fair Value Gap, often abbreviated as FVG, is a technical analysis concept that identifies areas on a price chart where there’s a significant imbalance between buying and selling pressure. These gaps typically occur when price moves rapidly, leaving behind an area where no trading took place. In essence, an FVG represents a “hole” in the market structure where price didn’t have the opportunity to establish fair value.
FVGs are often seen as areas of market inefficiency, where price moved so quickly that it didn’t have time to properly price in all available information. As a result, these gaps are considered potential areas for price to return to in the future, as the market seeks to establish a more accurate valuation.
How FVGs are Created
Fair Value Gaps are typically created during periods of high volatility or when significant news impacts the market. They can occur in any timeframe, from intraday charts to longer-term weekly or monthly charts. Here’s how an FVG is usually formed:
- Rapid Price Movement: A sudden surge in buying or selling pressure causes price to move quickly in one direction.
- Skipped Price Levels: Due to the speed of the movement, certain price levels are “skipped” or not traded.
- Gap Formation: The area where these price levels were skipped forms the Fair Value Gap.
- Continuation or Reversal: After the gap is formed, price may continue in the same direction or reverse, often leaving the gap unfilled for some time.
Importance in Technical Analysis
FVGs have gained popularity among technical analysts and traders for several reasons:
- Potential Reversal Points: FVGs are often seen as areas where price might reverse or at least pause its current trend.
- Market Inefficiency Indicator: They highlight areas where the market may not have efficiently priced in all available information.
- Order Flow Insight: FVGs can provide clues about institutional order flow and large player activity in the market.
- Support and Resistance: These gaps often act as support or resistance levels in future price action.
- Trend Analysis: The presence or absence of FVGs can offer insights into the strength of a trend.
Examples of FVGs in Charts
To better understand FVGs, let’s look at some examples:
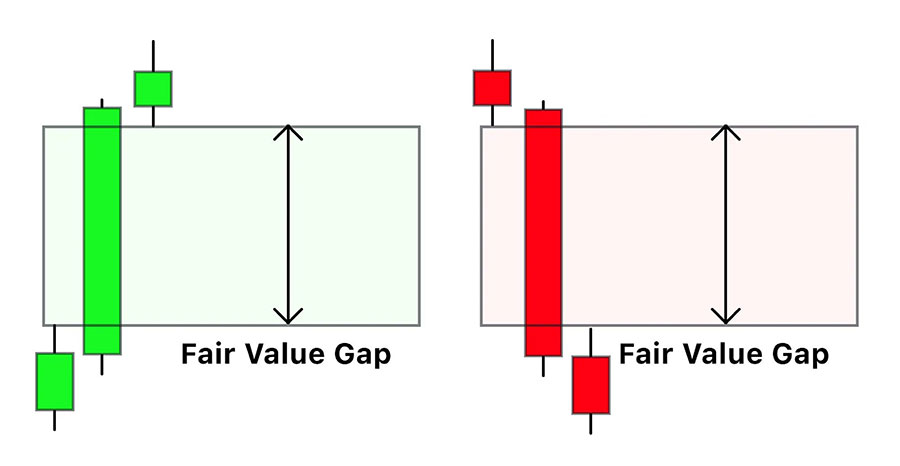
- Bullish FVG: In an uptrend, a bullish FVG forms when price rapidly moves up, leaving a gap below. This gap is often seen as potential support in future price action.
- Bearish FVG: In a downtrend, a bearish FVG forms when price quickly drops, leaving a gap above. This gap may act as resistance if price rebounds.
- Multiple FVGs: In volatile markets, multiple FVGs can form in succession, creating a “ladder” effect on the chart.
- Filled FVG: When price returns to an FVG and trades through it, the gap is considered “filled.” This often leads to a continuation of the original move that created the gap.
Read More: Unleash the power of fair value gap and order Block strategy Confluence
Supply and Demand
Basic Economic Principle
Supply and demand form the foundational principle of economics, determining the price of goods and services in a market. The law of supply states that as the price of an item increases, the quantity supplied will also increase, whereas the law of demand states that as the price of an item decreases, the quantity demanded will increase.
Application in Financial Markets
In financial markets, the principles of supply and demand are equally applicable. Prices of assets like stocks, commodities, and currencies are determined by the levels of supply (sellers) and demand (buyers). When demand exceeds supply, prices rise, and when supply exceeds demand, prices fall.
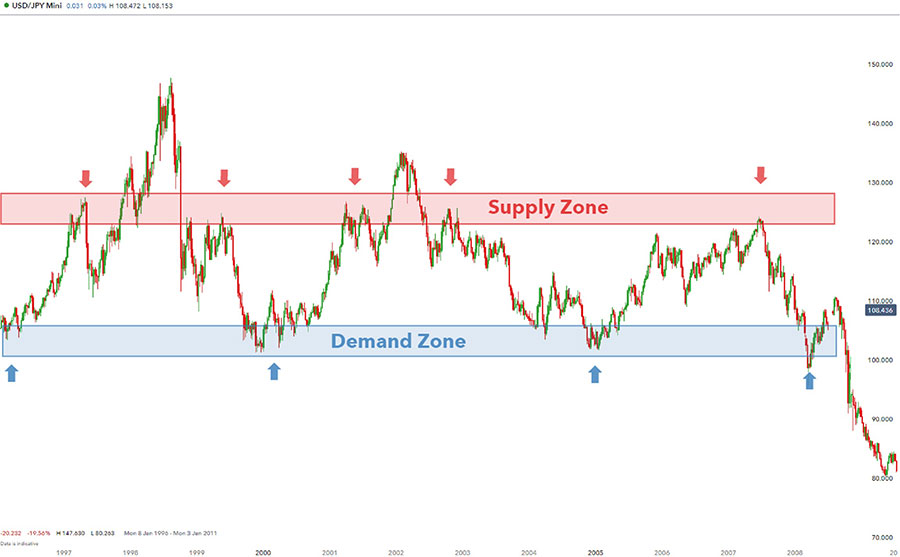
Key Supply and Demand Zones
Supply and demand zones on a price chart represent areas where significant buying or selling activity has occurred in the past, leading to noticeable price movements. These zones are critical as they indicate potential areas of price reversal or continuation. Identifying these zones helps traders make informed decisions about entry and exit points.
How Traders Use Supply and Demand Analysis
Traders use supply and demand analysis to predict price movements by identifying key zones where buying or selling pressure is likely to emerge. By analyzing historical price data and identifying patterns, traders can anticipate areas where the market might react strongly, providing opportunities for profitable trades.
FVGs as a Reflection of Supply and Demand Imbalance
Connection Between FVGs and Market Sentiment
Fair Value Gaps (FVGs) and Supply and Demand zones, while distinct concepts, are intrinsically linked in their reflection of market sentiment and order flow. FVGs can be seen as a visual representation of extreme supply and demand imbalances that occur over short periods. Here’s how they connect:
- Rapid Shifts in Sentiment: FVGs often form when there’s a sudden and significant shift in market sentiment. This could be due to unexpected news, economic data releases, or large institutional orders entering the market.
- Order Flow Visibility: FVGs provide a clear visual cue of where large volumes of orders were executed rapidly, essentially showing where a major imbalance between buyers and sellers occurred.
- Potential Return to Equilibrium: Just as supply and demand theory suggests markets tend towards equilibrium, the concept of FVGs implies that price may return to these areas to establish a fairer value.
- Indicator of Strong Supply/Demand: The presence of an FVG can indicate an area of potentially strong future supply (in the case of a bearish FVG) or demand (in the case of a bullish FVG).
Read More: Identify Order Blocks in Forex
How FVGs Highlight Areas of Excess Buying/Selling Pressure
FVGs serve as powerful indicators of excess buying or selling pressure in the market:
- Bullish FVGs: These form when buying pressure overwhelms selling pressure, causing price to gap up. The area below the gap represents a zone where sellers were completely overrun by buyers.
- Bearish FVGs: These occur when selling pressure dominates, causing price to gap down. The area above the gap shows where buyers were overwhelmed by sellers.
- Size of the Gap: The size of an FVG can provide insights into the degree of imbalance. Larger gaps typically indicate more significant imbalances and may be more likely to influence future price action.
- Cluster of FVGs: When multiple FVGs form in the same direction, it can indicate a strong and persistent imbalance in supply and demand, potentially signaling a robust trend.
- Unfilled FVGs: When FVGs remain unfilled for extended periods, it may suggest that the imbalance that created them is still present in the market.
Utilizing FVGs in Trading Strategies
Potential for Price to Revisit FVGs (Filling the Gap)
One of the key principles in trading FVGs is the expectation that price will often return to “fill” these gaps. This concept is based on the idea that markets seek efficiency and fair value. Here’s how traders can use this:
- Retracement Trades: Traders may look for opportunities to enter trades in the direction of the main trend when price retraces to fill an FVG.
- Counter-Trend Opportunities: In some cases, the filling of an FVG may signal a potential trend reversal, especially if other technical factors align.
- Time Frames: The likelihood of an FVG being filled can vary depending on the time frame. Shorter-term FVGs tend to be filled more quickly than those on longer-term charts.
- Partial Fills: Sometimes, price may only partially fill an FVG before resuming its original direction. Traders need to be aware of this possibility and adjust their strategies accordingly.
Combining FVGs with Other Technical Indicators
To increase the probability of successful trades, many traders combine FVG analysis with other technical indicators:
- Support and Resistance: FVGs often coincide with traditional support and resistance levels, providing additional confirmation.
- Trend Lines: Using trend lines in conjunction with FVGs can help identify high-probability trade setups.
- Moving Averages: The interaction between price, FVGs, and key moving averages can offer valuable insights.
- Momentum Indicators: Tools like the Relative Strength Index (RSI) or Moving Average Convergence Divergence (MACD) can help confirm the strength of moves that create or fill FVGs.
- Volume Analysis: Examining volume patterns around FVGs can provide clues about the likelihood of the gap being filled or acting as a strong support/resistance level.
Risk Management Considerations When Trading FVGs
While FVGs can offer attractive trading opportunities, proper risk management is crucial:
- Stop Loss Placement: When trading FVG fills, stop losses are often placed beyond the edge of the gap to account for potential volatility.
- Position Sizing: Given the potential for rapid price movements around FVGs, appropriate position sizing is essential to manage risk effectively.
- Partial Profit-Taking: Some traders opt to take partial profits as price approaches the edge of an FVG, securing some gains while leaving room for further movement.
- Time-Based Exits: If an FVG doesn’t fill within a specific timeframe, some traders may choose to exit the trade to avoid prolonged exposure.
- Market Context: Always consider the broader market context when trading FVGs. Factors like overall trend, key news events, and market sentiment can impact the reliability of FVG-based setups.
Practical Applications
Trading Strategies Using FVG
- Gap Fill Strategy:
- Identify a significant FVG on your chosen timeframe.
- Wait for price to retrace towards the gap.
- Enter a trade in the direction of the original move that created the gap.
- Place a stop loss just beyond the opposite side of the gap.
- Target the full gap fill or use a trailing stop to maximize potential profits.
- FVG as Support/Resistance:
- Locate FVGs on your chart.
- Use bullish FVGs as potential support levels in an uptrend.
- Use bearish FVGs as potential resistance levels in a downtrend.
- Enter trades when price reacts at these levels, confirming with other technical indicators.
- FVG Breakout Strategy:
- Identify an FVG that has acted as support or resistance multiple times.
- Wait for a clear break and close beyond the FVG.
- Enter a trade in the direction of the breakout.
- Use the broken FVG level as your new support or resistance for stop loss placement.
Trading Strategies Using Supply and Demand
- Zone Bounce Strategy:
- Identify key supply and demand zones on your chart.
- Wait for price to approach a zone.
- Look for confirmation of a bounce (e.g., candlestick patterns, momentum shifts).
- Enter a trade in the direction of the expected bounce.
- Place a stop loss beyond the zone.
- Zone Breakout Strategy:
- Locate strong supply or demand zones that have held multiple times.
- Watch for a decisive break of the zone.
- Enter a trade in the direction of the breakout.
- Use the broken zone as a new support or resistance level for trade management.
- Multi-Timeframe Zone Strategy:
- Identify significant supply and demand zones on a higher timeframe.
- Switch to a lower timeframe as price approaches these zones.
- Look for specific entry triggers (e.g., price action patterns, indicator signals) on the lower timeframe.
- Enter trades with stops placed beyond the zone and targets based on the higher timeframe structure.
Read More: Identify Liquidity in Forex
Conclusion
Understanding the Fair Value Gap (FVG) and the principles of supply and demand is essential for effective technical analysis and trading strategies. FVGs reveal critical areas of market imbalance, often indicating potential price retracements. By combining FVG analysis with supply and demand zones, traders can better anticipate market movements and identify profitable entry and exit points. Integrating these concepts into trading strategies, along with other technical indicators and robust risk management practices, can enhance trading performance and yield more informed decision-making. Whether you’re a novice or an experienced trader, mastering FVGs and supply and demand dynamics is crucial for navigating the complexities of financial markets.
How do FVGs impact long-term investment strategies?
FVGs can impact long-term investment strategies by highlighting potential retracement points where prices might revert to fill gaps created during periods of high volatility. Long-term investors can use this information to better time their entry and exit points, enhancing their overall strategy.
Are FVGs more common in certain types of assets or markets?
FVGs are more common in markets and assets with higher volatility, such as cryptocurrencies and certain stocks. Markets that frequently react to significant news events or economic data releases are more likely to exhibit FVGs due to the rapid price movements these events can cause.
Can FVG analysis be applied to automated trading systems?
Yes, FVG analysis can be integrated into automated trading systems. By programming algorithms to identify and react to FVGs, traders can automate the process of detecting potential retracement points and executing trades, potentially increasing efficiency and profitability.


