

Feeling lost trying to predict the next move in the fast-paced Forex market? Many traders struggle with the seemingly random price swings, missing good entries or getting stopped out unexpectedly. It often feels like navigating without a compass. But what if there was a way to map out potential turning points using geometry and specific ratios? This is where harmonic patterns in forex come in. They offer a fascinating method using Fibonacci numbers to spot potential reversals before they happen. Applying harmonic patterns in forex requires practice, but can be rewarding. In this article, we’ll explore these patterns, how to identify them, and how to build a trading strategy around harmonic patterns in forex.

The Core Structure of Harmonic Patterns
At their heart, harmonic patterns are specific shapes on a price chart. They’re built using key price swings and rely heavily on Fibonacci ratios to ensure the geometry is precise. Getting familiar with this basic structure is the first step to using harmonic patterns in forex effectively.
Key Points and Legs
Every typical harmonic pattern is defined by five important turning points, labeled X, A, B, C, and D. These points connect to create four distinct price movements or ‘legs’:
- XA Leg: This is the starting move, the initial swing that kicks off the potential pattern. Its length and direction set the stage.
- AB Leg: Price then retraces a portion of the XA leg. How much it pulls back (measured with Fibonacci) is a critical clue to which pattern might be forming.
- BC Leg: This leg moves back in the general direction of the original XA leg. Its length relative to the AB leg is another key piece of the puzzle.
- CD Leg: The final leg moves opposite to the BC leg. Where this leg finishes, at point D, completes the pattern structure. Its length is measured relative to both the BC and XA legs.
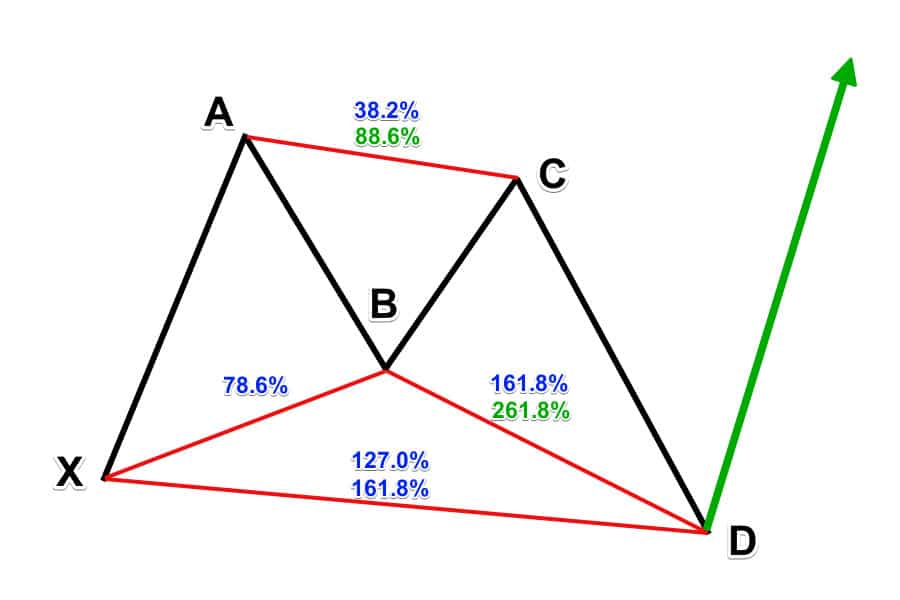
The Potential Reversal Zone (PRZ)
The pattern isn’t truly complete until the price reaches point D. But ‘D’ isn’t usually a single exact price. Instead, it’s an area called the Potential Reversal Zone (PRZ). This zone is calculated using a cluster of Fibonacci retracement and extension levels based on the previous legs (XA, AB, BC). When the price action enters the PRZ after finishing the CD leg, traders start watching closely for signs that the expected price reversal is about to begin. The PRZ highlights the area where the pattern’s conditions are met and a reversal is most likely according to the rules of harmonic patterns in forex.
Different Harmonic Patterns Explained
Harmonic trading involves several unique patterns, each with its own specific shape and set of Fibonacci rules. Learning to spot these different harmonic patterns forex charts present is vital. Although they share the basic XABCD structure, the exact measurements are what make them valid and hint at their potential outcome. Understanding these different harmonic patterns is key to utilizing harmonic patterns in forex.
Gartley Pattern
Considered the classic harmonic pattern, the Gartley was first mentioned by H.M. Gartley and later refined with specific Fibonacci ratios by Scott Carney. It typically signals a potential reversal point where the price might resume the larger trend that existed before the pattern started.
- Structure: Looks like an ‘M’ for bullish setups and a ‘W’ for bearish ones.
- Key Ratios:
- Point B: Must pull back to the 0.618 Fibonacci level of the XA leg. This is non-negotiable.
- Point C: Can retrace between 0.382 and 0.886 of the AB leg.
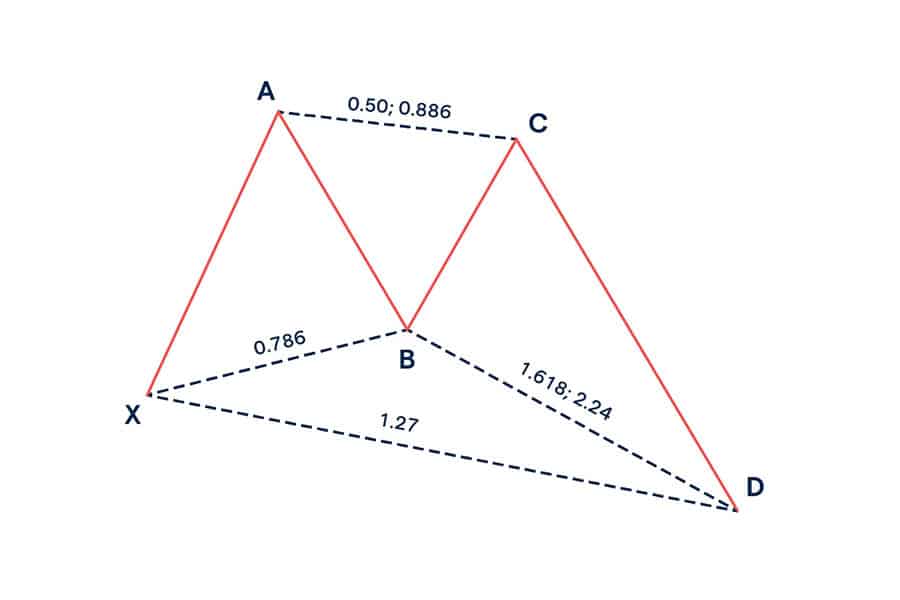
- Point D (PRZ): Forms at the 0.786 retracement of the XA leg AND often aligns with a 1.272 or 1.618 extension of the BC leg. Finding both calculations pointing to the same area strengthens the PRZ.
- Type: Can be Bullish (expecting price to rise from D) or Bearish (expecting price to fall from D).
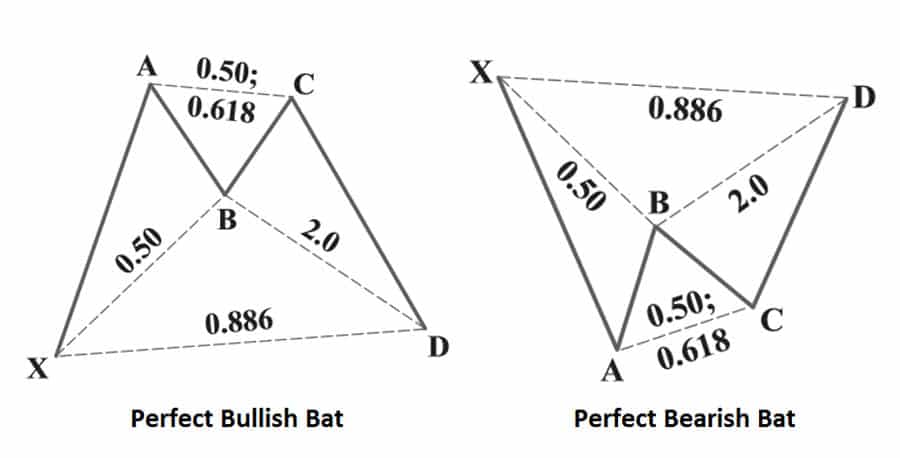
Bat Pattern
Also developed by Scott Carney, the Bat pattern looks similar to the Gartley but has a shallower B point retracement and completes closer to the initial X point, specifically at the 0.886 retracement.
Read More: The Fibonacci Strategy In Forex
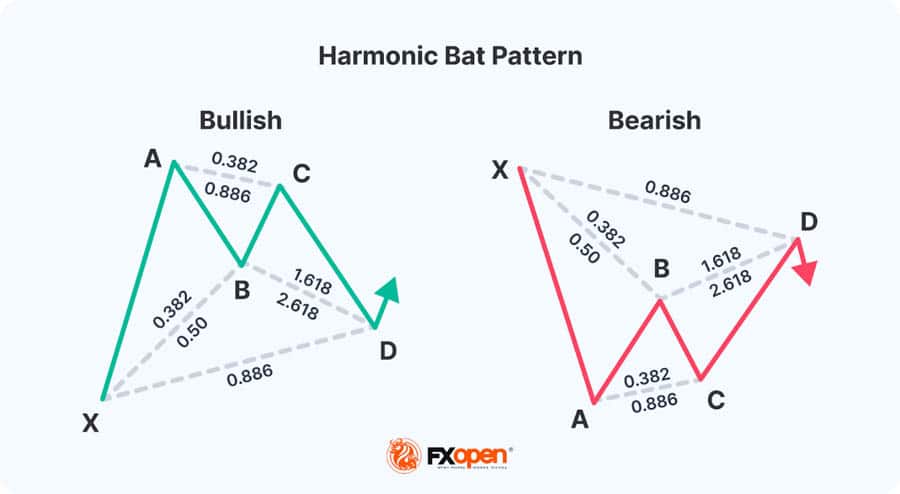
- Structure: Similar M/W shape, often appearing a bit more symmetrical.
- Key Ratios:
- Point B: Must retrace less than 0.618 of XA, usually 0.382 or 0.500. This clearly distinguishes it from the Gartley.
- Point C: Retraces between 0.382 and 0.886 of the AB leg.
- Point D (PRZ): Completes precisely at the 0.886 retracement of the XA leg. It often aligns with a 1.618 to 2.618 extension of the BC leg.
- Type: Can be Bullish or Bearish.
Alternate Bat Pattern
This is a variation of the Bat pattern, identified by Scott Carney. It uses different measurements, especially for points B and D, creating a slightly different look.
- Structure: Resembles the standard Bat.
- Key Ratios:
- Point B: A shallow retracement, 0.382 or less of the XA leg.
- Point C: Retraces between 0.382 and 0.886 of the AB leg.
- Point D (PRZ): Found at the 1.13 retracement of the XA leg (meaning it slightly exceeds X). The BC projection is usually 2.0 to 3.618.
- Type: Can be Bullish or Bearish.
Butterfly Pattern
The Butterfly pattern, another Scott Carney discovery, is unique because point D completes beyond the starting point X. This suggests the trend that formed the XA leg might be exhausted.
- Structure: Looks stretched compared to a Gartley or Bat, with D clearly extending past X.
- Key Ratios:
- Point B: Must be a 0.786 retracement of the XA leg.
- Point C: Retraces between 0.382 and 0.886 of the AB leg.
- Point D (PRZ): Found at the 1.272 or 1.618 extension of the XA leg. It also often lines up with a 1.618 to 2.618 extension of the BC leg.
- Type: Can be Bullish or Bearish. Stop placement needs care since D is beyond X.
Crab Pattern
The Crab pattern (Scott Carney) features a very long final CD leg, pushing the completion point D significantly beyond X. It often signals a potential sharp reversal after a very strong price move.
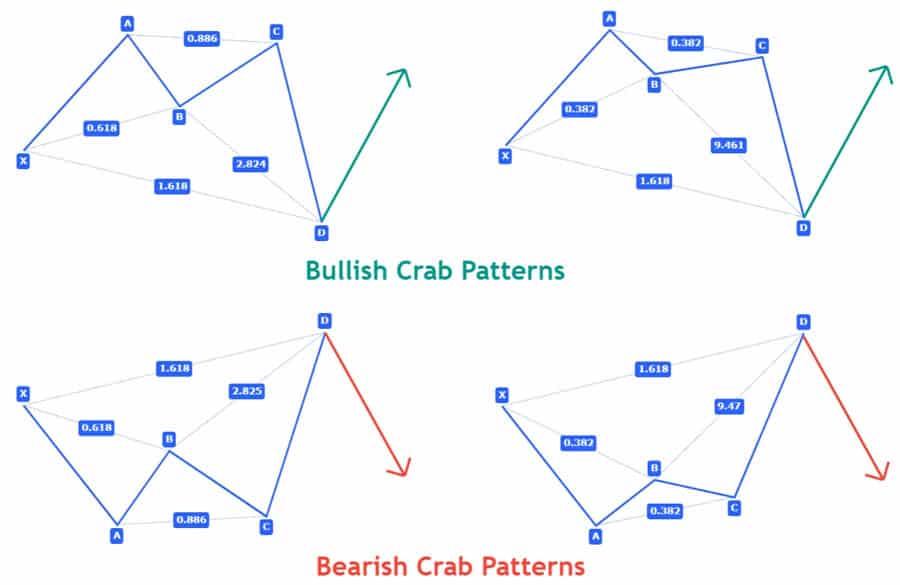
- Structure: Looks very stretched, like an extreme Butterfly.
- Key Ratios:
- Point B: Retraces between 0.382 and 0.618 of the XA leg.
- Point C: Retraces between 0.382 and 0.886 of the AB leg.
- Point D (PRZ): Found way out at the 1.618 extension of the XA leg. It also usually matches a very long 2.24 to 3.618 extension of the BC leg.
- Type: Can be Bullish or Bearish. Often appears after fast, extended price action.
Deep Crab Pattern
A variation of the Crab, the Deep Crab’s defining feature is a much deeper B point retracement, specifically hitting the 0.886 level of XA. The D point completion remains way out at the 1.618 extension of XA, like the standard Crab.
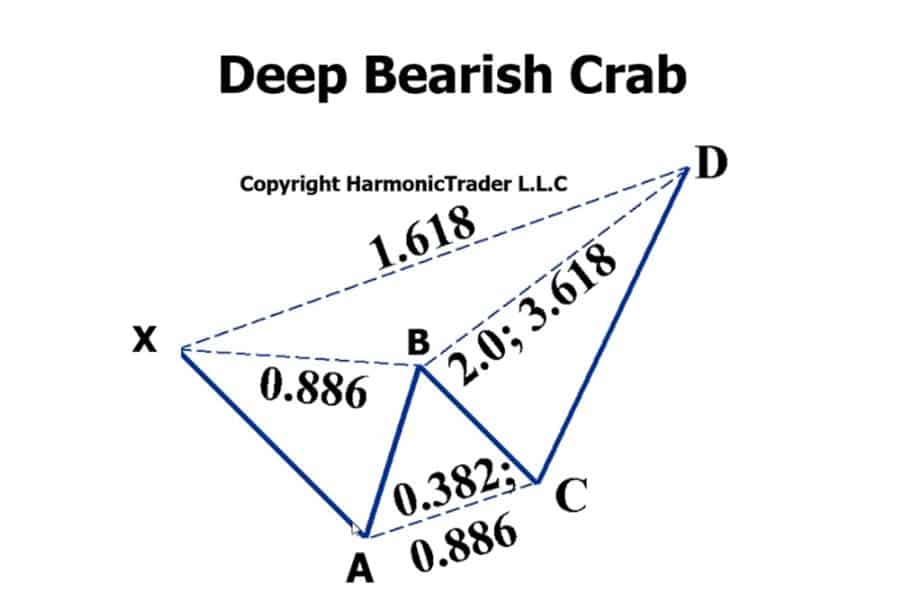
- Structure: Very stretched, similar to the Crab.
- Key Ratios:
- Point B: Must be a 0.886 retracement of the XA leg (the key difference).
- Point C: Retraces between 0.382 and 0.886 of the AB leg.
- Point D (PRZ): Found at the 1.618 extension of XA, often coinciding with a 2.0 to 3.618 BC extension.
- Type: Can be Bullish or Bearish.
Cypher Pattern
The Cypher pattern stands out because its BC leg actually extends beyond point A. It tends to have steeper legs compared to some other patterns.
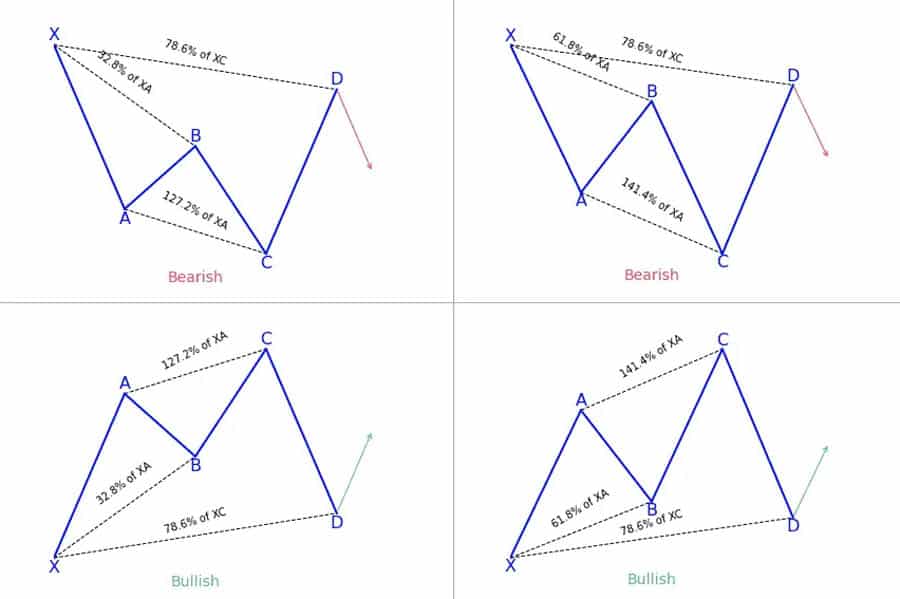
- Structure: Noticeable for its higher B point (relative to XA) and a C point that goes beyond A.
- Key Ratios:
- Point B: Retraces between 0.382 and 0.618 of the XA leg.
- Point C: Must extend beyond A, typically reaching the 1.272 to 1.414 level relative to the XA leg.
- Point D (PRZ): Completes at the 0.786 retracement of the entire XC leg (Important: measured from X to C, not X to A).
- Type: Can be Bullish or Bearish. This is another valuable pattern within harmonic patterns in forex.
Shark Pattern
A more recent pattern, the Shark (also linked to Scott Carney) sometimes uses different labels (0, X, A, B, C, with the reversal at C). Keeping the XABCD convention for consistency, it also features a C point extending beyond A, but uses different ratios, and the D point often falls short of X or extends slightly past it.
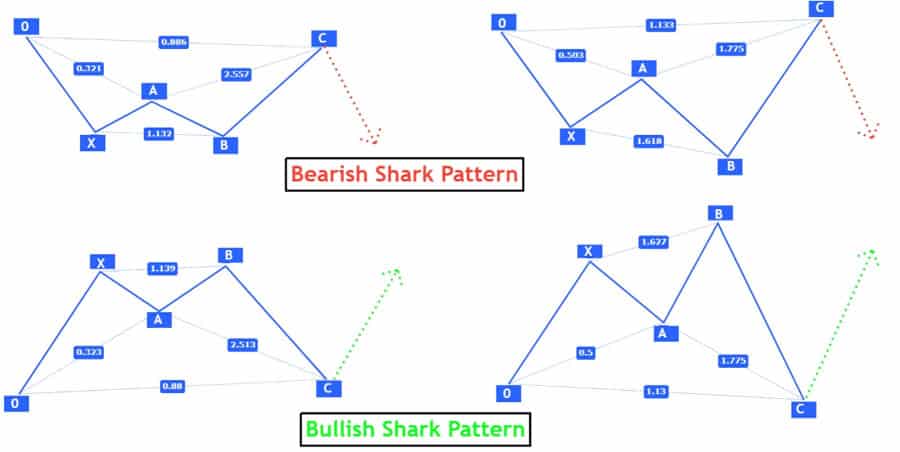
- Structure (using XABCD, reversal at D): Often looks like patterns where C extends past A. The key reversal happens at what’s originally labeled ‘C’. Mapping this to our D point:
- Key Ratios (Mapped to XABCD, Reversal at D):
- Point B (original A): Forms after the initial leg (0X).
- Point C (original B): Retraces 1.13 to 1.618 of the preceding leg (XA).
- Point D (original C – the reversal point): Forms at the 0.886 to 1.13 retracement of the initial leg (our X point origin) OR a 1.618 to 2.24 extension of the AB leg (XA in original). This translation can be tricky; specialized Shark indicators are helpful.
- Type: Can be Bullish or Bearish. It often transitions into another pattern called the 5-0.
Identifying Harmonic Patterns on Charts
Spotting valid harmonic patterns in forex requires a careful eye and a systematic approach, whether you do it by hand or use software aids. Getting the points right and measuring the Fibonacci levels accurately is crucial for trading harmonic patterns in forex successfully.
Manual Identification Steps
Finding patterns manually means using your charting platform’s drawing tools, especially the Fibonacci tools.
- Spot a Potential XA Leg: Look for a clear, strong price swing on your chart timeframe. This is your potential starting XA leg. Mark the beginning (X) and end (A).
- Locate Point B: Use the Fibonacci retracement tool from X to A. See if the price pulls back and turns at a key Fibonacci level required for a specific pattern (e.g., 0.618 for Gartley, 0.500 for Bat). Mark this turning point as B.
- Locate Point C: Now, draw the Fibonacci retracement tool on the AB leg (from A down to B, or A up to B). Look for the next turning point (C) that respects the pattern’s rules for this leg (often between 0.382 and 0.886). Make sure C doesn’t go beyond A (unless it’s a Cypher or Shark).
- Project Point D (The PRZ): This takes a few Fibonacci measurements to find the zone where D should complete:
- Retracement/Extension of XA: Draw the Fib tool from X to A again. Point D needs to hit the specific level for the pattern (e.g., 0.786 retracement for Gartley, 0.886 for Bat, 1.272 extension for Butterfly).
- Extension of BC: Use the Fibonacci extension tool. Click B, then C, then back to B (or follow platform instructions). D often lines up with a key extension level (like 1.618 or 2.24).
- (Optional) AB=CD Check: Sometimes, the length of the CD leg mirrors the AB leg. If this AB=CD completion point lines up with the other projections, it adds confirmation.
The area where these calculations overlap forms the Potential Reversal Zone (PRZ).
- Check the Rules: Go back and ensure points B, C, and D all fit the specific Fibonacci rules for the pattern you think you’ve found. If any rule is broken, it’s not a valid example of harmonic patterns in forex.
Using Harmonic Pattern Indicators
Doing this manually takes practice and time. Many traders prefer automated harmonic pattern scanners or indicators. These tools are available for platforms like MetaTrader 4 (MT4), MetaTrader 5 (MT5), and TradingView. They scan charts automatically, highlight potential patterns, and often draw the XABCD legs and PRZ for you. They’re convenient for finding harmonic patterns in forex, but it’s still smart to understand the underlying rules to double-check the indicator’s findings, as they aren’t always perfect.
Confirmation Tools
Just because a pattern completes doesn’t guarantee a reversal. The PRZ is a high-probability zone, not a certainty. Always look for extra confirmation before jumping into a trade based on harmonic patterns in forex.
- Oscillator Divergence: Check indicators like RSI or MACD. If the price makes a new low (for a bullish pattern D) or high (for a bearish D) in the PRZ, but the indicator doesn’t make a matching new low/high, that’s divergence. It signals weakening momentum and suggests a reversal might be coming.
- Candlestick Signals: Look for classic reversal candlestick patterns right inside the PRZ – things like pin bars (hammers, shooting stars), engulfing patterns, or dojis. These show indecision or a shift in control at the critical price level.
- Price Behavior: Simply watch how the price acts when it hits the PRZ. Does it stall, struggle to push further, or start forming candles in the direction you expect the reversal to go?
Read More: strongest candlestick patterns
How to Trade Harmonic Patterns in Forex
Finding a pattern is step one; trading it effectively requires a clear plan for entry, stop-loss, and take-profit. This organized approach is essential for managing risk when dealing with harmonic patterns in forex.
Defining Entry Rules
The standard way to enter is to wait for the price to reach the PRZ and then look for those confirmation signals we just discussed.
- Entry Timing: Don’t enter just because the price touches the PRZ. Wait for proof the reversal might be starting – like a confirmation candle or divergence. Patience pays off when trading harmonic patterns in forex.
- Bullish Entry: After price hits the PRZ in a bullish pattern (like a Bullish Bat), look for a bullish reversal candle, bullish divergence, and for price to start moving up out of the zone. Then, place a buy order.
- Bearish Entry: After price hits the PRZ in a bearish pattern (like a Bearish Gartley), look for a bearish reversal candle, bearish divergence, and for price to start moving down. Then, place a sell order.
Setting Stop-Loss Orders
A stop-loss protects you if the pattern fails. Harmonic patterns give logical spots to place them.
- Standard Spot: The usual place is just outside the calculated PRZ or slightly beyond the extreme point of D. For bullish patterns, it goes below the PRZ low; for bearish, above the PRZ high.
- Beyond X (Sometimes): For patterns like Gartley and Bat where D forms inside the initial XA move, some traders place the stop just beyond point X. This gives more breathing room but increases potential loss size. This doesn’t work for extension patterns like Butterfly or Crab.
- Consider Volatility: You might use a tool like the Average True Range (ATR) to set your stop a bit further away, reducing the chance of getting kicked out by random market noise.
Setting Take-Profit Targets
Harmonic patterns also suggest sensible places to take your profits, often using Fibonacci levels or the pattern’s own structure points.
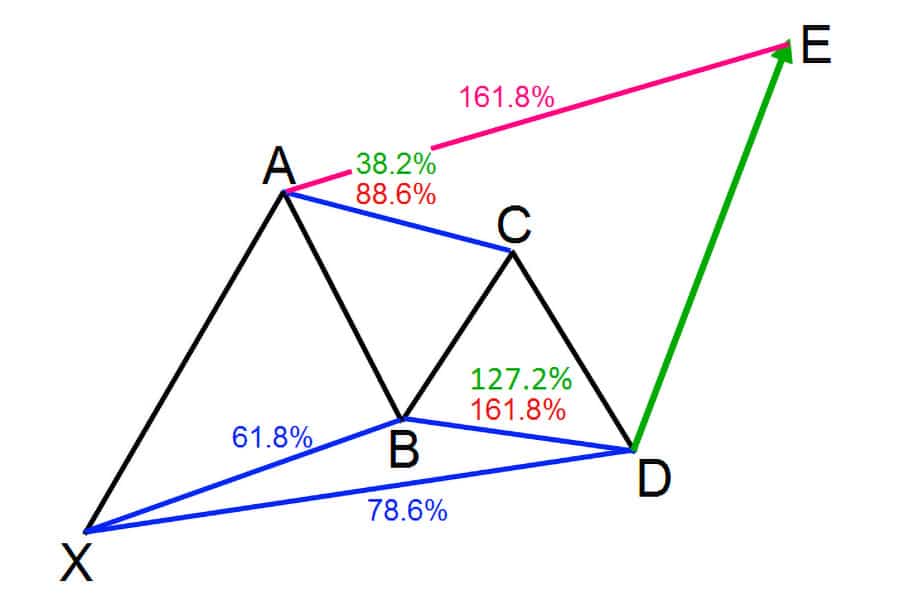
- First Target (T1): Often aimed at the 38.2% or 50% Fibonacci retracement level measured from A to D. Point C is also a common first target.
- Second Target (T2): Usually the 61.8% Fibonacci retracement of the AD move, or near point A.
- Further Targets: If the reversal looks strong, you might aim for point X or even beyond.
- Scaling Out: A popular tactic is to close part of your trade at T1, move your stop-loss to your entry price (break even), and let the rest aim for T2.
Illustrative Trade Examples
Bullish Gartley Trade
Let’s say a Bullish Gartley shows up on the EUR/USD 4-hour chart. The PRZ (point D) is around 1.0850 (based on 0.786 XA retracement). Price dips into this zone, forms a hammer candle, and RSI shows bullish divergence. Entry: Buy around 1.0860, just above the hammer. Stop-Loss: Place it below the low of the PRZ/hammer, maybe 1.0830. Take-Profit 1: Target near point C or the 38.2% AD retracement. Take-Profit 2: Target near point A or the 61.8% AD retracement. This illustrates a potential trade using harmonic patterns in forex.
Bearish Bat Trade
Imagine a Bearish Bat appears on the GBP/JPY Daily chart. The PRZ (point D) is near 195.00 (0.886 XA retracement). Price rallies into the zone, prints a bearish engulfing candle, and MACD shows bearish divergence. Entry: Sell below the engulfing candle’s low, maybe 194.80. Stop-Loss: Place it above the high of the PRZ/engulfing candle, perhaps 195.30. Take-Profit 1: Aim for point C or the 38.2% AD level. Take-Profit 2: Aim for point A or the 61.8% AD level.
Advantages of Using Harmonic Patterns
Incorporating harmonic patterns into your Forex trading can bring several key benefits:
- Predictive Nature: Unlike many indicators that follow price, harmonics try to forecast potential turning points before they happen, giving you a heads-up on potential reversals. This is a core strength of harmonic patterns in forex.
- Clear Levels: They provide very specific price zones (PRZ) for potential entries and logical structure points (X, A, C) to help set stop-losses and profit targets objectively.
- Good Risk/Reward Potential: When traded correctly with confirmation and sensible stops, successful harmonic trades can offer favorable risk-to-reward ratios.
- Works Across Markets & Timeframes: These patterns show up on all sorts of currency pairs and timeframes, from short-term charts to long-term ones, making them versatile. Applying harmonic patterns in forex is popular, but they appear elsewhere too.
- Adds Discipline: The strict Fibonacci rules required for a valid pattern encourage a disciplined, rule-based approach to finding trade setups when using harmonic patterns in forex.
Disadvantages and Limitations
However, harmonic patterns aren’t a magic bullet and have their own set of drawbacks:
- Subjectivity Issues: Pinpointing the exact X, A, B, and C points can sometimes be tricky, especially in messy price action. Two traders might draw the same pattern slightly differently.
- Requires Patience: Good, clear harmonic patterns don’t form every day. You need the patience to wait for setups that meet all the rules perfectly.
- Patterns Can Fail: Price doesn’t always reverse in the PRZ. It can blow right through the zone, triggering your stop-loss. Confirmation helps, but failures happen with harmonic patterns in forex too.
- Learning Curve: Mastering the different harmonic patterns forex traders use, along with their specific Fibonacci ratios, takes time, study, and practice. It can feel complex initially.
- Indicator Quirks: Some automated harmonic indicators might ‘repaint’ – meaning a pattern shown earlier might vanish or shift as new price bars form. This can be confusing if you’re not aware of it.
Read More: Most Effective Forex Trading Indicators
Risk Management When Trading Harmonics
Solid risk management is absolutely essential when trading any method, including harmonic patterns in forex. Since patterns can fail, protecting your account balance is the top priority.
- Control Position Size: Only risk a small, predefined percentage (like 1-2%) of your trading capital on any single harmonic trade. Your position size should be based on the distance between your entry and stop-loss.
- Wait for Confirmation: Don’t trade a pattern just because it looks complete. Always wait for extra confirmation signals within the PRZ (like candles or divergence) before entering.
- Accept Losses Gracefully: Losing trades are unavoidable. If a pattern fails and hits your stop, stick to your plan, take the small loss, and look for the next opportunity. Don’t chase losses.
- Focus on Risk/Reward: Harmonic patterns might not win every time, but the goal is for the winning trades (with good risk/reward) to outweigh the losing ones. Consistency and risk control are key for trading harmonic patterns in forex.
- Don’t Rely Solely on Harmonics: Combine harmonic analysis with other techniques like looking at the overall trend, key support/resistance levels, and the general market mood for stronger trade ideas.
Harmonic Patterns Cheat Sheet Concept
For a quick reference, here’s a simplified summary of the defining ratios for the main patterns (Always double-check detailed rules before trading!):
- Gartley: Key is B at 0.618 XA; D completes at 0.786 XA.
- Bat: Key is B less than 0.618 XA (often 0.382-0.500); D completes at 0.886 XA.
- Alt Bat: B at 0.382 XA; D at 1.13 XA.
- Butterfly: Key is B at 0.786 XA; D is an extension beyond X (1.272 or 1.618 XA).
- Crab: D is a deep extension beyond X (1.618 XA).
- Deep Crab: Like Crab (D at 1.618 XA extension), but B must be deep (0.886 XA).
- Cypher: C extends beyond A; D is 0.786 retracement of the X to C leg.
- Shark (Rev. at D): Complex ratios involving extensions, often leads to 5-0 pattern.
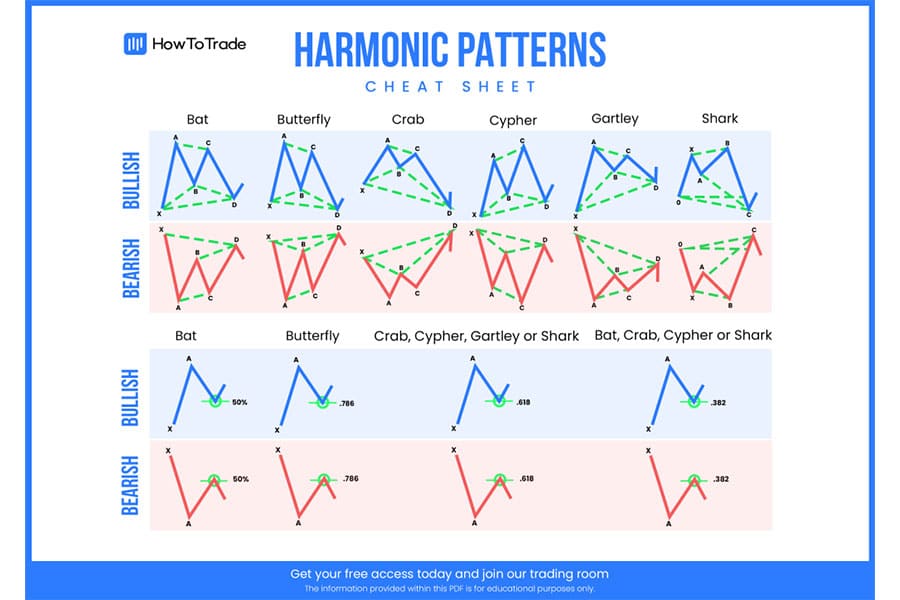
Remember, the relationships between AB and BC, and BC and CD (using extensions) are also vital for pinpointing the PRZ accurately when identifying harmonic patterns in forex.
Opofinance Services
Using strategies like harmonic patterns in forex effectively is easier with a capable broker. Opofinance, regulated by ASIC, provides a strong platform with advanced features and security for traders.
- Trustworthy Regulation: Opofinance’s ASIC regulation ensures adherence to strict financial standards, offering peace of mind.
- Top Trading Platforms: Choose from industry favorites like MetaTrader 4 (MT4), MetaTrader 5 (MT5), cTrader, or use the intuitive OpoTrade platform – all equipped for detailed technical analysis, including identifying harmonic patterns in forex.
- Smart AI Assistance: Gain an edge with Opofinance’s AI tools: Market Analyzer for insights, AI Coach for personalized trading tips, and AI Support for quick help.
- Flexible Trading Styles: Explore Social Trading to follow and copy successful traders, or test your skills with Prop Trading opportunities.
- Hassle-Free Funding: Enjoy secure and easy deposits and withdrawals. Opofinance supports various methods, including crypto, making it convenient worldwide. Plus, Opofinance doesn’t charge its own fees on deposits or withdrawals.

Want to trade with sophisticated tools in a secure, regulated environment? Check out Opofinance today!
Conclusion
Harmonic patterns in forex provide traders with a unique, geometry-based method for anticipating potential market reversals. By mastering the specific Fibonacci ratios that define the different harmonic patterns forex markets generate, you can identify high-probability zones (PRZs) for potential trades. While they demand study and patience, their strength lies in offering objective levels for entries, stops, and targets. Remember, success isn’t just about spotting patterns; it’s about disciplined execution, smart risk management, and always seeking confirmation when using harmonic patterns in forex. Harmonics are a valuable addition to a trader’s toolkit, best used alongside other analysis methods for a well-rounded perspective on trading harmonic patterns in forex.
Key Takeaways
- Harmonic patterns blend geometry (XABCD points) and Fibonacci ratios to forecast potential reversal zones (PRZ) in Forex charts.
- Common patterns like Gartley, Bat, Butterfly, Crab, and Cypher have unique Fibonacci rules for their B, C, and D points.
- Spot them manually with Fibonacci tools or use automated scanners on platforms like MT4/MT5/TradingView for finding harmonic patterns in forex.
- Trade entry requires price hitting the PRZ plus confirmation (like divergence or specific candles). Stops go beyond D/PRZ; targets are often at C, A, or Fib levels of the AD leg.
- Pros: Predictive signals, clear levels, good R:R potential. Cons: Subjectivity, complexity, patterns can fail.
- Strict risk control (position size, stops, confirmation) is essential when trading harmonic patterns in forex.
Are harmonic patterns suitable for beginners?
Harmonic patterns can be quite complex for those brand new to Forex trading. The specific rules and precise Fibonacci measurements require a good understanding of charting and Fibonacci tools. It’s generally better for beginners to first get comfortable with basic concepts like trend lines, support/resistance, and simple candlestick patterns. Once those are familiar, tackling harmonic patterns in forex, maybe starting with just the Gartley or Bat pattern on a demo account, becomes more manageable.
Which timeframe is best for trading harmonic patterns?
There’s no single “best” timeframe because harmonic patterns appear on all of them – from 1-minute charts to monthly charts. The ideal timeframe really depends on your trading style when using harmonic patterns in forex. Swing traders might prefer the 4-hour, daily, or weekly charts, looking for larger moves that take days or weeks to play out. Day traders might focus on the 15-minute, 30-minute, or 1-hour charts for quicker setups. The core principles of identification and trading remain the same regardless of the timeframe.
Do harmonic patterns work well in trending markets?
Harmonic patterns are primarily reversal patterns. They signal potential ends to price swings. This means they often identify the end of a pullback within a larger trend (like a Gartley setting up a chance to rejoin the main trend) or signal a potential turning point against the most recent move (like a Bat or Butterfly suggesting a counter-trend trade or trend exhaustion). They aren’t typically used to enter during strong, ongoing momentum but rather at points where that momentum might pause or reverse, making harmonic patterns in forex useful for specific entry scenarios.


