Are you eager to elevate your trading performance and gain a competitive edge in the financial markets? The fusion of the Ichimoku and MACD indicators might be the game-changer you’ve been searching for. These two powerful tools, when combined, offer a comprehensive analysis of market trends and momentum that can significantly enhance your trading strategies. By leveraging both the Ichimoku Cloud and MACD strategy, especially through a regulated forex broker, traders can unlock deeper insights and make more informed decisions.

In this detailed guide, we’ll delve into how the MACD Ichimoku strategy can be your secret weapon in navigating the complex world of trading. Whether you’re a novice or an experienced trader, understanding how these indicators work together will provide you with a robust framework for analyzing the markets. Let’s explore how integrating the Ichimoku and MACD can revolutionize your approach to trading.
Understanding Ichimoku Cloud
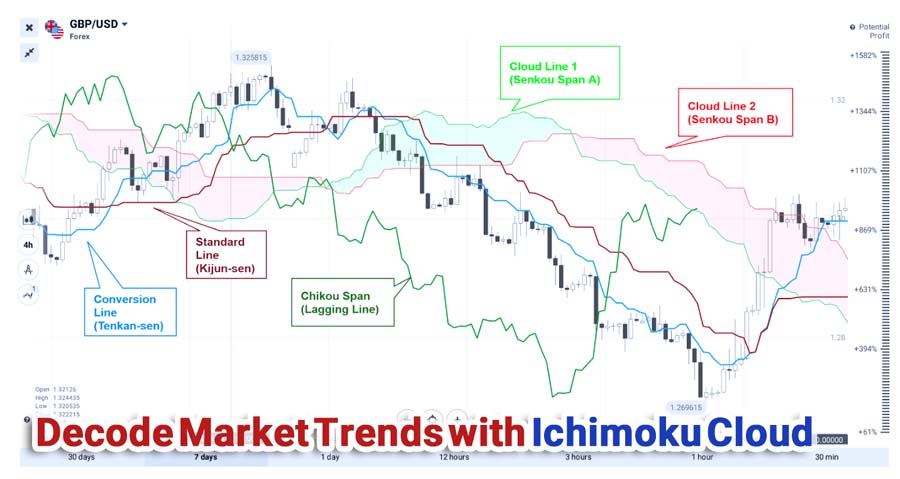
Components of the Ichimoku Cloud
The Ichimoku Cloud, developed by Japanese journalist Goichi Hosoda in the late 1930s, is a versatile indicator that provides a 360-degree view of market conditions. It consists of five main components, each serving a unique purpose:
- Tenkan-sen (Conversion Line):
- Calculation: (Highest High + Lowest Low) / 2 over the past 9 periods.
- Purpose: Acts as a short-term moving average, indicating minor trend directions.
- Kijun-sen (Base Line):
- Calculation: (Highest High + Lowest Low) / 2 over the past 26 periods.
- Purpose: Serves as a medium-term trend indicator and potential support/resistance level.
- Senkou Span A (Leading Span A):
- Calculation: (Tenkan-sen + Kijun-sen) / 2, plotted 26 periods ahead.
- Purpose: Forms one edge of the cloud, indicating future support/resistance levels.
- Senkou Span B (Leading Span B):
- Calculation: (Highest High + Lowest Low) / 2 over the past 52 periods, plotted 26 periods ahead.
- Purpose: Forms the other edge of the cloud, providing additional future support/resistance insights.
- Chikou Span (Lagging Span):
- Calculation: Closing price plotted 26 periods behind.
- Purpose: Offers a perspective on how the current price compares to past prices, helping to confirm trends.
Read More: Ichimoku Support and Resistance
How to Interpret the Cloud’s Signals
The Ichimoku Cloud isn’t just a collection of lines; it’s a dynamic system that paints a vivid picture of market dynamics. Here’s how to interpret its signals:
- Trend Identification:
- Bullish Trend: When the price is above the cloud, and the cloud is green (Senkou Span A is above Senkou Span B).
- Bearish Trend: When the price is below the cloud, and the cloud is red (Senkou Span A is below Senkou Span B).
- Neutral Trend: When the price is within the cloud, indicating consolidation.
- Support and Resistance Levels:
- The cloud edges (Senkou Span A and B) act as dynamic support and resistance levels.
- Kijun-sen and Tenkan-sen also serve as shorter-term support/resistance levels.
- Crossovers:
- Tenkan-sen crossing above Kijun-sen is a bullish signal.
- Tenkan-sen crossing below Kijun-sen is a bearish signal.
- Chikou Span Confirmation:
- If the Chikou Span is above the price from 26 periods ago, it supports a bullish trend.
- If it’s below, it confirms a bearish trend.
Understanding these signals allows traders to make more informed decisions by identifying potential entry and exit points based on trend strength and direction.
Understanding MACD
Explanation of Moving Average Convergence Divergence (MACD)
The Moving Average Convergence Divergence (MACD) is a momentum oscillator developed by Gerald Appel in the late 1970s. It helps traders understand the relationship between two moving averages of a security’s price, providing insights into momentum changes and trend reversals.
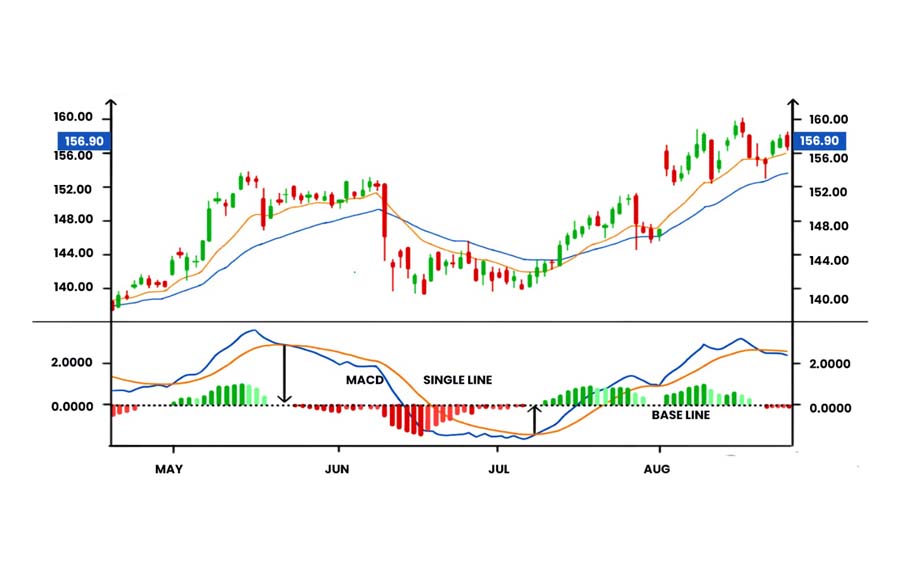
- MACD Line:
- Calculation: 12-period EMA (Exponential Moving Average) minus 26-period EMA.
- Purpose: Indicates the short-term momentum relative to the longer-term momentum.
- Signal Line:
- Calculation: 9-period EMA of the MACD Line.
- Purpose: Acts as a trigger for buy and sell signals.
- Histogram:
- Calculation: MACD Line minus Signal Line.
- Purpose: Visualizes the distance between the MACD Line and the Signal Line, indicating the strength of the momentum.
Key Components: MACD Line, Signal Line, and Histogram
- Bullish Signals:
- When the MACD Line crosses above the Signal Line, it suggests increasing upward momentum.
- If this crossover occurs below the zero line, it may indicate a potential bullish reversal.
- Bearish Signals:
- When the MACD Line crosses below the Signal Line, it signals increasing downward momentum.
- A crossover above the zero line could signify a bearish reversal.
- Divergence:
- Bullish Divergence: Price makes lower lows while MACD makes higher lows, indicating a potential upward reversal.
- Bearish Divergence: Price makes higher highs while MACD makes lower highs, suggesting a potential downward reversal.
The MACD is invaluable for gauging the momentum behind price movements, helping traders anticipate changes in trend direction.
Combining Ichimoku Cloud and MACD
The Synergy Between Ichimoku and MACD
While both Ichimoku and MACD are powerful on their own, their combined use creates a synergistic effect that enhances the reliability of trading signals. Here’s why:
- Complementary Analysis:
- Ichimoku Cloud excels at identifying the overall trend and key support/resistance levels.
- MACD provides insights into the momentum behind price movements and potential reversals.
- Enhanced Signal Confirmation:
- Using both indicators together reduces the likelihood of false signals.
- Ichimoku can confirm the trend direction, while MACD can validate the momentum strength.
- Versatility Across Markets:
- Both indicators are effective in various markets, including forex, stocks, and commodities.
- They can be applied across different time frames, making them suitable for day traders and long-term investors alike.
By combining these tools, traders can gain a more holistic view of the market, increasing their chances of executing successful trades.
Read More: ichimoku entry and exit
How They Complement Each Other in Trend Analysis
- Identifying Strong Trends:
- Ichimoku Cloud shows the trend direction and potential support/resistance zones.
- MACD confirms if the momentum supports the trend indicated by Ichimoku.
- Spotting Reversals Early:
- Ichimoku may signal a trend weakening when price approaches the cloud.
- MACD Divergence can provide early warnings of potential reversals before they occur.
- Timing Entries and Exits:
- Ichimoku helps identify optimal entry points when price breaks through key levels.
- MACD Crossovers assist in timing entries and exits by confirming momentum shifts.
This complementary relationship is at the heart of the Ichimoku and MACD strategy, allowing for more precise and confident trading decisions.
Trading Strategies Using Ichimoku and MACD
Trend Following Strategy
Identifying Trends with Ichimoku
To capitalize on trending markets, follow these steps using the Ichimoku Cloud:
- Assess the Cloud:
- Bullish Trend: Price is above the cloud, and the cloud is green.
- Bearish Trend: Price is below the cloud, and the cloud is red.
- Confirm with Tenkan-sen and Kijun-sen:
- Bullish Signal: Tenkan-sen crosses above Kijun-sen above the cloud.
- Bearish Signal: Tenkan-sen crosses below Kijun-sen below the cloud.
- Chikou Span Confirmation:
- For added assurance, ensure the Chikou Span is above (bullish) or below (bearish) the price from 26 periods ago.
Confirming Momentum with MACD
Once the trend is identified with Ichimoku, use MACD to confirm momentum:
- MACD Line and Signal Line:
- Bullish Momentum: MACD Line is above the Signal Line and preferably above the zero line.
- Bearish Momentum: MACD Line is below the Signal Line and preferably below the zero line.
- Histogram Analysis:
- Increasing histogram bars support the momentum in the trend’s direction.
- Decreasing bars may signal weakening momentum.
- Zero Line Crossovers:
- Crossing above the zero line can indicate strengthening bullish momentum.
- Crossing below suggests increasing bearish momentum.
Pro Tip: Always wait for both indicators to align before entering a trade. This alignment increases the probability of a successful trade by confirming both trend direction and momentum.
Breakout Strategy
Utilizing Support/Resistance Levels from Ichimoku
Breakouts occur when the price moves beyond established support or resistance levels. Use the Ichimoku Cloud and MACD strategy to identify these key levels:
- Cloud Boundaries:
- The edges of the cloud (Senkou Span A and B) act as dynamic support and resistance.
- A price break above or below the cloud signals a potential breakout.
- Kijun-sen Levels:
- The Kijun-sen line can also serve as a support/resistance level.
- Volume Consideration:
- Increased volume during a breakout adds validity to the move.
Confirming Breakouts with MACD and Volume
To ensure the breakout is genuine, confirm with MACD and volume indicators:
- MACD Confirmation:
- Bullish Breakout: MACD Line crosses above the Signal Line, and both are rising.
- Bearish Breakout: MACD Line crosses below the Signal Line, and both are falling.
- Volume Spike:
- A significant increase in volume supports the legitimacy of the breakout.
- Avoid False Breakouts:
- Be cautious if MACD does not confirm the breakout or if volume is lacking.
Combining these indicators helps filter out false breakouts, ensuring you capitalize on genuine market moves.
Reversal Strategy
Recognizing Potential Trend Reversals Using Both Indicators
Market reversals can offer lucrative trading opportunities if identified early. Here’s how to spot them using the MACD Ichimoku strategy:
- Ichimoku Signals:
- Price Crossing the Cloud: A move from above to below the cloud (or vice versa) can signal a trend reversal.
- Tenkan-sen and Kijun-sen Crossovers: A bearish crossover above the cloud or a bullish crossover below the cloud may indicate an impending reversal.
- MACD Divergence:
- Bullish Divergence: Price makes lower lows, but MACD makes higher lows.
- Bearish Divergence: Price makes higher highs, but MACD makes lower highs.
- Chikou Span Confirmation:
- If the Chikou Span crosses the price from 26 periods ago, it adds weight to the reversal signal.
Identifying reversals requires careful analysis, but when done correctly, it can lead to highly profitable trades.
Read More: Ichimoku and RSI
Practical Examples
Case Studies Demonstrating Successful Trades Using Ichimoku and MACD
Case Study 1: Bullish Trend Following in Forex
- Scenario: Trading the EUR/USD pair with a trusted forex trading broker.
- Ichimoku Analysis:
- Price is above the cloud, indicating a bullish trend.
- Tenkan-sen crosses above Kijun-sen above the cloud.
- Chikou Span is above the price from 26 periods ago.
- MACD Confirmation:
- MACD Line crosses above the Signal Line.
- Both lines are above the zero line, and the histogram is increasing.
- Action: Enter a long position with your online forex broker.
- Result: The price continues to rise, leading to a profitable trade.
Case Study 2: Bearish Breakout in Stocks
- Scenario: Trading shares of XYZ Corporation through a regulated forex broker.
- Ichimoku Analysis:
- Price breaks below the cloud after consolidating.
- Kijun-sen acts as resistance.
- MACD Confirmation:
- MACD Line crosses below the Signal Line.
- A negative divergence is observed.
- Volume Spike:
- A significant increase in volume supports the bearish breakout.
- Action: Enter a short position using your broker for forex trading.
- Result: The stock price declines, yielding substantial gains.
Analysis of Historical Data to Validate Strategies
Backtesting is essential to validate the effectiveness of any trading strategy:
- Collect Historical Data:
- Use historical price data for the instrument and time frame of interest.
- Apply Indicators:
- Plot the Ichimoku Cloud and MACD on the charts.
- Identify Trade Signals:
- Mark points where both indicators align to provide entry and exit signals.
- Evaluate Performance:
- Calculate the profitability of the trades.
- Assess the win/loss ratio and drawdowns.
- Refine Strategy:
- Adjust parameters based on findings.
- Consider different time frames or instruments.
Regular backtesting helps in fine-tuning strategies, increasing their reliability in live trading conditions.
Risk Management Techniques

Setting Stop-Loss and Take-Profit Levels Based on Indicator Signals
Effective risk management is the backbone of successful trading:
- Stop-Loss Placement:
- Trend Following Trades:
- For long positions, place the stop-loss below the Kijun-sen or recent swing low.
- For short positions, place it above the Kijun-sen or recent swing high.
- Breakout Trades:
- Set the stop-loss just below the breakout level for longs or above for shorts.
- Trend Following Trades:
- Take-Profit Targets:
- Use the next significant support/resistance levels identified by the Ichimoku Cloud.
- Consider using a risk-reward ratio of at least 1:2.
- Trailing Stops:
- Adjust stop-loss levels as the trade moves in your favor.
- Use the Kijun-sen as a dynamic trailing stop.
By aligning stop-loss and take-profit levels with indicator signals, you ensure that your trades have a solid risk management foundation.
Importance of Position Sizing in Trading
Proper position sizing protects your capital and ensures longevity in trading:
- Determine Risk Per Trade:
- Decide on a percentage of your capital you’re willing to risk (commonly 1-2%).
- Calculate Position Size:
- Use the distance between entry and stop-loss to determine the number of units to trade.
- Adjust for Market Volatility:
- In more volatile markets, consider reducing position sizes.
- Consistent Application:
- Apply your position sizing rules consistently to avoid emotional trading decisions.
Position sizing is not just about maximizing profits but also about minimizing losses, ensuring that no single trade can significantly harm your trading account.
Fine-Tuning Strategies
Adjusting Settings for Ichimoku and MACD for Different Market Conditions
Market conditions are dynamic, and your indicators should adapt accordingly:
- Ichimoku Adjustments:
- Short-Term Trading:
- Consider using shorter periods (e.g., 7, 22, 44) to make the indicator more responsive.
- Long-Term Investing:
- Stick to standard settings or even lengthen periods for smoother signals.
- Short-Term Trading:
- MACD Settings:
- Increasing Sensitivity:
- Use shorter EMAs (e.g., 5, 35, 5) to detect momentum changes earlier.
- Reducing Noise:
- Use longer EMAs to filter out minor fluctuations.
- Increasing Sensitivity:
- Market-Specific Tweaks:
- Different instruments may respond better to customized settings based on their volatility and trading volume.
Regularly reviewing and adjusting your indicator settings can enhance their effectiveness across various market conditions.
Backtesting Strategies for Improved Accuracy
To ensure your strategy performs well, rigorous backtesting is essential:
- Define Clear Entry and Exit Rules:
- Specify exact conditions for entering and exiting trades based on indicator signals.
- Use Reliable Backtesting Software:
- Employ platforms that allow for accurate historical testing, including slippage and commissions.
- Analyze Results:
- Look at key metrics like profit factor, maximum drawdown, and Sharpe ratio.
- Optimize Without Overfitting:
- Adjust parameters to improve performance but avoid over-optimization that doesn’t hold up in live trading.
- Forward Testing:
- After backtesting, apply your strategy in a demo account to see how it performs in real-time conditions.
Backtesting provides confidence in your strategy and helps identify areas for improvement before risking real capital.
Opofinance Services
If you’re ready to implement these strategies, choosing the right broker is crucial. Opofinance, an ASIC-regulated forex broker, offers an exceptional platform tailored for traders seeking reliability and advanced tools.

Why Choose Opofinance?
- Regulation and Security:
- Being ASIC-regulated, Opofinance adheres to strict financial standards, ensuring your funds are secure.
- Social Trading Service:
- Learn from the Best: Copy trades from experienced traders through their innovative social trading platform.
- Community Engagement: Interact with other traders to share insights and strategies.
- Featured on MT5 Brokers List:
- Advanced Trading Tools: Access the MetaTrader 5 platform, renowned for its analytical capabilities.
- Custom Indicators: Utilize custom indicators, including Ichimoku and MACD, for enhanced analysis.
- Safe and Convenient Deposits and Withdrawals:
- Multiple Payment Options: Choose from various methods that suit your convenience.
- Fast Processing: Enjoy quick transaction times, so you never miss a trading opportunity.
Opofinance’s Commitment to Traders
- Educational Resources:
- Access webinars, tutorials, and articles to improve your trading knowledge, including mastering the MACD Ichimoku strategy.
- Customer Support:
- Receive dedicated support from a team of professionals ready to assist you.
- Competitive Spreads:
- Benefit from tight spreads that can improve your trading profitability.
With Opofinance, you not only get a reliable platform but also a partner committed to your trading success. It’s the ideal broker for forex trading when implementing advanced strategies like the Ichimoku Cloud and MACD strategy.
Conclusion
The combination of the Ichimoku and MACD indicators offers traders a powerful toolkit for navigating the financial markets. By understanding and applying these tools effectively, you can:
- Identify High-Probability Trades: Gain clarity on trend direction and momentum using the MACD Ichimoku strategy.
- Improve Risk Management: Set informed stop-loss and take-profit levels.
- Enhance Trading Strategies: Adapt to different market conditions with fine-tuned settings.
Remember, successful trading isn’t about predicting the market but about making informed decisions based on sound analysis. Practice these strategies using a demo account from a reputable online forex broker, refine them through backtesting, and consider partnering with a trusted broker like Opofinance to execute your trades with confidence.
Key Takeaways
- Synergistic Use of Indicators: Combining Ichimoku and MACD enhances market analysis.
- Versatile Strategies: Apply trend following, breakout, and reversal strategies across various markets using the Ichimoku Cloud and MACD strategy.
- Risk Management is Crucial: Effective use of stop-loss, take-profit, and position sizing protects your capital.
- Continuous Learning and Adaptation: Regularly backtest and adjust your strategies for optimal performance.
- Choose the Right Broker: A regulated forex broker like Opofinance can provide the tools and support you need.
Can the Ichimoku and MACD strategy be used in forex trading exclusively?
No, while these indicators are popular in forex trading due to the market’s liquidity and volatility, they are also effective in other markets such as stocks, commodities, and cryptocurrencies. The key is to adjust the indicator settings to suit the specific characteristics of the market you are trading. Using a reliable broker for forex trading or other assets can facilitate this.
How does the Ichimoku Cloud handle false signals during sideways markets?
During sideways or consolidating markets, the Ichimoku Cloud and MACD strategy can produce false signals as the price moves within a narrow range. To mitigate this, traders can look for confirmation from other indicators like MACD or wait for the price to break out of the cloud with strong momentum before taking a position. Partnering with an experienced forex broker can also provide additional tools and insights.
Is it advisable to rely solely on Ichimoku and MACD for trading decisions?
While Ichimoku and MACD are powerful, relying solely on any indicators can be risky. It’s advisable to incorporate additional analysis methods such as fundamental analysis, other technical indicators like RSI or Bollinger Bands, and keeping abreast of market news and events. This holistic approach can improve decision-making and trade outcomes, especially when executed through a reputable online forex broker.


One Response
Pretty nice post. I just stumbled upon your weblog and wanted to say that I’ve really enjoyed browsing your
blog posts. After all I’ll be subscribing to your rss feed and I hope you write again very soon!