Ready to transform your forex trading strategy? Ichimoku Support and Resistance is a powerful, all-in-one tool that can elevate your approach by providing precise trend analysis, identifying dynamic support and resistance levels, and signaling the best moments to enter and exit trades. This guide reveals how to harness Ichimoku to make smarter, faster, and more profitable trading decisions.
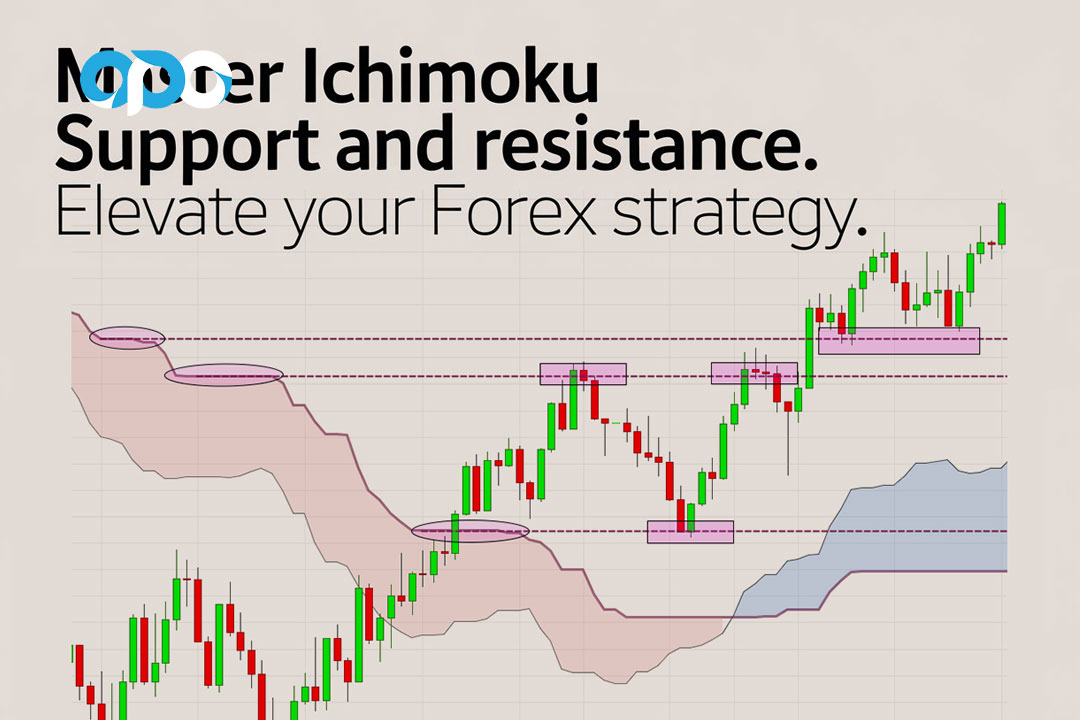
Whether you’re working with a regulated forex broker or trading solo, this approach gives you a crucial edge in today’s fast-paced markets. By mastering Ichimoku Support and Resistance, you’ll learn not just to interpret price movements but to anticipate them, maximizing your profit potential and protecting against risk. Dive in and discover how to unlock the full potential of this tool to achieve consistent success in forex trading.
Introduction to Ichimoku
In the intricate landscape of forex trading, precision and strategic analysis are paramount for success. Among the myriad of tools available, the Ichimoku indicator stands out as a robust system designed to provide a comprehensive view of the market. Originating from Japan, Ichimoku Kinko Hyo translates to “one glance equilibrium chart,” emphasizing its ability to offer a swift, holistic perspective of price action.
Overview of the Ichimoku Indicator
The Ichimoku indicator is a versatile tool that amalgamates multiple elements to gauge market trends, momentum, and potential support and resistance levels. Unlike traditional indicators that may require separate tools for different analyses, Ichimoku integrates them into a single, cohesive framework. This integration allows traders to make informed decisions with greater efficiency and confidence.
Importance of Support and Resistance in Trading
Support and resistance levels are fundamental concepts in technical analysis, serving as key markers where price action tends to reverse or consolidate. Support acts as a floor preventing the price from declining further, while resistance serves as a ceiling hindering price increases. Accurately identifying these levels is crucial as they help traders determine entry and exit points, set stop-loss orders, and manage risk effectively. Incorporating support and resistance analysis into your trading strategy can significantly enhance your ability to predict market movements and optimize trade outcomes.
Embracing Ichimoku Support and Resistance equips traders with a powerful toolset to navigate the forex market with precision and strategic foresight.
Read More: Ichimoku and RSI
Understanding the Components of Ichimoku
The Ichimoku system comprises five primary components, each contributing uniquely to the overall analysis. Understanding these components is essential to leveraging Ichimoku Support and Resistance effectively.
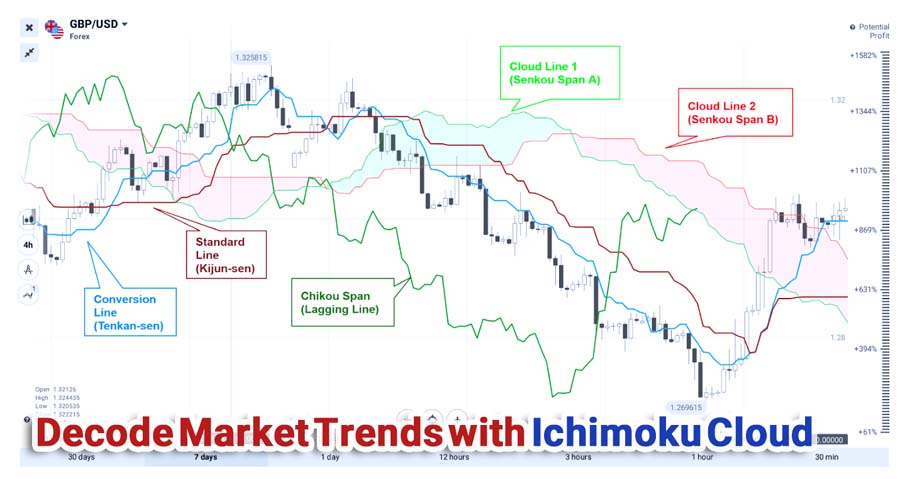
Tenkan-sen (Conversion Line)
Calculation and Significance
The Tenkan-sen, or Conversion Line, is calculated by averaging the highest high and the lowest low over the past nine periods:

Significance: The Tenkan-sen serves as a short-term indicator of trend direction and momentum. It reacts swiftly to price changes, making it a valuable tool for identifying potential reversals and entry points. When the price approaches the Tenkan-sen, it often acts as a support or resistance level, providing critical insights for trading decisions.
Kijun-sen (Base Line)
Role in Identifying Momentum
The Kijun-sen, or Base Line, is calculated by averaging the highest high and the lowest low over the past twenty-six periods:

Role in Momentum: The Kijun-sen represents a medium-term trend indicator, offering a more stable perspective compared to the Tenkan-sen. It helps in identifying the underlying momentum of the market. When the Tenkan-sen crosses above the Kijun-sen, it signals bullish momentum, whereas a crossover below indicates bearish momentum. The Kijun-sen also acts as a support and resistance level, enhancing the accuracy of trade signals.
Senkou Span A and B (Leading Spans)
Formation of the Kumo Cloud
The Senkou Span A and Senkou Span B are calculated as follows:

Formation of the Kumo Cloud: These two lines form the Kumo Cloud, a key feature of the Ichimoku system. The area between Senkou Span A and Senkou Span B creates a shaded region that serves as dynamic support and resistance. The Kumo Cloud’s position, thickness, and color provide immediate visual cues about the market’s trend and potential reversal points.
Dynamic Support and Resistance Levels
The Kumo Cloud adapts to real-time market conditions, making it a dynamic indicator of support and resistance. When the price is above the cloud, it suggests a bullish trend with the upper boundary acting as resistance and the lower boundary as support. Conversely, when the price is below the cloud, it indicates a bearish trend with the upper boundary serving as support and the lower boundary as resistance. The cloud’s dynamic nature allows traders to anticipate shifts in market sentiment and adjust their strategies accordingly.
Chikou Span (Lagging Span)
Historical Perspective on Price Action
The Chikou Span, or Lagging Span, is the closing price plotted 26 periods back on the chart. This component provides a historical perspective, allowing traders to compare current price action with past movements.
Historical Perspective: By overlaying the Chikou Span with past price data, traders can identify confluences and divergences that may signal trend continuations or reversals. For instance, if the Chikou Span is above the price from 26 periods ago, it confirms a bullish trend. Conversely, if it is below, it indicates a bearish trend. The Chikou Span adds an additional layer of validation, ensuring that trade signals are backed by historical price movements.
Together, these components create a robust framework that empowers traders to analyze the market comprehensively and make informed trading decisions.
Read More: Ichimoku and Fibonacci Strategy
Identifying Support and Resistance Levels with Ichimoku
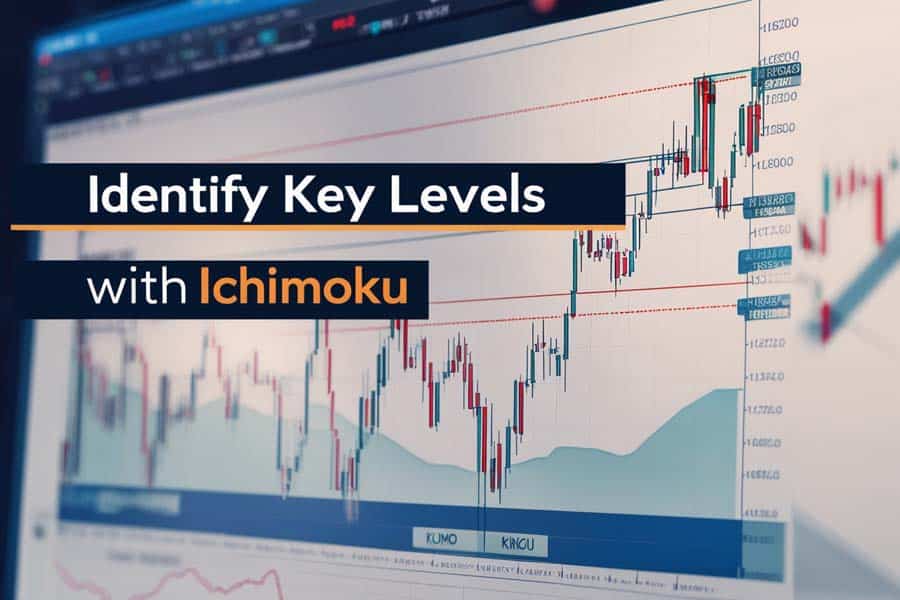
Accurately identifying support and resistance levels is a cornerstone of successful trading. The Ichimoku system excels in this area through its unique components, providing dynamic and reliable levels that adapt to market conditions.
How to Use the Kumo Cloud for Support/Resistance
The Kumo Cloud is the heart of Ichimoku Support and Resistance. It offers a visual and dynamic representation of these critical levels.
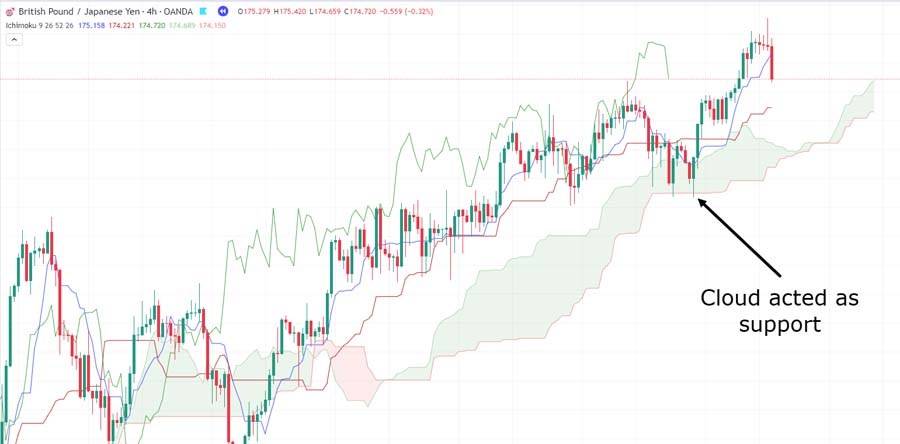
- Upper Boundary (Senkou Span A): During an uptrend, this boundary acts as a resistance level. When the price approaches Senkou Span A from below, selling pressure may emerge, presenting a potential exit point for long positions.
- Lower Boundary (Senkou Span B): In an uptrend, this boundary serves as a support level. If the price retraces to Senkou Span B, buying interest may be triggered, offering a potential entry point for long positions.
- Inverse Roles in Downtrends: In a downtrend, Senkou Span A becomes a support level, while Senkou Span B transforms into a resistance level. This inversion allows traders to adapt their strategies based on the prevailing trend.
Using the Kumo Cloud provides traders with a clear and adaptable framework to identify and act upon support and resistance levels, enhancing the precision of their trading strategies.
Role of the Tenkan-sen and Kijun-sen in Determining Levels
The Tenkan-sen and Kijun-sen play pivotal roles in refining support and resistance levels within the Ichimoku framework.
- Tenkan-sen (Conversion Line):
- Short-Term Support and Resistance: Acts as a dynamic support or resistance level depending on the price approach.
- Signal Generation: Crossovers between the Tenkan-sen and Kijun-sen can indicate potential trend reversals or continuations, providing actionable trade signals.
- Kijun-sen (Base Line):
- Strong Support and Resistance: Offers more reliable levels due to its longer calculation period.
- Trend Confirmation: Crosses between Tenkan-sen and Kijun-sen confirm the strength and direction of the trend.
The interplay between these lines enhances the accuracy of support and resistance identification, allowing traders to fine-tune their entry and exit points with greater confidence.
Importance of Flat Areas in the Kumo Cloud
Flat areas within the Kumo Cloud, where Senkou Span A and Senkou Span B converge, hold significant importance in identifying support and resistance levels.
- Consolidation Zones: Flat areas indicate periods of market consolidation, where the price is range-bound between support and resistance without a clear trend.
- Potential Reversals: These areas often precede major trend reversals or significant breakouts, as the lack of momentum can lead to a shift in market sentiment.
- Volatility Indicators: A flat Kumo suggests reduced volatility, signaling that the market may be preparing for a substantial move in either direction once the consolidation phase concludes.
Recognizing flat areas within the Kumo Cloud allows traders to anticipate potential shifts in market momentum, positioning themselves advantageously for upcoming price movements.
By mastering the identification of support and resistance levels through the Ichimoku system, traders can enhance their strategic approach, ensuring more informed and effective trading decisions.
Read More: Ichimoku and EMA
Practical Application of Ichimoku for Trading
Understanding the theoretical aspects of Ichimoku is only the beginning. Applying these principles practically can significantly enhance your trading effectiveness. Here, we explore strategies tailored for different market conditions, the synergy with other indicators, and robust risk management techniques using Ichimoku levels.
Strategies for Using Ichimoku in Different Market Conditions
1. Trending Markets
- Uptrend:
- Indicators: Price above the Kumo Cloud, Tenkan-sen above Kijun-sen, Chikou Span above price.
- Action: Look for buying opportunities when the price retraces to the Kijun-sen, which acts as support.
- Downtrend:
- Indicators: Price below the Kumo Cloud, Tenkan-sen below Kijun-sen, Chikou Span below price.
- Action: Look for selling opportunities when the price rallies to the Kijun-sen, which acts as resistance.
2. Consolidating Markets
- Within the Kumo Cloud:
- Indicators: Price trading within the cloud, minimal movement between Tenkan-sen and Kijun-sen.
- Action: Prepare for potential breakouts by monitoring price action near the cloud boundaries. Set stop-loss levels to manage risk.
3. Reversal Signals
- Bullish Reversal:
- Indicators: Tenkan-sen crosses above Kijun-sen below the Kumo Cloud.
- Action: Consider entering a long position as confirmation of a shift from a downtrend to an uptrend.
- Bearish Reversal:
- Indicators: Tenkan-sen crosses below Kijun-sen above the Kumo Cloud.
- Action: Consider entering a short position as confirmation of a shift from an uptrend to a downtrend.
Tailoring your Ichimoku strategy to different market conditions ensures that you remain adaptable and responsive to the ever-changing forex landscape.
Combining Ichimoku with Other Indicators for Confirmation
While Ichimoku is a comprehensive tool, combining it with other indicators can enhance signal reliability and reduce false positives.
1. Relative Strength Index (RSI):
- Usage: Measures the speed and change of price movements to identify overbought or oversold conditions.
- Integration: Confirm Ichimoku signals by ensuring RSI supports the anticipated move. For example, a bullish Ichimoku signal with RSI below 70 strengthens the buy decision.
2. Moving Average Convergence Divergence (MACD):
- Usage: Identifies trend direction and momentum by showing the relationship between two moving averages.
- Integration: Use MACD to confirm trend strength indicated by Ichimoku. A bullish Ichimoku signal with MACD above the signal line reinforces the buy signal.
3. Volume Indicators:
- Usage: Measure the number of shares or contracts traded, providing insights into the strength of a price move.
- Integration: Higher volume on Ichimoku signal confirmations indicates stronger conviction, enhancing the reliability of the trade.
Combining Ichimoku with complementary indicators creates a more robust trading system, increasing the probability of successful trades.
Risk Management Techniques Using Ichimoku Levels
Effective risk management is essential to long-term trading success. Ichimoku Support and Resistance levels offer valuable reference points for setting stop-loss and take-profit orders.
1. Stop-Loss Placement:
- Above/Below Kumo Cloud: For long positions, place stop-loss orders below the Kumo Cloud to protect against significant downside moves. For short positions, place them above the cloud to guard against upward volatility.
- Kijun-sen: Use the Kijun-sen as a dynamic stop-loss level. If the price crosses below this line in a long position, it may indicate a trend reversal, signaling the need to exit the trade.
2. Take-Profit Targets:
- Kumo Boundaries: Set take-profit levels near the Senkou Span A or B, leveraging the cloud’s dynamic support and resistance as potential reversal points.
- Multiple Targets: Implement partial profit-taking strategies at different Ichimoku levels to maximize gains while minimizing risk.
3. Position Sizing:
- Volatility Consideration: Adjust position sizes based on the width of the Kumo Cloud. A wider cloud indicates higher volatility, suggesting smaller position sizes to manage increased risk.
Implementing these risk management techniques using Ichimoku levels ensures that you protect your capital while optimizing profit potential.
By integrating these practical applications, traders can harness the full power of Ichimoku Support and Resistance to navigate diverse market scenarios with confidence and precision.
Time Theory in Ichimoku
Time plays a crucial role in trading, influencing how indicators like Ichimoku interpret market dynamics. Understanding the significance of time intervals and their impact on the Ichimoku system can enhance your trading strategy’s effectiveness.
Understanding the Significance of Time Intervals
1. Timeframes and Analysis:
- Short-Term Trading: In lower timeframes (e.g., 5-minute, 15-minute charts), Ichimoku provides quick signals, ideal for day traders seeking to capitalize on short-term price movements.
- Long-Term Trading: Higher timeframes (e.g., daily, weekly charts) offer broader trend insights, suitable for swing traders and investors focusing on long-term positions.
2. Ichimoku’s Time Components:
- Tenkan-sen and Kijun-sen: The different periods used for these lines (9 and 26 respectively) align with specific time intervals, allowing Ichimoku to capture both short-term and medium-term trends.
- Senkou Span A and B: These leading spans project future support and resistance levels, integrating time into the analysis by plotting 26 periods ahead.
How Time Influences Market Dynamics
1. Trend Persistence:
- Longer Timeframes: Trends identified on higher timeframes tend to persist longer, providing more reliable trading opportunities.
- Shorter Timeframes: Trends on lower timeframes can be more volatile and subject to frequent reversals, requiring agile trading strategies.
2. Signal Confirmation:
- Multiple Timeframe Analysis: Cross-referencing Ichimoku signals across different timeframes can enhance signal confirmation. For instance, a bullish signal on both the daily and hourly charts provides stronger validation than a signal on a single timeframe.
3. Timing of Trades:
- Entry and Exit Timing: Understanding the time component helps in timing entries and exits more effectively. Aligning trades with the appropriate timeframe ensures that signals are consistent with your trading goals.
Grasping the time theory in Ichimoku allows traders to align their strategies with market rhythms, optimizing trade timing and enhancing overall performance.
By incorporating an in-depth understanding of time intervals and their influence on market dynamics, traders can leverage Ichimoku more effectively, ensuring that their strategies are both timely and contextually relevant.
Common Mistakes and Misconceptions
Even with a powerful tool like Ichimoku, traders can make errors that undermine their efforts. Understanding and avoiding these common mistakes is crucial.
Misinterpretations of Ichimoku Signals
1. Ignoring the Kumo Cloud:
- Mistake: Overlooking the cloud’s significance leads to misinterpreting trends.
- Solution: Always consider the price’s position relative to the Kumo Cloud for accurate trend analysis.
2. Overcomplicating the Indicator:
- Mistake: Using all Ichimoku components without a clear strategy causes confusion.
- Solution: Focus on key components like Tenkan-sen, Kijun-sen, and Kumo Cloud to maintain clarity.
3. Misreading Crossovers:
- Mistake: Interpreting Tenkan-sen and Kijun-sen crossovers without overall trend context.
- Solution: Confirm crossovers with Kumo Cloud position and Chikou Span alignment.
Over-Reliance on One Component Without Considering the Whole System
1. Focusing Solely on the Tenkan-sen:
- Mistake: Relying only on Tenkan-sen for trade signals misses broader market context.
- Solution: Integrate Kijun-sen and Kumo Cloud for a comprehensive view.
2. Neglecting Time Theory:
- Mistake: Ignoring time intervals leads to mismatched strategies.
- Solution: Align Ichimoku analysis with appropriate timeframes and use multiple timeframes for confirmation.
3. Ignoring the Chikou Span:
- Mistake: Overlooking the Chikou Span misses key trend confirmations.
- Solution: Always include the Chikou Span to validate trend strength and direction.
Avoiding these common mistakes ensures you harness Ichimoku’s full potential, leading to more accurate and reliable trading decisions.
By maintaining a holistic approach and respecting the interconnectedness of Ichimoku components, traders can mitigate errors and enhance their strategies.
Pro Tips for Advanced Traders
Elevate your trading with these advanced Ichimoku Support and Resistance strategies:
1. Combine with Fibonacci Retracement
- Integration: Align Fibonacci levels with Kumo boundaries or Tenkan-sen/Kijun-sen lines.
- Benefit: Reinforces support/resistance strength, increasing trade success probability.
2. Utilize Multiple Timeframe Analysis
- Strategy: Confirm Ichimoku signals across different timeframes (e.g., daily and weekly charts).
- Benefit: Enhances signal reliability and reduces false positives.
3. Monitor Kumo Thickness and Angle
- Assessment: Evaluate cloud thickness and slope to gauge trend strength and potential reversals.
- Benefit: Adjust strategies based on trend momentum insights.
4. Implement Trailing Stop-Loss Strategies
- Technique: Use Ichimoku levels to set dynamic trailing stops.
- Benefit: Locks in profits while allowing trades to run with the trend.
5. Leverage Chikou Span for Confirmation
- Action: Ensure Chikou Span aligns with trade direction (above price for longs, below for shorts).
- Benefit: Adds validation to trend strength, enhancing signal accuracy.
6. Automate Trading Strategies with MT5
- Tool: Use MetaTrader 5 (MT5) to automate Ichimoku-based trades.
- Benefit: Enhances execution speed and removes emotional biases.
These pro tips empower advanced traders to refine their Ichimoku strategies, ensuring greater precision, adaptability, and profitability.
Incorporating these sophisticated techniques maximizes Ichimoku Support and Resistance effectiveness, keeping you ahead in the competitive forex market.
Opofinance Services: Elevate Your Trading with ASIC Regulated Broker
Partnering with a reliable broker is essential when implementing Ichimoku Support and Resistance strategies. Opofinance stands out as an ASIC regulated forex broker, offering a suite of services tailored for both novice and advanced traders:
Social Trading Service
Leverage Opofinance’s social trading platform to follow and replicate successful traders’ strategies. Enhance your trading performance through shared insights and experiences, making it easier to integrate Ichimoku strategies into your routine.
MT5 Broker Listing
Opofinance is officially featured on the MT5 brokers list, providing access to a robust trading platform known for its advanced charting tools, automated trading capabilities, and seamless execution. MT5’s compatibility with Ichimoku indicators ensures precise and efficient strategy implementation.
Safe and Convenient Deposits and Withdrawals
Experience hassle-free transactions with Opofinance’s secure deposit and withdrawal methods. Your funds are safeguarded, allowing you to focus on your trading strategies without worrying about financial security.
Choosing Opofinance means aligning with a broker that prioritizes safety, innovation, and trader success, perfectly complementing your use of Ichimoku Support and Resistance.
With Opofinance, gain access to the tools, support, and community needed to elevate your trading game and achieve your financial goals.
Conclusion
In conclusion, mastering Ichimoku support and resistance can significantly elevate your trading strategy by offering a comprehensive, real-time analysis framework. With the Ichimoku Cloud’s dynamic support and resistance, traders gain a strategic advantage in identifying trend strengths, potential reversals, and optimal entry and exit points. Integrating this tool allows for adaptability in various market conditions, minimizing risk and enhancing decision-making accuracy. Leveraging Ichimoku in conjunction with other indicators like RSI or MACD, and applying advanced strategies such as multiple timeframe analysis, can lead to more robust, profitable trading practices.
Key Takeaways
- Comprehensive Analysis: Ichimoku integrates multiple indicators for a holistic market view.
- Dynamic Support and Resistance: The Kumo Cloud adapts to market changes, offering reliable levels.
- Strategic Integration: Combining Ichimoku with RSI, MACD, and Fibonacci enhances trading decisions.
- Advanced Strategies: Utilize multiple timeframe analysis and automation for greater effectiveness.
- Risk Management: Use Ichimoku levels for stop-loss and take-profit to protect capital and maximize gains.
- Trusted Broker Partnership: Opofinance provides a secure, innovative, and supportive trading environment.
These key takeaways encapsulate the essence of utilizing Ichimoku Support and Resistance to achieve trading success.
Integrate these points into your strategy to harness Ichimoku’s full potential, driving consistent and informed trading performance.
How does Ichimoku handle false breakout signals?
Ichimoku handles false breakout signals by requiring multiple components to align for a valid signal. The Kumo Cloud provides dynamic support/resistance, Tenkan-sen and Kijun-sen crossovers add confirmation, and the Chikou Span must align with the trend direction. This multi-layered confirmation reduces the likelihood of acting on false breakouts, enhancing signal reliability.
Can Ichimoku be effectively used for cryptocurrency trading?
Yes, Ichimoku can be effectively used for cryptocurrency trading. Its comprehensive framework for identifying trends, momentum, and support/resistance levels applies across various asset classes, including cryptocurrencies. However, due to higher volatility and unique market dynamics, traders should adjust Ichimoku settings and incorporate additional risk management strategies to account for rapid price movements.
What role does the Ichimoku Cloud play in trend strength assessment?
The Ichimoku Cloud plays a critical role in assessing trend strength by visualizing the relationship between Senkou Span A and Senkou Span B. A thick, steeply angled cloud indicates strong trend momentum, while a thin or flat cloud suggests weaker momentum or potential consolidation. Additionally, the cloud’s color and direction provide immediate visual cues about the prevailing trend, helping traders gauge its strength and potential longevity.


