

The IPDA trading strategy, based on the Interbank Price Delivery Algorithm, is a sophisticated approach to forex trading that aims to decode and capitalize on the movements of large institutional players in the currency markets. But what exactly is IPDA, and how can it revolutionize your trading?
IPDA stands for Interbank Price Delivery Algorithm. At its core, it’s a method used to calculate the highs and lows of the 20-day, 40-day, and 60-day periods in the forex market. This algorithm is designed to track and interpret the complex interactions between major financial institutions, providing retail traders with invaluable insights into potential market movements. For those looking to leverage these insights, partnering with a reliable forex trading broker can be essential to executing strategies effectively and navigating the dynamic forex landscape.
The IPDA trading strategy is built on the premise that large financial institutions, such as banks and hedge funds, have a significant impact on price movements in the forex market. By understanding and tracking these institutional order flows, retail traders can potentially gain an edge and make more informed trading decisions.
Key components of the IPDA trading strategy include:
- Analysis of quarterly market shifts
- Focus on 20, 40, and 60-day price cycles
- Identification of order blocks and fair value gaps
- Understanding of four key market conditions: Expansion, Retracement, Reversal, and Consolidation
- Integration of futures market analysis for enhanced insight
This comprehensive guide will delve deep into the IPDA trading strategy, unraveling its core principles, highlighting its significant benefits, and providing you with actionable insights on how to implement this powerful approach to potentially skyrocket your trading performance.
Whether you’re a seasoned forex trader looking to refine your approach or a newcomer eager to learn about advanced trading techniques, this in-depth exploration of the IPDA trading strategy will equip you with the knowledge and tools to elevate your trading game to unprecedented heights.
In the following sections, we’ll break down each component of the IPDA strategy, explain how to implement it in your trading, and explore advanced techniques to maximize its effectiveness. Let’s embark on this journey to master the IPDA trading strategy and unlock new levels of potential in your forex trading.
Decoding the IPDA Algorithm: The Heartbeat of Institutional Forex Trading
The Interbank Price Delivery Algorithm (IPDA) is the pulsating heart of the IPDA trading strategy. This sophisticated algorithm is meticulously designed to analyze and interpret the complex dance of major players in the forex market. Let’s break down its key components and understand why it’s revolutionizing forex trading:
1. The Rhythm of Quarterly Shifts
To truly grasp the IPDA trading algorithm, one must first understand the concept of higher timeframe quarterly shifts. These shifts are the market’s natural rhythm, occurring every 3-4 months when the market tends to reset and change direction. This phenomenon, known as a quarterly shift, is crucial because markets rarely maintain the same direction for an entire year, thanks to the strategic maneuvers of market makers.
Key Points:
- Quarterly shifts occur every 3-4 months
- They represent a reset and potential change in market direction
- Understanding these shifts is crucial for long-term trend analysis
2. The Ebb and Flow of Price Movement
In the IPDA framework, price movement follows a distinct pattern, flowing from external to internal points. External refers to the swing highs and lows—the visible peaks and troughs on a chart. Internal, on the other hand, points to the Fair Value Gaps (FVGs)—those hidden pockets of opportunity that savvy traders seek to exploit.
Key Points:
- Price moves from external (swing highs/lows) to internal (FVGs)
- FVGs represent inefficiently traded areas and potential reversal points
- Understanding this flow helps in predicting potential price movements
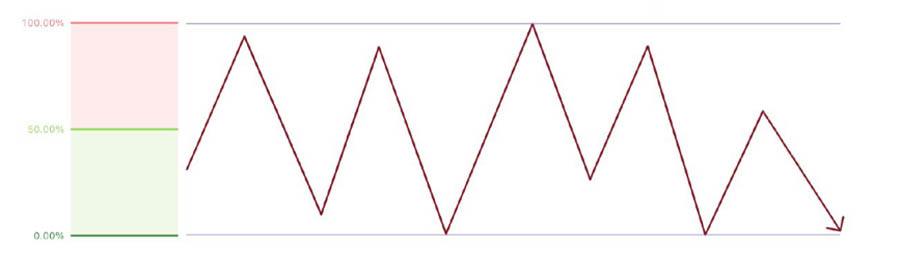
3. The 20-40-60 Day Algorithm: The Golden Triad
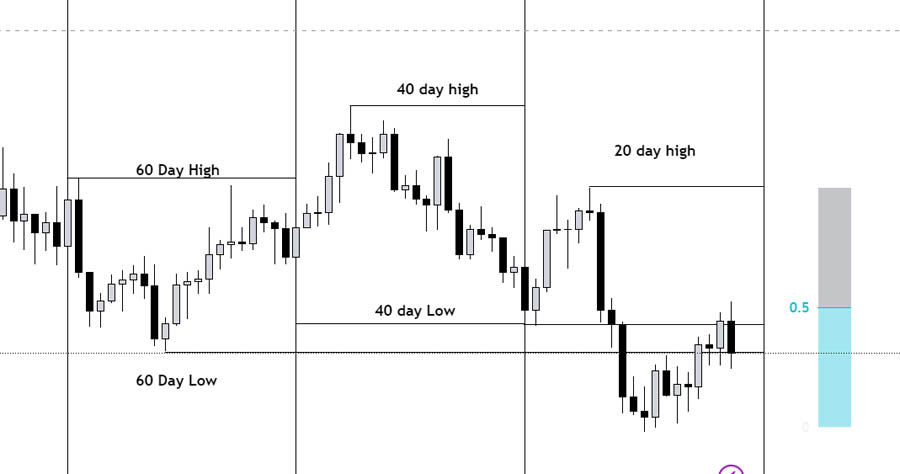
At the core of the IPDA strategy lies the golden triad—the 20, 40, and 60-day highs and lows. This algorithm focuses on these specific timeframes, recognizing that after taking liquidity from, say, the 60-day high, the market typically needs to balance by taking the 60-day low. This predictable yet complex pattern forms the bedrock of the IPDA’s design and effectiveness.
Key Points:
- Focus on 20, 40, and 60-day highs and lows
- Market seeks to balance by taking both highs and lows
- This pattern forms the basis for predicting future price movements
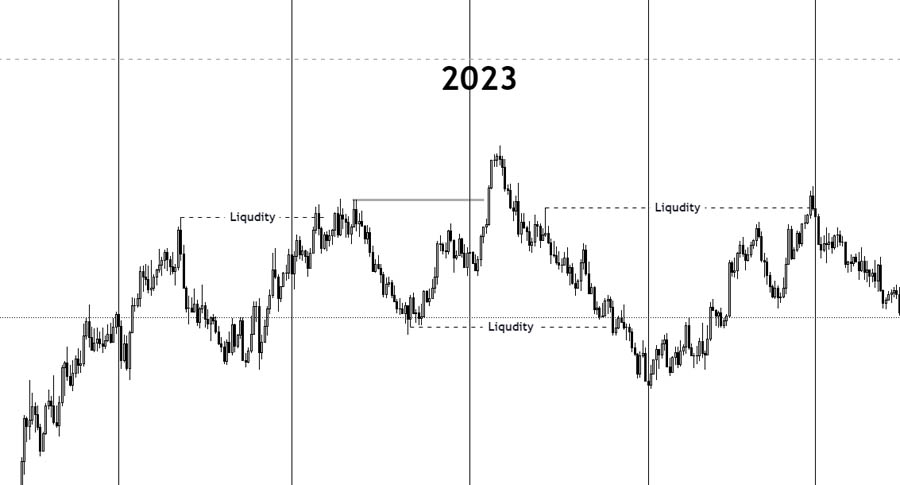
4. Deciphering Institutional Order Flow
One of the IPDA’s most powerful features is its ability to track and analyze the flow of orders from large institutional traders. By identifying areas where significant buy or sell orders are placed, traders can anticipate potential price movements with greater accuracy, essentially allowing them to “peek behind the curtain” of institutional trading.
Key Points:
- Track large institutional buy and sell orders
- Identify areas of significant liquidity
- Anticipate potential price movements based on institutional activity
The Four Pillars of Market Movement: Understanding IPDA’s Market Conditions
To master the IPDA trading strategy, it’s crucial to understand the four fundamental market conditions that govern price movement. These conditions form the bedrock of institutional order flow and are essential for accurate market analysis and prediction:
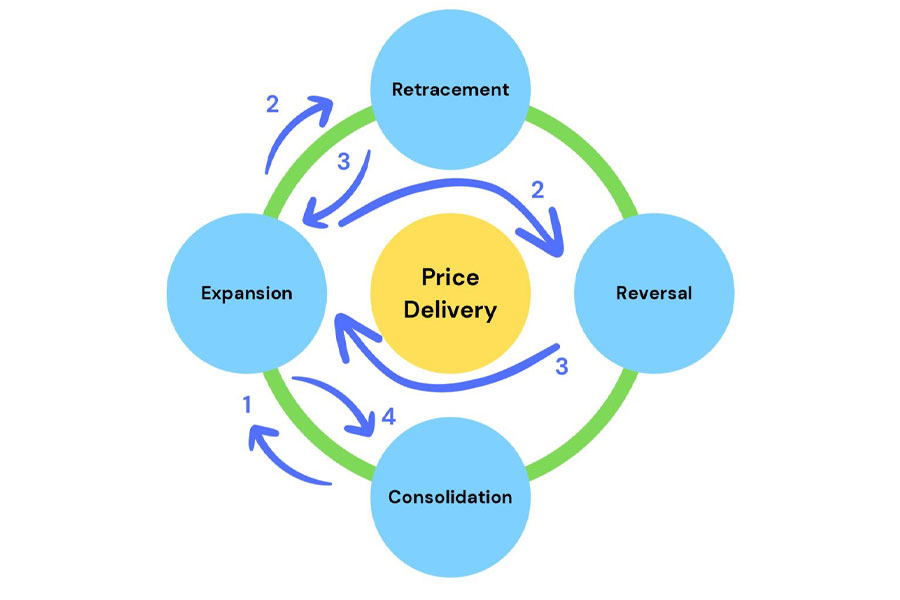
1. Expansion: The Market’s Surge
Expansion is the market’s moment of dynamism, characterized by rapid price movement away from a level of equilibrium. This condition signals that Market Makers are ready to reprice to the next objective.
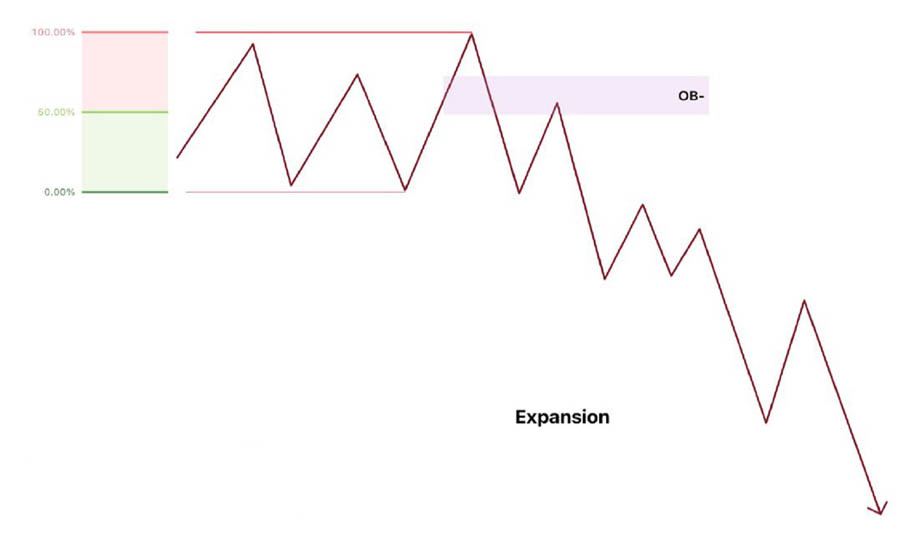
Key characteristics of Expansion:
- Originates from a consolidation phase
- Utilizes a displacement to break out of consolidation
- Forms an Order Block during the breakout
- The Order Block is typically located near or at the consolidation’s equilibrium point
Trading Tip: Look for explosive moves out of tight trading ranges, as these often signal the start of an expansion phase.
Read more: Mastering ICT Weekly Profiles
2. Retracement: The Strategic Pullback
Retracement occurs when price retreats within the range established by the previous expansion. It’s a phase where the market seeks out inefficiently traded areas.
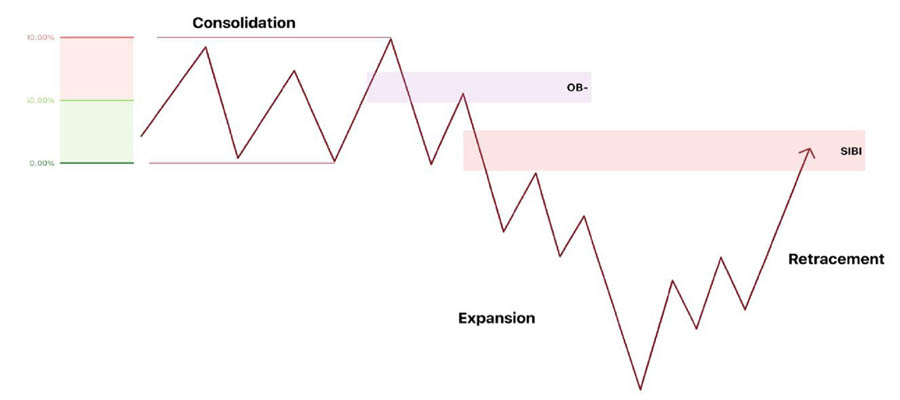
Key characteristics of Retracement:
- Happens within the price range set by a displacement
- Fair Value Gaps (FVGs) and Imbalances indicate prime retracement zones
- Essential for identifying potential entry points in the midst of a larger trend
Trading Tip: Focus on FVGs and Imbalances during retracements for high-probability entry opportunities.
3. Reversal: The Trend Shift
A reversal marks a complete change in the established trend direction. It’s a critical phase that often catches unprepared traders off guard.
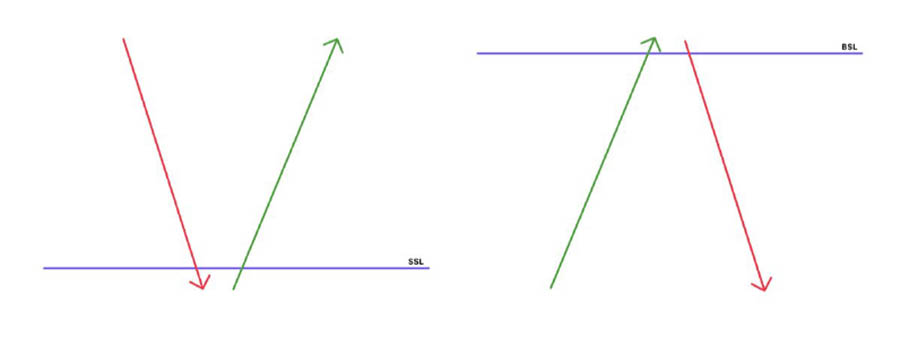
Key characteristics of Reversal:
- Typically occurs at Liquidity Pools
- Bullish Liquidity Pools are found beneath previous lows
- Bearish Liquidity Pools are located above former highs
Trading Tip: Pay close attention to price action around significant Liquidity Pools, as these areas often precede major reversals.
4. Consolidation: The Calm Before the Storm
Consolidation is a period of price constriction within a trading range, showing no immediate inclination to break out. It’s often a phase of accumulation or distribution by larger players.
Key characteristics of Consolidation:
- Price is confined within a defined trading range
- Indicates Market Makers building liquidity above and below current prices
- Often precedes significant expansions
- Look for displacements from the consolidation’s equilibrium price
Trading Tip: Use consolidation phases to prepare for potential breakouts, identifying key levels for future expansion.
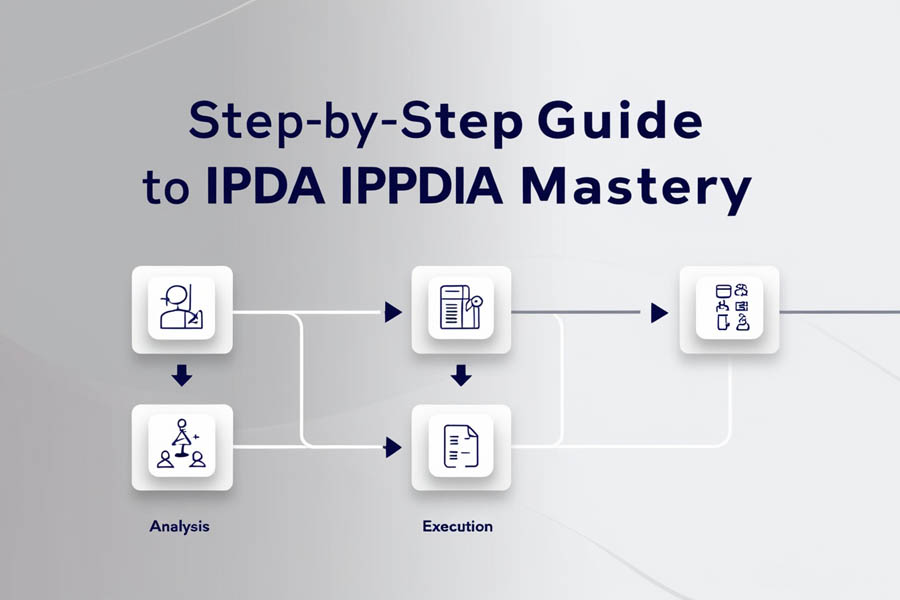
Implementing the IPDA Trading Strategy: A Step-by-Step Guide
Now that we’ve laid the groundwork, let’s explore how to put the IPDA trading strategy into practice. Follow these steps to harness the power of institutional trading insights:
1. Analyze Higher Timeframes: The Big Picture Perspective
Begin your analysis by examining weekly and daily charts. This macro view is crucial for identifying overall market structure and prevailing trends. Pay particular attention to quarterly shifts in the futures market, as these can signal potential directional changes.
Action Step: Create a weekly ritual of analyzing higher timeframe charts to set the stage for your trading week.
2. Identify Key Levels: Mapping the Battlefield
Mark important support and resistance levels on your charts, along with potential liquidity pools. Focus specifically on the 20, 40, and 60-day highs and lows—these are the cornerstone levels of the IPDA strategy.
Action Step: Develop a system for clearly marking these levels on your charts, using different colors or styles for easy identification.
3. Spot Order Blocks: The Institutional Footprint
Identify areas of strong buying or selling pressure that could indicate institutional activity. Remember, order blocks are often found near or at the equilibrium of consolidation patterns.
Action Step: Practice identifying order blocks on historical charts to train your eye for these critical formations.
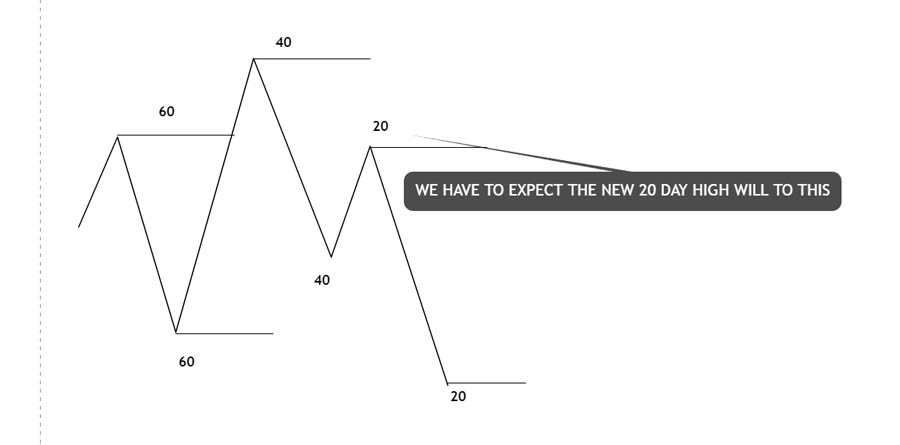
4. Recognize Specific Patterns: The IPDA Playbook
Stay alert for patterns like bullish and bearish order blocks, liquidity sweeps, and price rejection at key levels. Pay special attention to fake breakouts around the 20-day highs and lows—these can be golden opportunities for savvy traders.
Action Step: Create a personal playbook of IPDA patterns, documenting examples you observe in real market conditions.
5. Leverage Fair Value Gaps (FVGs): Finding Hidden Opportunities
When price retraces within a range formed by displacement, look for Fair Value Gaps or Imbalances. These represent areas that were not efficiently traded and often become targets for price return.
Action Step: Develop a method for quickly identifying FVGs on your charts, possibly using indicators or custom scripts if your platform allows.
6. Confirm with Lower Timeframes: Fine-Tuning Your Entries
Use lower timeframe charts to refine your entry and exit points. Look for specific time windows known as “ICT KILLZONES” for potential reversal points. This multi-timeframe approach ensures you’re aligning with institutional movements across different scales.
Action Step: Practice transitioning between timeframes smoothly, developing a workflow that allows you to quickly confirm higher timeframe analysis with lower timeframe precision.
7. Execute Proper Risk Management: Protecting Your Capital
Implement robust risk management techniques, including well-placed stop losses and appropriate position sizing. Remember, even with the power of IPDA analysis, no trade is ever a guaranteed winner.
Action Step: Establish a set of risk management rules that you follow religiously, regardless of how confident you feel about a particular setup.
8. Continuous Learning and Adaptation: Staying Ahead of the Curve
The forex market is ever-evolving, and so should your application of the IPDA strategy. Regularly review your trades, both winners and losers, to refine your understanding and application of IPDA principles.
Action Step: Set aside time each week or month to review your trading journal, identifying areas for improvement and adaptation in your IPDA trading approach.
Advanced IPDA Applications: Leveraging Futures Market Analysis
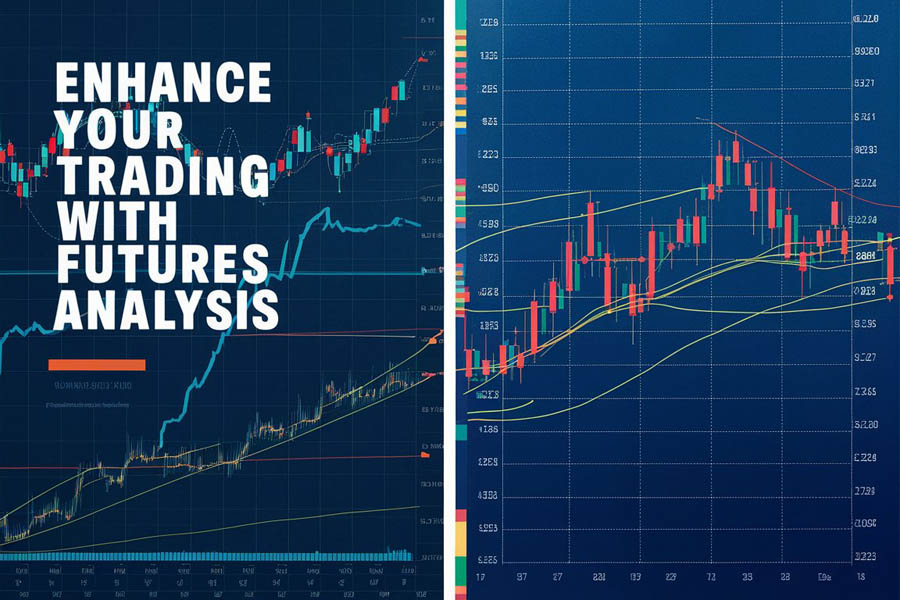
One of the most powerful applications of the IPDA strategy involves integrating futures market analysis into your forex trading approach. This advanced technique can significantly enhance your market understanding and trading decisions. Here’s why and how to incorporate futures market analysis into your IPDA strategy:
Why Futures Market Analysis is Crucial for IPDA Trading
- Defined Contracts: Futures contracts have specific volumes that can be calculated and analyzed, providing clearer insights into market dynamics.
- Volume Analysis: The ability to analyze volume in futures markets helps traders gain a better understanding of market sentiment and potential price movements.
- Market Maker Visibility: Futures markets can offer clearer indications of market maker activities, which is crucial for IPDA trading.
Key Aspects of Futures Market Analysis in IPDA Trading
- Quarterly Phase Changes: Examining the last three months of the futures market on the daily chart is crucial. It helps identify phase changes, which indicate which order blocks and liquidity pools are likely to be targeted.
- Currency-Specific Analysis: In the futures market for each currency, phase changes (trend changes) in the last 3 months of the daily chart reveal the market maker’s intentions for that currency.
- 20-40-60 Day Cycles: We typically see a phase change in futures every three months, which we use to optimize our analysis (referring to the 20, 40, and 60-day periods).
Implementing Futures Analysis in IPDA Trading
- Mark Phase Changes: When you observe a phase change on the futures chart, mark it from the beginning of that month. This is crucial because trading algorithms collect information based on the first of each month.
- Anticipate Direction Changes: By analyzing the 20-40-60 day shift from the beginning of each month towards the future, we can potentially anticipate the limits of directional changes.
- Prioritize Higher Timeframes: When using 20-40-60 levels, remember that higher timeframe levels (like weekly) take precedence.
Advanced Technique: Detecting Phase Changes in Futures
To detect approximately 3-month phase changes in the futures market:
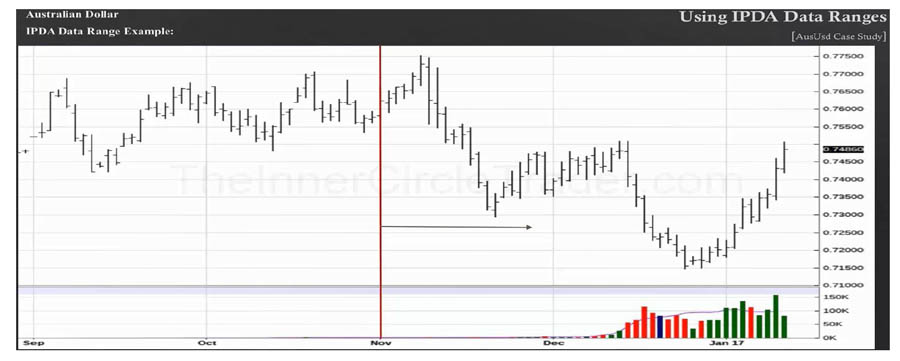
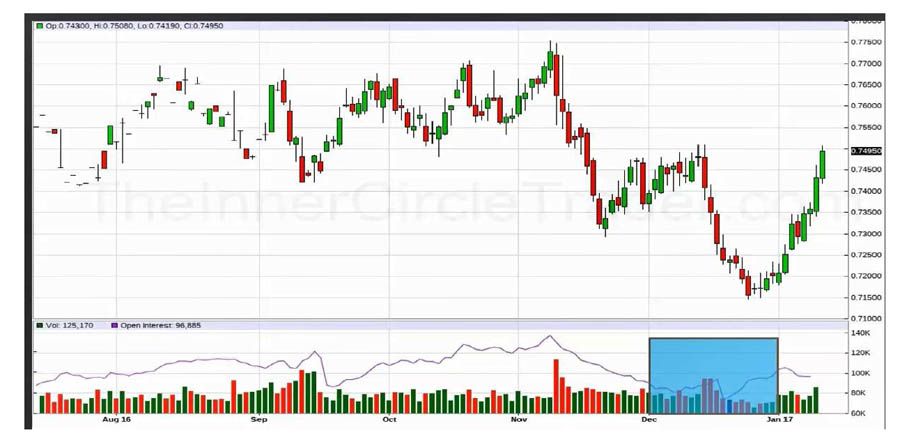
- Monitor Important Levels: On higher daily timeframes, if we expect a movement change and the price reaches a significant level, we should keep an eye on the Open Interest line.
- Open Interest Changes: Open Interest represents the total number of open long and short positions, visible below the futures chart on websites like Barchart. If Open Interest suddenly changes by more than 15%, it’s a sign of potential trend changes.
- Understand Bank Behavior: This sudden change indicates that banks or liquidity providers in the futures market are not inclined to hold open positions, as the price intends to change direction, and maintaining positions in the opposite direction isn’t logical.
Key Insight
The market in the daily timeframe seeks highs and lows to collect liquidity, and it does this by changing phase every three or four months.
Read more: Mastering ICT Premium and Discount Zones
Why IPDA is Crucial
We use IPDA because nothing in the market is random. All movements are programmed and are certain to occur through algorithms. If IPDA has consumed all the liquidity of the past 60 days, it quickly moves towards the ceilings or floors after 60 days to fill its orders.
By incorporating futures market analysis into your IPDA trading strategy, you can gain deeper insights into institutional behavior and potential market movements. This advanced approach can help you align your trades more closely with the actions of major market players, potentially improving your trading outcomes.
Why OpoFinance is the Ideal Broker for IPDA Strategy

Trusted and Secure: OpoFinance is ASIC-regulated, providing a secure and trustworthy trading environment, essential for implementing advanced strategies like IPDA.
Advanced Trading Platforms: Whether you use MetaTrader 4, MetaTrader 5, or OpoFinance’s proprietary platform, you’ll have access to cutting-edge tools and real-time data crucial for executing the IPDA strategy.
Fast Execution and Tight Spreads: Precision and timing are key in IPDA trading. OpoFinance offers tight spreads and fast execution, ensuring your trades hit the market exactly when you need them to.
Comprehensive Support: With 24/5 customer support and a wealth of educational resources, OpoFinance is committed to helping you master the IPDA strategy and excel in your trading journey.
Flexible and Convenient: OpoFinance offers flexible account options, competitive leverage, and seamless deposits and withdrawals, making it easy to trade with confidence.
Take Your Trading to the Next Level with OpoFinance
Join OpoFinance today and experience a broker that’s as committed to your success as you are.
Read more: Mastering ICT Liquidity Pool Trading
Conclusion: Embracing the IPDA Edge in Forex Trading
The IPDA trading strategy represents a paradigm shift in forex trading, offering a window into the world of institutional order flow and market structure. By mastering the Interbank Price Delivery Algorithm and understanding the four key market conditions—Expansion, Retracement, Reversal, and Consolidation—traders can gain a significant edge in predicting and capitalizing on market movements.

Remember, success in forex trading is not achieved overnight. It requires dedication, continuous learning, and the ability to adapt to ever-changing market conditions. The IPDA strategy provides a robust framework, but it’s your application and refinement of these principles that will ultimately determine your success.
As you embark on your IPDA trading journey, stay curious, remain disciplined, and never stop refining your approach. With perseverance and the powerful insights provided by the IPDA strategy, you’re well-equipped to navigate the complex world of forex trading and potentially achieve the consistent profitability you’ve been striving for.
How does the IPDA trading strategy differ from traditional technical analysis?
incorporates elements of technical analysis, such as support and resistance levels, its primary focus is on decoding institutional order flow and market structure.
Key differences include:
Focus on institutional behavior rather than retail trader patterns
Emphasis on order blocks and fair value gaps
Integration of multi-timeframe analysis with a specific focus on 20, 40, and 60-day cycles
Consideration of market maker manipulation tactics
Incorporation of futures market analysis for deeper insights
This approach provides a deeper insight into potential market direction compared to relying solely on conventional chart patterns or indicators. By aligning with institutional movements, IPDA traders aim to position themselves on the right side of major market moves.
Can the IPDA trading strategy be applied to markets other than forex?
While the IPDA trading strategy was primarily developed for the forex market, its core principles can be adapted to other financial markets, including stocks, commodities, and even cryptocurrencies. The key is understanding that the fundamental concepts of order flow, liquidity, and institutional behavior apply across various markets.
However, traders should be aware that each market has its unique characteristics:
Stock markets may require additional consideration of company-specific news and earnings reports
Commodity markets might be more influenced by supply and demand factors
Cryptocurrency markets may have different liquidity dynamics and institutional participation levels
Adapting the IPDA strategy to these markets requires a deep understanding of both the strategy itself and the specific market dynamics. Traders looking to apply IPDA principles to other markets should start with thorough backtesting and paper trading before committing real capital.
How long does it typically take to become proficient in using the IPDA trading strategy?
ypically requires several months to a year of dedicated study and practice to grasp the core concepts and apply them effectively in live trading situations.
The learning curve involves several stages:
Understanding market structure and the four key conditions (1-2 months)
Recognizing order blocks, fair value gaps, and liquidity pools (2-3 months)
Developing the ability to read and interpret institutional order flow (3-4 months)
Integrating multi-timeframe analysis and advanced IPDA techniques (4-6 months)
Incorporating futures market analysis into the IPDA framework (2-3 months)
Refining and personalizing the strategy through live trading experience (ongoing)
Traders should expect to invest significant time in:
Studying IPDA educational materials
Backtesting the strategy on historical data
Practicing on demo accounts to hone skills without financial risk
Gradually implementing the strategy in live trading with small positions
Continuously reviewing and refining their approach
It’s crucial to understand that becoming proficient in IPDA trading is not just about learning a set of rules, but developing a deep understanding of market dynamics and institutional behavior. This requires patience, persistence, and a commitment to continuous


