

In the complex world of financial trading, a trader’s success often hinges on their ability to forecast market movements and respond to them effectively. One of the most potent tools available to traders is the ICT Weekly Range Profiles—a series of conceptual frameworks that provide insights into potential market behavior throughout a trading week. By mastering ICT Weekly Range Profiles, traders working with a broker for forex can gain a more profound understanding of typical price movement patterns, which can significantly enhance their trading strategies.
ICT Weekly Range Profiles offer a structured method for interpreting market data, allowing traders to navigate the intricacies of financial markets with increased confidence and precision. While these profiles do not provide foolproof predictions, they are invaluable for identifying market tendencies, enabling traders to make informed decisions and seize potential opportunities.
This comprehensive guide explores the various ICT Weekly Range Profiles in detail, offering clear explanations and practical examples to help you incorporate these concepts into your trading strategy. Whether you’re trying to identify the Classic Tuesday Low of the Week or preparing for a Seek and Destroy Bullish Friday, this guide equips you with the knowledge and strategies to anticipate and respond to diverse market conditions. By mastering these profiles, you’ll be better prepared to handle market fluctuations, boosting your trading confidence and success.
Understanding ICT Weekly Range Profiles
ICT Weekly Range Profiles are conceptual frameworks that assist traders in predicting market behavior throughout the trading week. Each profile represents a distinct pattern of price movement, providing valuable insights that can help forecast potential market trends. While these profiles do not guarantee specific outcomes, they offer a structured approach to interpreting market data, making them essential tools for both novice and experienced traders.

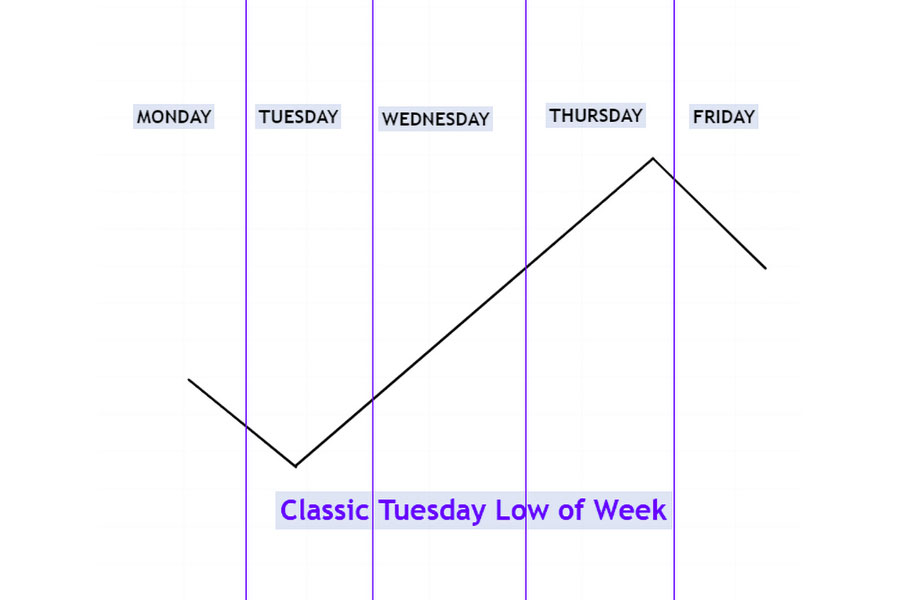
Profile 1: Classic Tuesday Low of the Week (Bullish Scenario)
In a bullish market, prices often show manipulation on Monday, hovering just above a higher timeframe discount array. By Tuesday, the price typically drops into this discount array, establishing what is known as the “low of the week.” This pattern is vital for traders seeking to identify potential dips that present profitable buying opportunities.
Read More: Mastering ICT Session Profiles in Forex Trading
How to Predict:
To predict this profile effectively, traders must be well-acquainted with the higher timeframe discount array. If the market does not drop into this array on Monday, it is likely that Tuesday will witness a downward movement, marking the weekly low during the London or New York session. Traders can take advantage of this by positioning themselves for a potential upward trend following the establishment of the low.
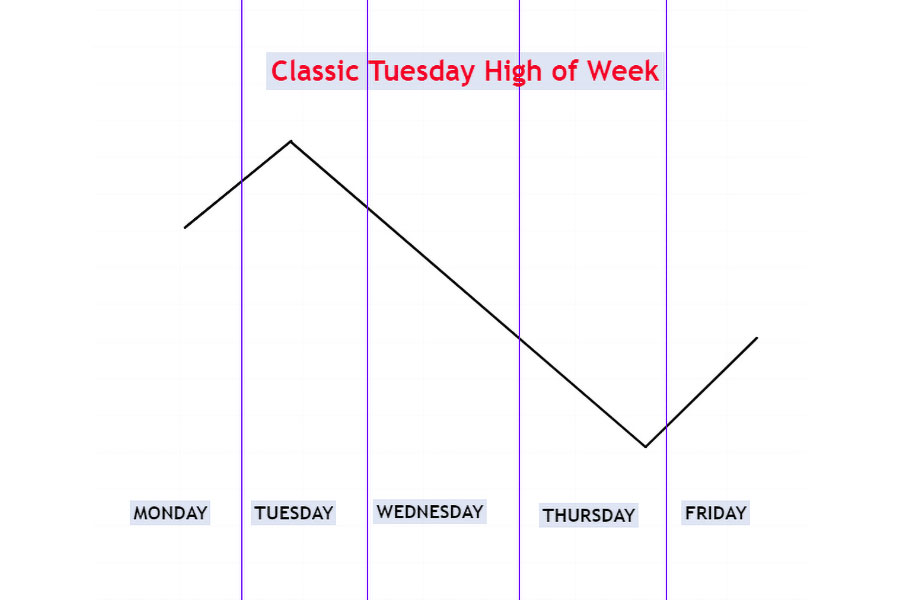
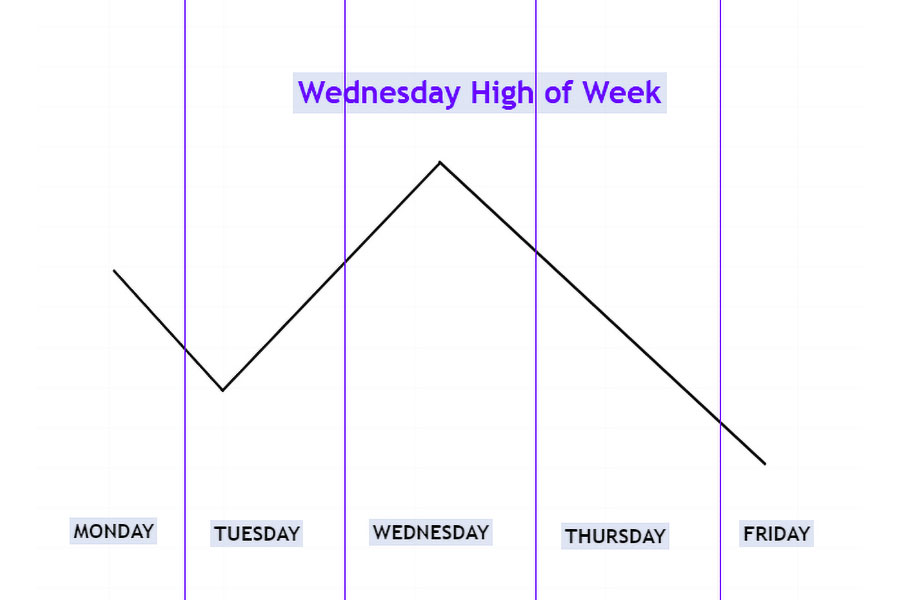
Profile 2: Classic Tuesday High of the Week (Bearish Scenario)
Contrary to the bullish scenario, a bearish market may exhibit manipulation on Monday, with prices hovering below a higher timeframe premium array. By Tuesday, the price often rises into this premium array, forming the “high of the week.” This pattern signals potential selling opportunities for traders aiming to capitalize on a downward market movement.
How to Predict:
Understanding the higher timeframe premium array is critical for predicting this profile. If the market does not rise into the premium array on Monday, it is highly probable that Tuesday will see an upward surge, marking the weekly high during the London or New York session. Traders can use this information to initiate short positions, anticipating a price decline after the high is established.
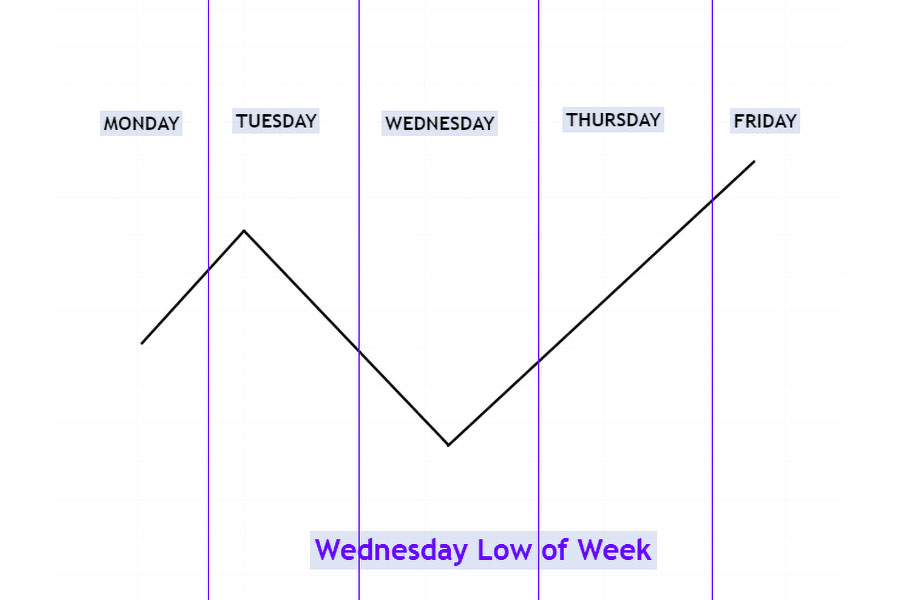
Profile 3: Midweek Low Formation (Bullish Scenario)
In a bullish market, prices may show manipulation on both Monday and Tuesday, hovering above a higher timeframe discount array. By Wednesday, the price often dips into this discount array, establishing the low of the week.
How to Predict:
Traders should closely monitor the higher timeframe discount array to predict this profile accurately. If the market fails to drop into the discount array on Monday and Tuesday, it is likely that Wednesday will see a downward movement, marking the weekly low during the London or New York session. This scenario offers traders a strategic entry point for long positions, anticipating a bullish movement as the week progresses.
Profile 4: Midweek High Formation (Bearish Scenario)
In a bearish market, prices may show manipulation on Monday and Tuesday, hovering below a higher timeframe premium array. By Wednesday, the price often rises into this premium array, forming the weekly high.
How to Predict:
To anticipate this profile, traders need to have a thorough understanding of the higher timeframe premium array. If the market does not rise into the premium array on Monday and Tuesday, Wednesday is likely to see an upward movement, marking the weekly high during the London or New York session. This pattern provides an opportunity for traders to enter short positions, expecting a price drop after the high is formed.
Read More: Unlock the Power of ICT Fibonacci Retracement
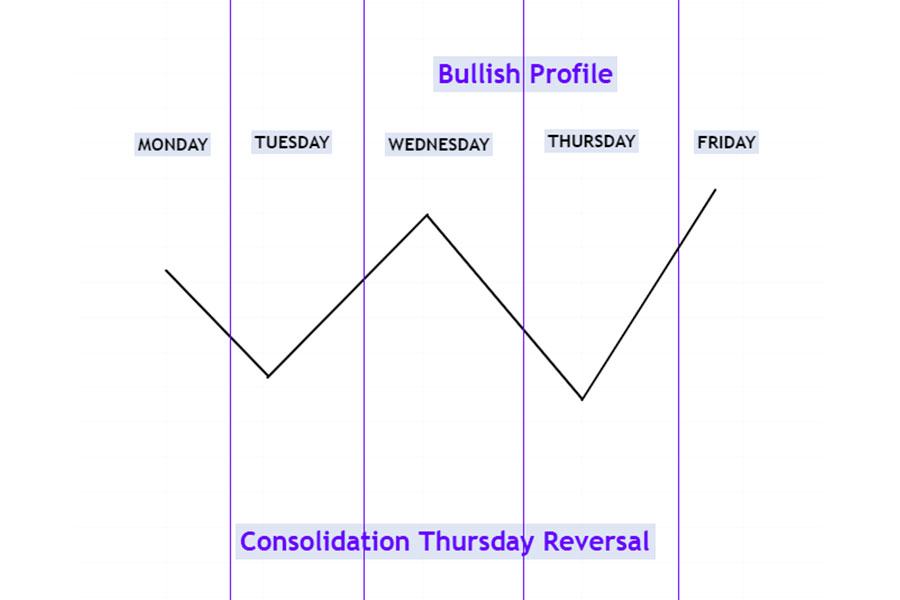
Profile 5: Thursday Bullish Reversal After Consolidation
When the market is bullish, prices may consolidate from Monday through Wednesday, running the intra-week low before rejecting it and reversing on Thursday. This scenario is often characterized by a sharp price recovery, presenting a prime opportunity for traders to enter long positions.
How to Predict:
Traders should be familiar with the higher timeframe discount array to predict this profile effectively. If the price fails to drop into the higher timeframe discount array, Thursday may witness a downward movement driven by market news or interest rate releases, typically around 02:00 PM (New York local time). Recognizing this pattern allows traders to position themselves advantageously, capitalizing on the anticipated upward movement.
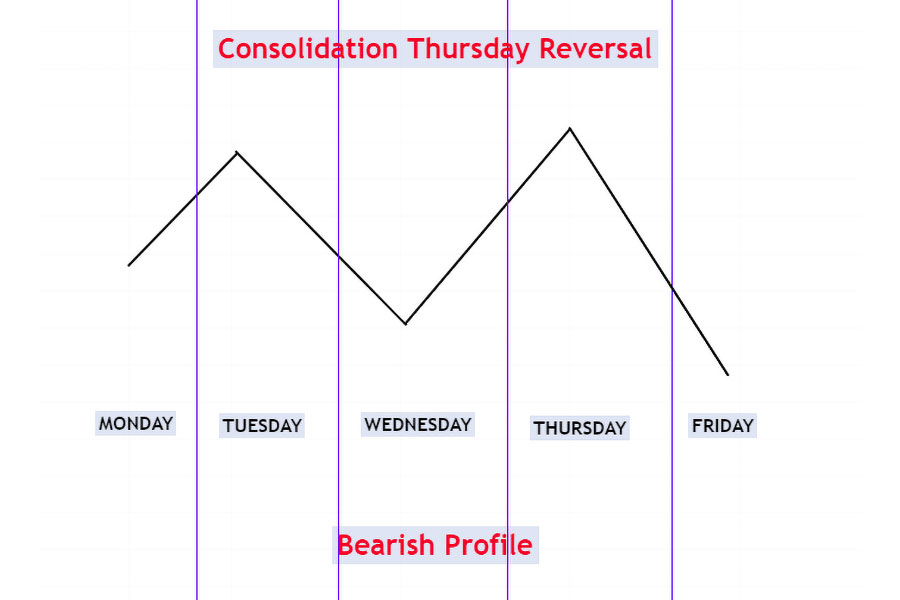
Profile 6: Thursday Bearish Reversal After Consolidation
In a bearish market, prices may consolidate from Monday through Wednesday, running the intra-week high before rejecting it and reversing on Thursday. This scenario is often characterized by a sharp price decline, offering a prime opportunity for traders to enter short positions.
How to Predict:
Understanding the higher timeframe premium array is essential for predicting this profile. If the price fails to rise into the higher timeframe premium array, Thursday may see an upward movement driven by market news or interest rate releases, typically around 02:00 PM (New York local time). Traders can use this information to anticipate a downward trend, positioning themselves to benefit from the anticipated price decline.
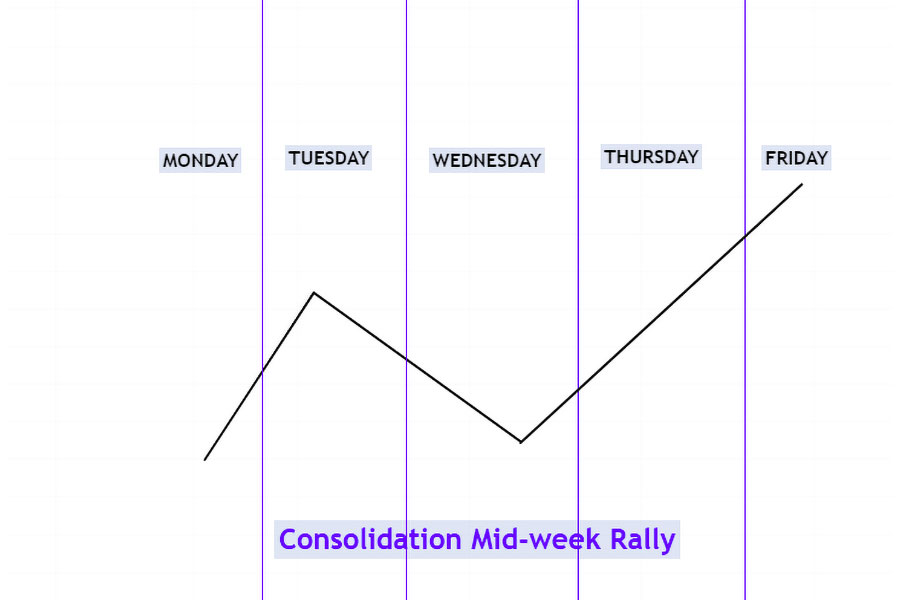
Profile 7: Midweek Rally Extension (Bullish Scenario)
In a bullish market, prices may consolidate from Monday through Wednesday, running into the intra-week high and expanding higher into Friday. This pattern indicates a continuation of the bullish trend, offering traders a clear opportunity to capitalize on the upward movement.
How to Predict:
Traders should observe whether the price has rallied from a discount array and paused without any bearish reversal signals. This suggests that the price is likely to expand higher toward the premium array. Recognizing this pattern enables traders to enter long positions, taking advantage of the anticipated rally as the week draws to a close.
Profile 8: Midweek Decline Extension (Bearish Scenario)
In a bearish market, prices may consolidate from Monday through Wednesday, running into the intra-week low and expanding lower into Friday. This pattern signals a continuation of the bearish trend, providing traders with an opportunity to capitalize on the downward movement.
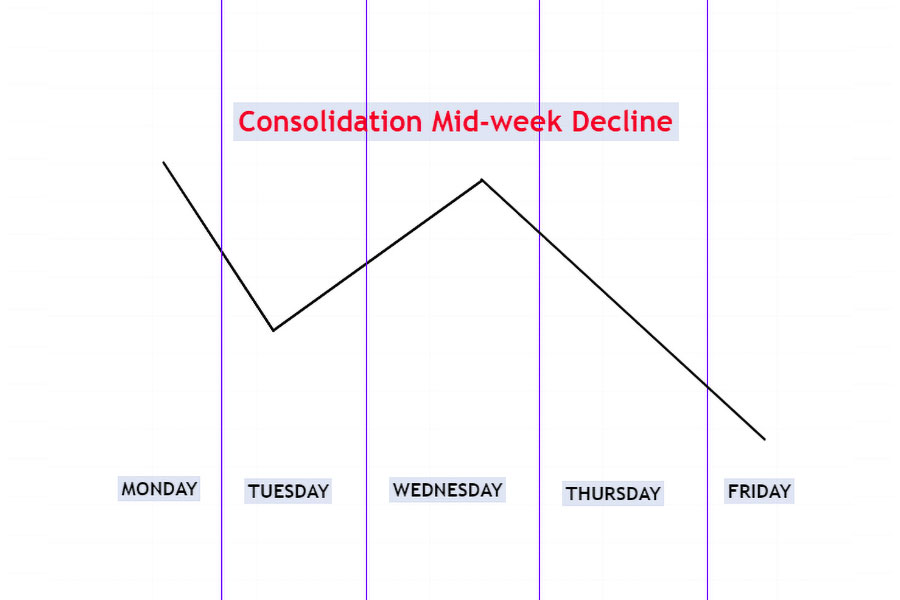
How to Predict:
If the price has declined from a premium array and paused without any bullish reversal signals, it indicates that the price is likely to expand lower toward the discount array. Traders can use this information to enter short positions, anticipating a decline as the week comes to an end.
Profile 9: Unpredictable Bullish Friday (Low Probability Scenario)
When the market consolidates from Monday through Thursday, running shallow stops under and above the intra-week high, it may then run the intra-week high and expand higher on Friday. This pattern is often unpredictable, making it a lower-probability scenario for traders.
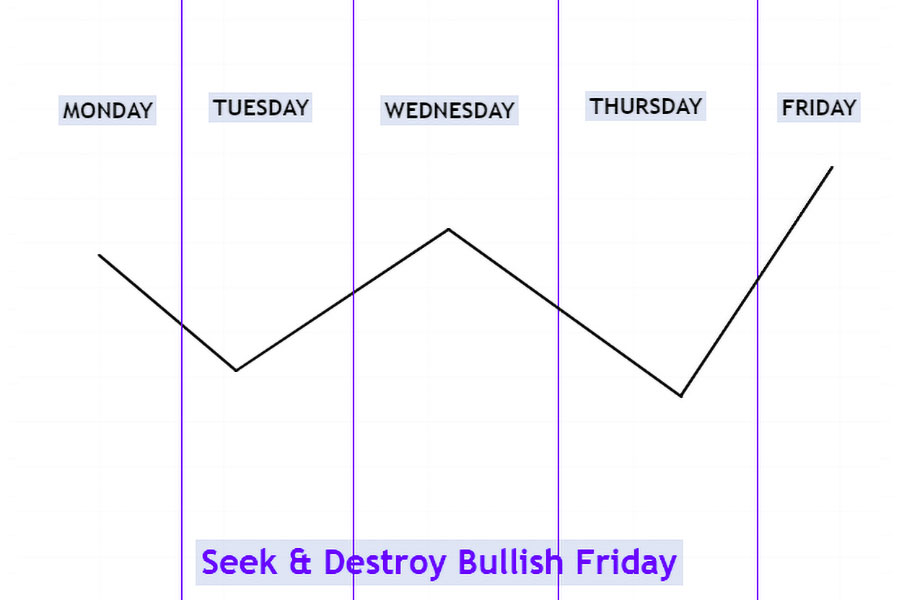
How to Predict:
This profile often occurs when the market is awaiting significant announcements, such as interest rate decisions or Non-Farm Payroll reports, especially during the summer months of July and August. Due to the unpredictability of this pattern, traders are generally advised to avoid taking positions under these conditions.
Read More: Mastering ICT Weekly Profiles
Profile 10: Unpredictable Bearish Friday (Low Probability Scenario)
Similarly, when the market consolidates from Monday through Thursday, running shallow stops under and above the intra-week high, it may then run the intra-week low and expand lower on Friday. Like its bullish counterpart, this pattern is highly unpredictable, making it a lower-probability scenario for traders.
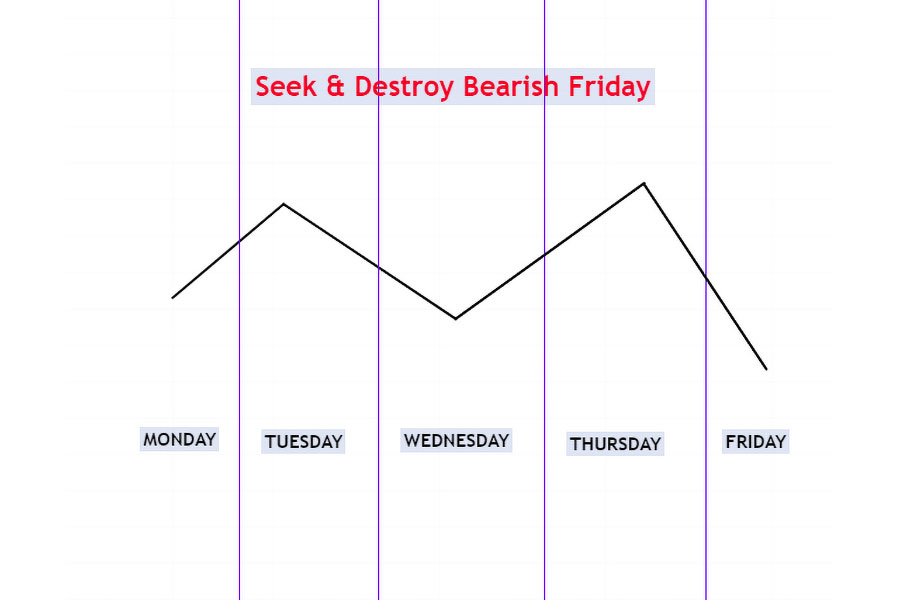
How to Predict:
This profile also occurs around significant announcements, such as interest rate decisions or Non-Farm Payroll reports. Given the unpredictable nature of this pattern, traders are generally advised to avoid trading under these conditions.
Profile 11: Midweek Bullish Reversal
When the market is bullish and consolidates from Monday through Tuesday, it may drive lower into a higher timeframe discount array on Wednesday, induce sell stops, and then strongly reverse. This reversal often marks a significant turning point in the market, providing traders with a prime opportunity to enter long positions.
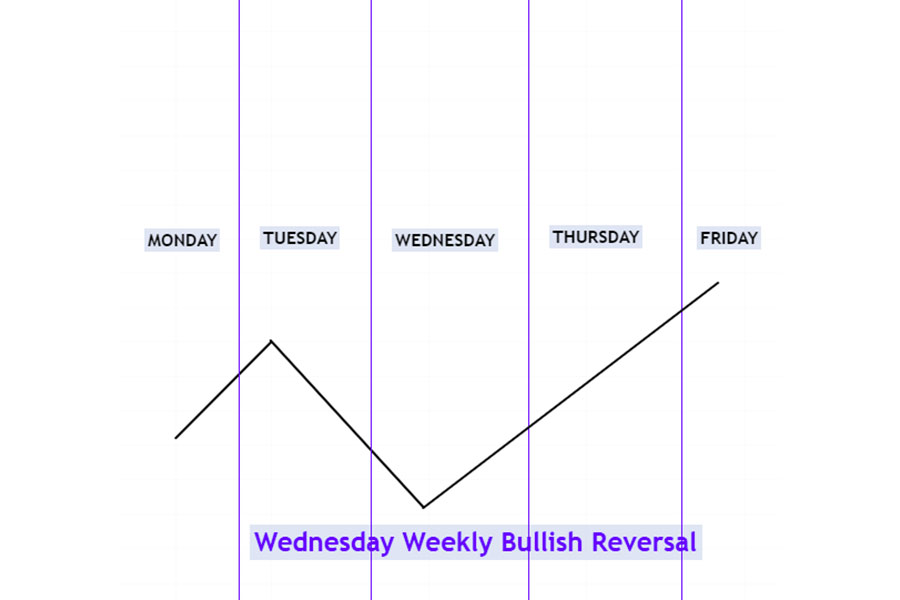
How to Predict:
This profile is more likely to occur when the market is trading at a long-term or intermediate-term low. Traders should be aware of institutional buying paired with pending sell-side liquidity (sell stops raid) to anticipate this reversal. Recognizing this pattern allows traders to capitalize on the anticipated upward movement, positioning themselves for potential gains as the market reverses.
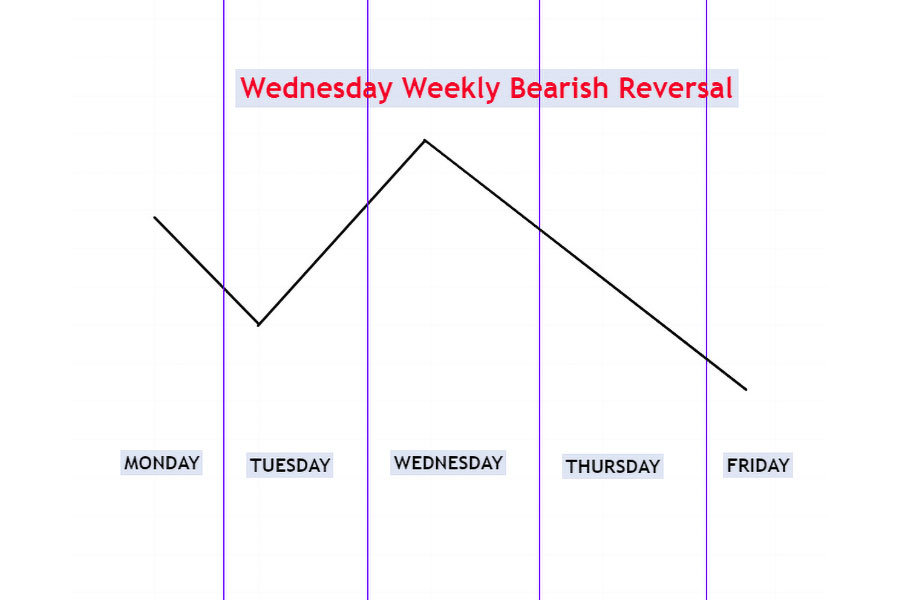
Profile 12: Midweek Bearish Reversal
In a bearish market, prices may consolidate from Monday through Tuesday, drive higher into a higher timeframe premium array on Wednesday, induce buy stops, and then strongly reverse. This reversal often signals the start of a significant downward trend, providing traders with an opportunity to enter short positions.
How to Predict:
This profile is more likely to occur when the market is trading at a long-term or intermediate-term high. Traders should be aware of institutional selling paired with pending buy-side liquidity (buy stops raid) to anticipate this reversal. By recognizing this pattern, traders can position themselves to profit from the anticipated decline in price.
Applying ICT Weekly Range Profiles in Your Trading Strategy

Understanding ICT Weekly Range Profiles is only the first step. To effectively incorporate these profiles into your trading strategy, it is essential to align them with the broader market context, use them in conjunction with other technical analysis tools, and maintain a disciplined approach to risk management. Here are some practical tips to help you apply these profiles in your trading:
Align with Market Context
Before applying any ICT Weekly Range Profile, it is crucial to assess the overall market context. Consider factors such as long-term trends, key support and resistance levels, and economic news that may influence market behavior. By aligning the profile with the broader market context, you can increase the accuracy of your predictions and improve your trading outcomes.
Combine with Other Technical Analysis Tools
ICT Weekly Range Profiles are most effective when used in conjunction with other technical analysis tools, such as moving averages, Fibonacci retracements, and volume indicators. These tools can provide additional confirmation of potential market movements, helping you to make more informed trading decisions.
Practice Disciplined Risk Management
Even with a solid understanding of ICT Weekly Range Profiles, trading always involves risk. To protect your capital, it is essential to practice disciplined risk management. This includes setting stop-loss orders, managing your position sizes, and avoiding over-leveraging. By maintaining a disciplined approach to risk management, you can minimize potential losses and increase your chances of long-term trading success.
Continuously Refine Your Strategy
The financial markets are constantly evolving, and so should your trading strategy. Continuously refine your approach by reviewing your trading results, staying updated on market developments, and learning from both your successes and mistakes. By adopting a mindset of continuous improvement, you can enhance your trading skills and adapt to changing market conditions.
Elevate Your Trading with OpoFinance
Unlock Your Trading Potential with OpoFinance
Are you ready to take your trading to the next level? OpoFinance, a trusted and regulated forex broker, offers the tools, resources, and support you need to succeed in today’s fast-paced markets. Whether you’re trading forex, commodities, indices, or cryptocurrencies, OpoFinance provides a secure and transparent environment to help you achieve your trading goals.

Why Choose OpoFinance?
- ASIC-Regulated: Trade with confidence knowing your investments are protected in a fully regulated environment.
- Advanced Trading Platforms: Access cutting-edge platforms designed for both novice and experienced traders, with real-time data and powerful analytics.
- Competitive Spreads: Maximize your profits with some of the most competitive spreads in the market.
- Comprehensive Education: Enhance your trading knowledge with our extensive educational resources, market analysis, and webinars.
- 24/7 Customer Support: Our dedicated support team is here to assist you at any time, ensuring you have the help you need, when you need it.
Join OpoFinance Today
Experience the difference with OpoFinance. Open an account today and start trading with a broker that puts your success first. Visit OpoFinance.com and take your trading strategy to new heights.
Conclusion: Mastering ICT Weekly Range Profiles for Trading Success
ICT Weekly Range Profiles offer traders a structured approach to anticipating market movements, enabling more informed and strategic trading decisions. By understanding and applying these profiles within your trading strategy, you can align with market trends, effectively manage risk, and capitalize on key market opportunities.
Whether you’re identifying the Classic Tuesday Low of the Week or preparing for a Wednesday Bullish Reversal, ICT Weekly Range Profiles provide valuable insights that can enhance your trading performance. However, it’s crucial to remember that these profiles should be used in conjunction with other analysis tools and a disciplined risk management approach.
By staying informed, continuously educating yourself, and utilizing the support of a trusted, regulated forex broker like OpoFinance, you can refine your strategy and increase your chances of success in the dynamic world of trading. Mastering ICT Weekly Range Profiles is not just about predicting market moves—it’s about positioning yourself for consistent, long-term trading success.
Can ICT Weekly Range Profiles be used in combination with other trading strategies?
Yes, ICT Weekly Range Profiles can be effectively combined with other trading strategies to enhance your overall approach. For instance, you can integrate these profiles with trend-following strategies, support and resistance levels, or even algorithmic trading systems. By combining these tools, you can gain a more comprehensive view of the market, allowing for more accurate predictions and better trading decisions.
How can I avoid false signals when using ICT Weekly Range Profiles?
To minimize the risk of false signals, it’s important to use ICT Weekly Range Profiles alongside other technical analysis tools, such as moving averages, volume indicators, or trendlines. Additionally, paying attention to the broader market context, including economic news and market sentiment, can help you filter out noise and focus on the most reliable signals. Always practice disciplined risk management to protect your capital from unexpected market movements.
Is it possible to use ICT Weekly Range Profiles in shorter timeframes, such as day trading?
While ICT Weekly Range Profiles are primarily designed for weekly market analysis, they can be adapted for shorter timeframes like day trading. However, it’s crucial to adjust your expectations and strategy accordingly. For day traders, understanding the intraday dynamics and combining the profiles with shorter-term indicators, such as 5-minute or 15-minute charts, can provide valuable insights. Keep in mind that the effectiveness of these profiles may vary depending on the volatility and liquidity of the market within a shorter timeframe.


