

Are you chasing fleeting opportunities on the 5-minute chart, feeling like you’re always a step behind? The key to unlocking consistent profitability in this fast-paced environment often lies in the precision of your technical indicators. Specifically, mastering the Stochastic Oscillator with the right settings can be a game-changer. For traders navigating the rapid movements of a 5-minute chart, the best stochastic settings for a 5-minute chart typically involve a quicker response time, often found in configurations like 9, 3, 3 or even 5, 3, 3. This article provides an in-depth exploration of optimizing your stochastic settings for 5-minute trading, offering strategies to potentially enhance your trading outcomes with your chosen forex trading broker.
This comprehensive guide is designed to provide you with the knowledge necessary to effectively utilize the Stochastic Oscillator on the 5-minute timeframe. We will explore the fundamental aspects of this indicator, discuss why standard settings might not be ideal, and reveal optimized configurations tailored for high-frequency trading. Prepare to discover actionable tips, address common challenges, and ultimately refine your approach to potentially capturing those crucial pips in the fast-paced world of short-term trading.
Introduction to Stochastic Oscillator

The Stochastic Oscillator is a cornerstone of technical analysis, providing insights into the momentum behind price movements. Understanding its core function is the first step towards optimizing it for the specific demands of a 5-minute chart. This section will define the Stochastic Oscillator and highlight why tailoring its settings is crucial for short-term trading success.
What is the Stochastic Oscillator?
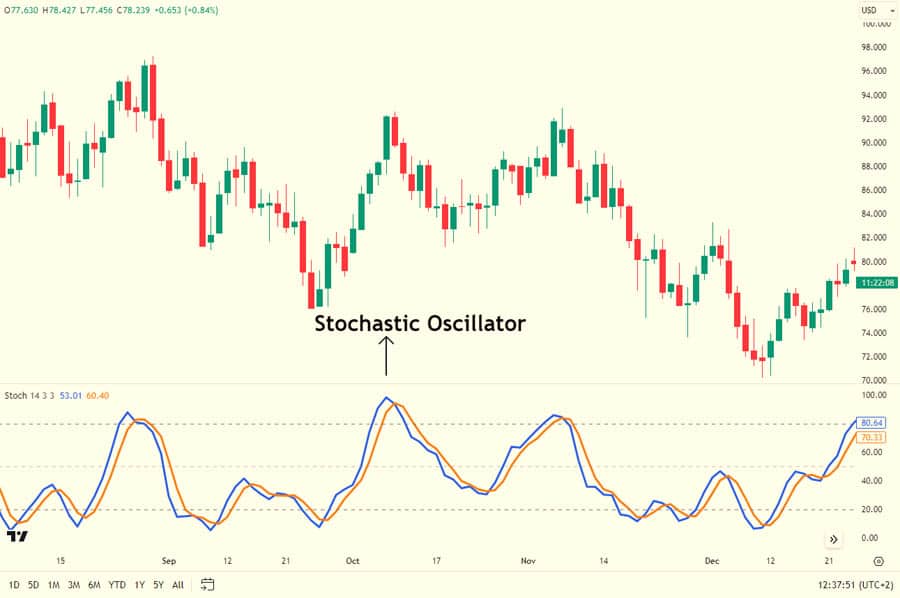
Imagine having a tool that helps you anticipate potential turning points in price action by gauging the strength behind recent movements. That’s the essence of the Stochastic Oscillator. Developed by George Lane, this momentum indicator compares a security’s closing price to its price range over a given period. The underlying principle is that in an upward trend, closing prices tend to gravitate towards the higher end of the recent range, while in a downtrend, they tend to close nearer the lower end. This characteristic makes it a valuable asset for identifying potential overbought and oversold conditions, signaling possible shifts in market direction.
Read More: 5-Minute Trading Strategy
Importance of Optimizing Stochastic Settings for 5-Minute Charts
The 5-minute chart is characterized by rapid price fluctuations and a high volume of trading activity. In this dynamic environment, using generic indicator settings can lead to missed opportunities and increased false signals. Optimizing your stochastic settings for 5 minute chart is crucial because it allows the indicator to react more sensitively to short-term price swings, potentially enabling you to capitalize on fleeting trading opportunities. Utilizing the best stochastic settings for a 5-minute chart can be a significant factor in improving the timing and accuracy of your entries and exits.
How Stochastic Oscillator Works
To effectively optimize the Stochastic Oscillator, it’s essential to understand the components that drive its signals. This section breaks down the %K and %D lines and explains the significance of the overbought and oversold levels in interpreting the indicator’s readings.
Explanation of %K and %D Lines
The Stochastic Oscillator is visually represented by two lines that fluctuate between 0 and 100:
- %K (The Fast Stochastic Line): This line is the more reactive of the two and reflects the raw calculation of the oscillator. It’s calculated using the formula: `%K = (Current Close – Lowest Low over N periods) / (Highest High over N periods – Lowest Low over N periods) * 100`. Here, ‘N’ represents the lookback period, determining the number of periods considered in the calculation.
- %D (The Slow Stochastic Line): This line is a smoothed version of the %K line, acting as a signal line. It’s calculated as the Simple Moving Average (SMA) of the %K line over a specified number of periods. The formula is: `%D = SMA of %K over M periods`, where ‘M’ is the smoothing period.
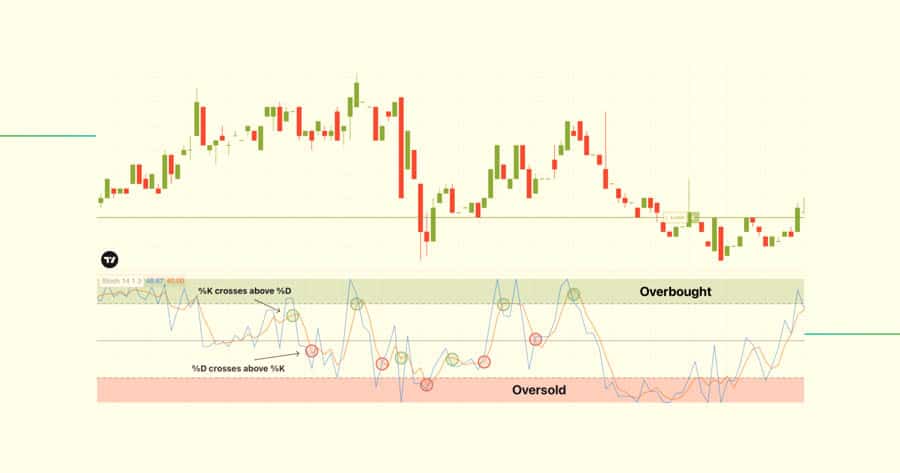
Traders often look for crossovers between these two lines to identify potential trading signals. A bullish signal is generated when the %K line crosses above the %D line, suggesting increasing upward momentum. Conversely, a bearish signal occurs when the %K line crosses below the %D line, indicating increasing downward momentum.
Overbought and Oversold Levels (20 and 80)
The Stochastic Oscillator’s range between 0 and 100 provides crucial context for interpreting its signals. Key levels to monitor are:
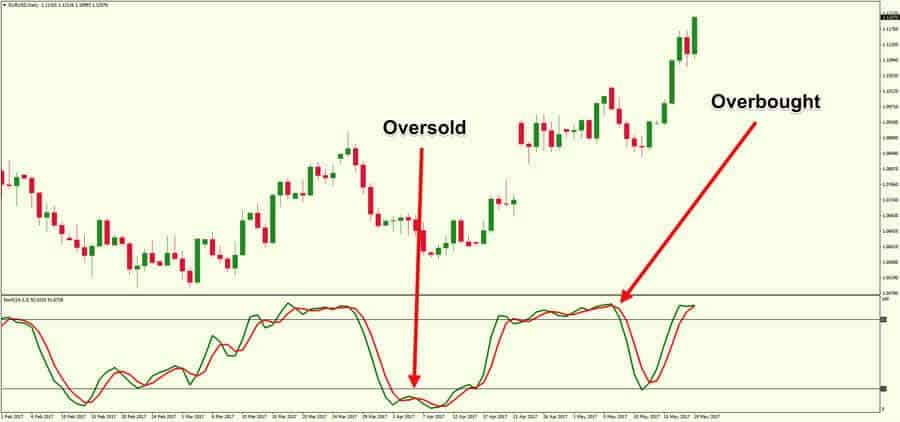
- Overbought Level (Typically 80): When the oscillator’s lines rise above 80, it suggests that the asset may be overbought, indicating a potential for a price reversal to the downside. However, it’s important to note that in strong uptrends, the price can remain in overbought territory for extended periods.
- Oversold Level (Typically 20): Conversely, when the oscillator’s lines fall below 20, it indicates that the asset may be oversold, suggesting a potential for a price reversal to the upside. Similar to overbought conditions, the price can stay in oversold territory during strong downtrends.
These levels serve as potential warning signals, highlighting areas where price reversals might occur. However, it’s crucial to use these levels in conjunction with other forms of analysis, such as price action and other technical indicators, to confirm potential trading opportunities.
Standard Stochastic Settings
Understanding the default settings of the Stochastic Oscillator provides a baseline for appreciating why adjustments are often necessary for specific trading scenarios like 5-minute charts. This section outlines the standard settings and explains their limitations in the context of high-frequency trading.
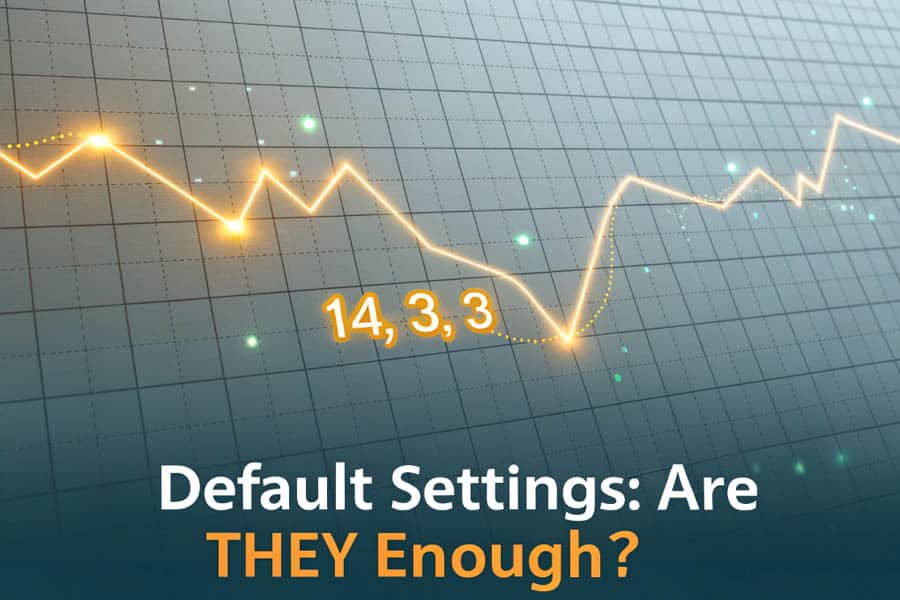
Default Settings (14, 3, 3)
The most commonly used default setting for the Stochastic Oscillator is (14, 3, 3). This configuration signifies:
- 14: The %K line calculation considers the closing price relative to the high and low prices over the preceding 14 periods. This lookback period influences the sensitivity of the %K line to recent price fluctuations.
- 3: The %D line is calculated as a 3-period Simple Moving Average of the %K line. This smoothing helps to filter out some of the noise and provides a more stable signal line.
- 3: Some trading platforms offer an additional smoothing factor for the %K line itself, often set to 3. This further smooths the %K line before the %D line is calculated.
These default settings are generally considered a good starting point for identifying medium-term trends and are often effective on higher timeframes, such as the daily or 4-hour charts, where price movements are less erratic.
Why Default Settings May Not Work for 5-Minute Charts
The inherent characteristics of the 5-minute chart present significant challenges for the standard stochastic settings. The rapid and often volatile price movements on this timeframe can lead to several drawbacks when using the default (14, 3, 3) configuration:
- Lagging Signals: The 14-period lookback can be too slow to effectively capture the quick momentum shifts that are typical of 5-minute trading. By the time a signal is generated, the price movement may have already occurred, causing you to miss potential entry or exit points.
- Increased False Signals: The sensitivity of the default settings to short-term price fluctuations can result in a higher number of false signals, leading to whipsaws and potential losses. You might observe frequent crossovers that do not translate into sustained price movements, creating confusion and uncertainty.
- Missed Opportunities: The slower reaction time of the default settings can cause you to miss out on profitable scalping opportunities that arise and disappear quickly within the 5-minute timeframe. The delay in signal generation can prevent you from capitalizing on these short-lived price surges.
Therefore, to effectively leverage the Stochastic Oscillator on a 5-minute chart, adjustments to the standard settings are often necessary to align the indicator’s responsiveness with the speed of price action.
Read More: Stochastic Oscillator in Forex
Best Stochastic Settings for 5-Minute Charts
To effectively trade on the 5-minute chart, adjusting the Stochastic Oscillator settings is crucial. This section provides recommended settings tailored for high-frequency trading and discusses how to adapt these settings based on market volatility and prevailing conditions.
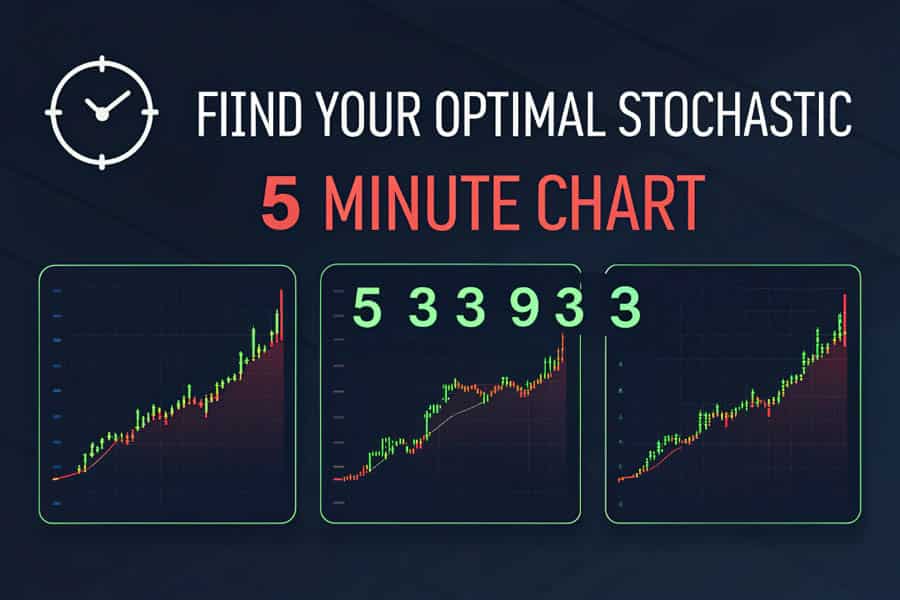
Recommended Settings for High-Frequency Trading (e.g., 5, 3, 3 or 9, 3, 3)
For the fast-paced environment of 5-minute chart trading, shorter lookback periods are generally more effective in capturing rapid price movements. Consider these settings as potential starting points for your optimization:
- 5, 3, 3: This more aggressive setting utilizes a 5-period lookback for the %K line, making it highly sensitive to recent price changes. This heightened sensitivity can be advantageous for capturing quick scalping opportunities, allowing you to react swiftly to short-term fluctuations. However, it’s important to be aware that this increased sensitivity also raises the potential for more false signals.
- 9, 3, 3: This configuration offers a slightly less aggressive approach compared to the 5, 3, 3 setting. The 9-period lookback for the %K line still allows for relatively quick reactions to price changes but can help to filter out some of the noise and insignificant fluctuations associated with the shorter 5-period setting. This can provide a better balance between responsiveness and signal reliability.
These settings enable the Stochastic Oscillator to react more promptly to the rapid price movements characteristic of the 5-minute chart, potentially providing more timely entry and exit signals for your trades. Remember that the “best” setting can vary depending on the specific asset being traded, the prevailing market conditions, and your individual trading style. Experimentation and backtesting are key to finding the optimal stochastic settings for 5 minute trading that suit your needs.
Adjusting Settings for Volatility and Market Conditions
The best stochastic settings for a 5-minute chart are not static; they should be adaptable to the ever-changing dynamics of the market. Adjusting your settings based on volatility and market conditions can significantly improve the indicator’s effectiveness:
- High Volatility: During periods of high market volatility, characterized by rapid and significant price swings, you might consider slightly increasing the %K period (e.g., from 5 to 7 or from 9 to 12). This adjustment can help to smooth out the indicator’s readings and reduce the number of false signals generated by erratic price movements. A longer lookback period makes the indicator less susceptible to short-term noise.
- Low Volatility: In contrast, during periods of low volatility, where price movements are generally smaller and less frequent, you might opt for shorter %K periods (e.g., 5 or 9). These shorter periods will make the indicator more sensitive to the smaller, more frequent price fluctuations, potentially allowing you to capture more trading opportunities.
- Trending Markets: In strongly trending markets, be cautious about relying solely on overbought and oversold signals generated by the Stochastic Oscillator. During strong uptrends or downtrends, the price can remain in overbought or oversold territory for extended periods without a reversal. In these conditions, focus more on %K and %D crossovers that align with the direction of the prevailing trend. For example, look for bullish crossovers when the overall trend is upward.
- Ranging Markets: The Stochastic Oscillator often performs best in ranging markets, where the price oscillates between defined support and resistance levels. In these conditions, overbought and oversold signals can be more reliable indicators of potential price reversals at the boundaries of the range.
Ultimately, the key to finding the most effective settings lies in continuous observation, experimentation, and thorough backtesting to determine what works best for your specific trading style and the instruments you are trading.
How to Optimize Stochastic Settings for 5-Minute Trading

Optimizing your stochastic settings for 5-minute trading involves a systematic approach that combines backtesting with the integration of other technical analysis tools. This section emphasizes the importance of these practices in refining your trading strategy.
Importance of Backtesting
Before implementing any new stochastic oscillator settings for 5 minute scalping in live trading, rigorous backtesting is an absolutely essential step. Backtesting involves applying your chosen settings to historical price data to simulate how they would have performed in the past. This process allows you to:
- Evaluate Profitability: Determine whether the chosen settings would have historically generated profitable trading signals. This provides a quantitative assessment of the settings’ potential.
- Identify Strengths and Weaknesses: Understand how the settings perform under different market conditions, such as periods of high and low volatility, or during trending and ranging markets. This helps you understand the limitations and advantages of your chosen settings.
- Optimize Parameters: Fine-tune the stochastic settings further based on the backtesting results. You might discover that slightly adjusting the lookback period or smoothing factor can improve performance.
- Build Confidence: Gain confidence in the effectiveness of your chosen settings before risking real capital in live trading. Seeing positive results in backtesting can provide psychological reassurance.
Utilize the backtesting tools available on your trading platform or consider using dedicated backtesting software for more in-depth analysis. Remember that while past performance is not a guarantee of future results, backtesting provides valuable insights into the potential effectiveness of your trading strategy and helps you make more informed decisions.
Combining Stochastic with Other Indicators (e.g., RSI, Moving Averages)
No single technical indicator is infallible, and relying solely on one indicator can lead to missed signals or false interpretations. To increase the reliability of your trading signals and create a more robust trading strategy, it’s prudent to combine the Stochastic Oscillator with other complementary technical indicators. Here are a few examples of effective combinations:
- Relative Strength Index (RSI): Similar to the Stochastic Oscillator, the RSI is a momentum indicator that helps identify overbought and oversold conditions. Using both indicators in conjunction can provide confirmation of potential trading signals. Look for confluence, where both indicators are signaling similar conditions (e.g., both showing overbought or oversold levels).
- Moving Averages: Moving averages are trend-following indicators that help to identify the overall direction of the market. Use stochastic signals in conjunction with the prevailing trend indicated by moving averages. For instance, look for bullish stochastic crossovers when the price is trading above a key moving average, suggesting a higher probability of the signal being valid.
- MACD (Moving Average Convergence Divergence): The MACD is another powerful momentum indicator that can help confirm the signals generated by the Stochastic Oscillator. Look for divergences between price action and the MACD or Stochastic Oscillator as potential early warning signs of trend reversals. For example, if the price is making new highs but the Stochastic Oscillator is making lower highs, it could signal bearish divergence.
By combining indicators, you can filter out some of the noise and false signals inherent in individual indicators, leading to higher-probability trading setups and potentially improved trading outcomes.
Read More: Best ema settings for 5 minute chart
Practical Tips for Using Stochastic on 5-Minute Charts
Effectively utilizing the Stochastic Oscillator on a 5-minute chart requires more than just understanding its settings. This section provides practical tips on avoiding false signals and implementing sound risk management strategies.
Avoiding False Signals
False signals are a common challenge when using the Stochastic Oscillator, particularly on shorter timeframes like the 5-minute chart, where price action can be more erratic. Here are some practical tips to help minimize the occurrence of false signals and improve the reliability of your trading decisions:
- Look for Divergence: Divergence occurs when the price action is moving in one direction, while the Stochastic Oscillator is moving in the opposite direction. For example, bearish divergence occurs when the price is making new highs, but the Stochastic Oscillator is failing to make new highs or is making lower highs. This can be a strong indication of a potential trend reversal, suggesting that the current price movement may be losing momentum. Similarly, bullish divergence occurs when the price is making new lows, but the Stochastic Oscillator is making higher lows.
- Wait for Confirmation: Avoid jumping into a trade solely based on a stochastic crossover. Instead, wait for price action to confirm the signal. This confirmation could come in the form of a specific candlestick pattern (e.g., an engulfing pattern or a pin bar) or a break of a significant support or resistance level. Confirmation from price action adds weight to the stochastic signal.
- Consider the Trend: Always be mindful of the prevailing trend when interpreting stochastic signals. Trading in the direction of the dominant trend generally increases the probability of success. Bullish stochastic signals are more reliable in an uptrend, while bearish signals are more reliable in a downtrend. Avoid taking counter-trend trades based solely on stochastic signals, as these have a higher risk of being false.
- Use Higher Timeframe Analysis: Before acting on a stochastic signal on the 5-minute chart, briefly check the stochastic oscillator on a higher timeframe (e.g., 15-minute or 30-minute chart). If the signal on the higher timeframe aligns with the signal on the 5-minute chart, it provides additional confirmation and increases the likelihood of the signal being valid. This multi-timeframe analysis can help filter out some of the noise inherent in shorter timeframes.
Setting Stop-Loss and Take-Profit Levels
Effective risk management is paramount for consistent profitability in the fast-paced world of 5-minute trading. Always utilize stop-loss orders to limit potential losses and take-profit orders to secure profits when your trading objectives are met:
- Stop-Loss Placement: Place your stop-loss order at a logical level that, if breached, would invalidate your trading setup. Common approaches include placing the stop-loss slightly below a recent swing low for long positions or slightly above a recent swing high for short positions. Alternatively, you can use support and resistance levels or volatility-based measures like the Average True Range (ATR) to determine appropriate stop-loss distances.
- Take-Profit Placement: Determine your take-profit target based on potential support and resistance levels, Fibonacci retracement levels, or a predetermined risk-reward ratio that aligns with your trading plan. Given the short-term nature of 5-minute trading, it’s crucial to be realistic with your profit targets. Aim for achievable gains rather than overly ambitious targets that are unlikely to be reached.
Remember that even with the best stochastic settings for 5 minute chart, losses are an inevitable part of trading. Proper risk management, including the consistent use of stop-loss and take-profit orders, is what distinguishes successful traders from those who are not.
Opofinance Services
Enhance your trading journey with Opofinance, a reputable ASIC-regulated broker dedicated to providing a secure and innovative trading environment for traders at all experience levels.
- ASIC Regulated: Trade with confidence knowing that Opofinance adheres to the stringent regulatory standards set by the Australian Securities and Investments Commission (ASIC), ensuring a high level of security and transparency.
- Officially Featured on MT5 Brokers List: Access the industry-leading MetaTrader 5 (MT5) platform, a testament to Opofinance’s commitment to offering cutting-edge trading technology and tools.
- Safe and Convenient Deposits and Withdrawals: Enjoy peace of mind with a variety of secure and efficient methods for funding your trading account and withdrawing your profits, making the financial aspects of trading seamless and reliable.
- Explore Social Trading: Connect with and learn from a community of experienced traders through Opofinance’s social trading features. Observe their trading strategies, engage in discussions about market trends, and potentially enhance your own trading skills by leveraging the collective knowledge of the community.

Ready to take your trading to the next level? Visit opofinance.com today to discover more and open your trading account.
Conclusion
Mastering the Stochastic Oscillator for 5-minute chart trading is a journey that requires a blend of understanding the indicator’s mechanics and the discipline to optimize its settings for the specific demands of this fast-paced timeframe. While default settings may be adequate for longer-term analysis, the dynamic nature of 5-minute trading necessitates a more tailored approach. By experimenting with shorter lookback periods, such as 9, 3, 3 or 5, 3, 3, and adapting your settings to the prevailing market volatility, you can significantly enhance the timeliness and accuracy of your trading signals. Remember that consistent backtesting and the strategic combination of the Stochastic Oscillator with other technical indicators are crucial steps in refining your trading strategy and achieving consistent results. Embrace a mindset of continuous learning and adaptation, and you will be well-prepared to navigate the exciting and potentially profitable world of 5-minute chart trading.
Key Takeaways
- Faster Settings for 5-Minute Charts: Shorter lookback periods (e.g., 5, 3, 3 or 9, 3, 3) are generally more effective than default settings for capturing the rapid momentum shifts on a 5-minute chart.
- Adapt to Volatility: Adjust your stochastic settings based on the current level of market volatility. Consider increasing the %K period during high volatility and decreasing it during low volatility to optimize the indicator’s responsiveness.
- Backtesting is Crucial: Always rigorously backtest your chosen stochastic settings on historical data before deploying them in live trading to assess their potential profitability and identify any weaknesses.
- Combine with Other Indicators: Enhance the reliability of your trading signals by using the Stochastic Oscillator in conjunction with other technical indicators, such as the RSI or moving averages, to confirm potential trading opportunities.
- Manage Risk Effectively: Implement robust risk management practices, including the consistent use of stop-loss and take-profit orders, to protect your capital and secure profits.
Can I use the Stochastic Oscillator alone for 5-minute trading?
While it’s technically possible to use the Stochastic Oscillator as a standalone tool for 5-minute trading, it is generally not recommended for optimal results. Relying solely on one indicator can lead to a higher number of false signals and missed opportunities. Combining the Stochastic Oscillator with other technical indicators, price action analysis, and an understanding of the overall market context will significantly improve the reliability of your trading signals and help you make more informed trading decisions.
How often should I adjust my stochastic settings for the 5-minute chart?
There is no fixed rule for how frequently you should adjust your stochastic settings for the 5-minute chart. However, it’s a good practice to review your settings periodically, especially when you observe a noticeable change in market volatility or a decline in the indicator’s performance. Regular backtesting of your current settings can help you determine if adjustments are necessary to maintain their effectiveness in the prevailing market conditions. Be prepared to adapt your settings as market dynamics evolve.
Are there specific currency pairs where certain stochastic settings work better on the 5-minute chart?
Yes, different currency pairs can exhibit varying levels of volatility, liquidity, and trading characteristics. Consequently, stochastic settings that perform well on one currency pair may not be optimal for another. It is advisable to conduct thorough backtesting of different stochastic settings for the specific currency pairs you intend to trade. This will help you identify the settings that are best suited to the unique characteristics of each pair and potentially improve your trading outcomes.


