

In forex trading, the precise timing of trade entries and exits is pivotal for success. It not only dictates potential profits or losses but also distinguishes experienced traders from beginners. Collaborating with a reliable forex broker and mastering the art of timing are essential in the volatile forex market, where efficient execution can make or break a strategy.

This article explores various strategies to enhance timing in forex trading. It starts with fundamental principles and progresses to advanced techniques like technical signals and integrating fundamental analysis. It also discusses the benefits of automated trading systems for accuracy, emphasizes the role of patience and discipline, and stresses the importance of continually adapting strategies to thrive in this competitive environment. Traders will gain invaluable insights to optimize their entry timing, refining their overall approach and striving for success in forex trading.
Basics of Forex Trading Timeliness
Understanding Market Cycles
In forex trading, understanding market cycles is crucial for timing entries and exits effectively. These cycles, spanning months to years, are shaped by economic factors, trader behavior, and price fluctuations around an equilibrium. Divided into four phases—Accumulation, Markup, Distribution, and Markdown—traders use these cycles to guide strategic decisions.

During Accumulation, traders spot buying opportunities in a bearish market, setting the stage for profitable trades. In the Markup phase, prices climb, signaling a bullish trend that attracts traders. Recognizing the shift from Markup to Distribution helps traders anticipate market peaks and prepare for potential sell-offs. In the Markdown phase, prices fall, presenting risks and opportunities for traders who anticipate the cycle’s reversal. Understanding these phases gives traders insights to navigate market dynamics effectively and refine their strategies.
Recognizing Trends
Identifying trends is crucial in forex trading for optimal timing. Trends fall into three categories: uptrends, downtrends, and sideways trends, each characterized by specific price movements. An uptrend features higher highs and higher lows, indicating increasing value, while a downtrend shows lower highs and lower lows, signaling decreasing value. Sideways or range-bound markets occur when prices move within a horizontal range, reflecting a balance between buyers and sellers.
Effective trend analysis utilizes technical tools like moving averages and the Relative Strength Index (RSI) to identify these patterns. Aligning trading strategies with the market’s direction enhances trade execution by leveraging momentum and making informed forecasts about future movements.
Technical Setup and Signals
In the realm of forex trading, understanding and utilizing chart patterns, support and resistance levels, and advanced technical strategies are crucial for developing effective trading strategies. These technical setups provide signals that help traders make informed decisions about when to enter and exit trades.
Chart Patterns
Chart patterns play a pivotal role in technical analysis, offering insights into market sentiment and potential price movements. Traders often rely on these patterns to predict continuation or reversal of trends. Common chart patterns include head and shoulders, triangles, and double tops and bottoms.
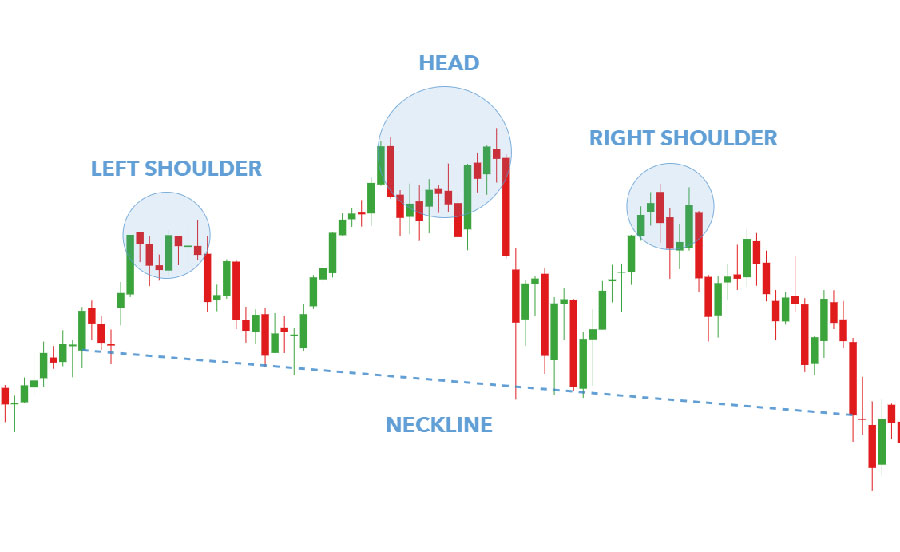
- Head and Shoulders: This pattern is typically a reversal indicator. A head and shoulders pattern appears as three peaks, with the middle peak (head) being the highest and the two side peaks (shoulders) being lower. A break below the neckline, which connects the lows of the two troughs, signals a potential sell-off.
- Triangles: These can be symmetric, ascending, or descending and are generally continuation patterns. They are formed by converging trendlines and a narrowing price range. Traders anticipate a breakout in the direction of the prevailing trend.
- Double Tops and Bottoms: These patterns are indicative of a trend reversal. A double top appears at the peak of an uptrend when the price hits a high point twice and declines between the two peaks. Conversely, a double bottom forms during a downtrend and signals a potential upward reversal.
Read More: The Fibonacci Strategy In Forex
Support and Resistance Levels
Understanding support and resistance levels is essential for identifying potential entry and exit points. These levels indicate where the price of an asset tends to stop and reverse.
- Support Levels: These are price points where a downtrend pauses due to a concentration of demand. As prices reach a support level, it becomes less likely to continue falling, providing a potential entry point for buyers.
- Resistance Levels: Conversely, resistance levels are where price stops rising and may begin to decline due to a concentration of supply. These levels serve as alerts for traders to potentially exit their positions or to enter a short position.
Both support and resistance levels can be identified using various technical tools such as trendlines and moving averages. These levels are more reliable when confirmed by high trading volumes, indicating strong interest from traders at these price points.
Inner Circle Trader (ICT) Techniques
Michael Huddleston, known as the Inner Circle Trader (ICT), has developed several advanced trading strategies that focus on precision and timing. Among these, Kill Zones, Silver Bullet, Turtle Soup, and Judas strategies are notable.
Kill Zones
Kill Zones refer to specific time periods during the trading day when liquidity and volatility are typically higher, such as the London Open, New York Open, and the overlap of these sessions. These periods often present the best opportunities for executing trades with high probability setups.
Silver Bullet Strategy
The Silver Bullet strategy involves identifying key price levels that act as magnets for price action. These levels are typically based on historical price data and are used to pinpoint precise entry and exit points.
Turtle Soup Strategy
The Turtle Soup strategy is designed to capitalize on false breakouts, where the price initially breaks a key level but then quickly reverses.
Judas Strategy
The Judas strategy is named after the biblical figure who betrayed Jesus, symbolizing a deceptive move in the market. This strategy aims to exploit false breakouts or “fake-outs” that mislead traders into entering positions, only for the market to reverse sharply.
Silver Bullet Strategy for Key Price Levels
The Silver Bullet strategy involves identifying key price levels that act as magnets for price action. These levels are typically based on historical price data and are used to pinpoint precise entry and exit points.
- Key Level Identification: Traders can use historical price data to identify significant support and resistance levels where the price is likely to react. These levels serve as strategic points for placing trades.
- Example Integration: Suppose EUR/USD has a historical resistance level at 1.2000. During the New York Open Kill Zone, the price approaches this level. A trader using the Silver Bullet strategy would prepare to enter a short position if the price action suggests a reversal from this resistance level.
Combining Technical and Fundamental Analysis
Combining technical and fundamental analysis offers traders a comprehensive view of the forex market, enhancing the decision-making process for entry and exit strategies. By integrating these two methodologies, traders can gain a deeper and more nuanced understanding of market dynamics, ultimately improving their trading efficacy.
Harmonizing Data
Fundamental analysis assesses economic, social, and political factors influencing currency prices, such as interest rates, GDP growth, unemployment rates, and geopolitical events, to identify long-term trends. Technical analysis, on the other hand, focuses on analyzing historical price charts and various indicators, such as moving averages, RSI (Relative Strength Index), MACD (Moving Average Convergence Divergence), and support and resistance levels, to predict future price movements.
- Economic Indicators: Key economic indicators like non-farm payroll (NFP) data, inflation rates, and central bank interest rate decisions can significantly impact currency values. A robust economic report might suggest a long-term appreciation of a currency.
- Technical Tools: Tools like moving averages can help identify the optimal timing for entering or exiting trades based on the underlying fundamental trends.
Incorporating Economic Calendar Events
Traders should also consider key economic calendar events, which can cause significant market volatility. These events include central bank meetings, economic data releases, and political developments. By anticipating these events through fundamental analysis, traders can adjust their trading strategies and risk management plans accordingly.
- Event Impact Analysis: For instance, if the European Central Bank (ECB) is expected to announce a change in interest rates, a trader might use fundamental analysis to predict the overall direction of the EUR/USD pair. Technical analysis can then help in timing the trade by identifying potential breakout points before or after the announcement.
- Volatility Management: Incorporating these events into their analysis allows traders to better manage volatility and avoid unexpected losses. Setting stop-loss orders and adjusting position sizes based on upcoming events can be part of a comprehensive risk management strategy.
Creating Entry/Exit Rules
To effectively combine technical and fundamental indicators, traders can use fundamental analysis to set the general direction of their trades and technical analysis to refine their entry and exit points.
- Directional Bias: If fundamental analysis indicates a potential appreciation in a currency due to positive economic data, traders can establish a bullish bias. Conversely, negative economic news might suggest a bearish bias.
- Timing Trades: Technical indicators like chart patterns, Fibonacci retracement levels, and price action signals can be used to time the trade accurately. For example, if a bullish trend is anticipated, a trader might look for a technical signal like a moving average crossover or a bullish engulfing pattern to confirm the entry point.
Integrating Trading Volume Analysis
Trading volume analysis can provide additional insights when combined with fundamental and technical analysis. Volume reflects the number of shares or contracts traded in a security or market during a given period and can indicate the strength of a price move.
- Volume Confirmation: Significant changes in trading volume in response to fundamental events can confirm or negate the signals provided by technical analysis. For example, a breakout above a resistance level with high trading volume might confirm the validity of the breakout, indicating strong buying interest.
- Volume Divergence: Conversely, a breakout with low volume might be suspect, suggesting a potential false move. Traders can use this information to make more informed decisions and avoid entering trades based on weak signals.
Read More: What are scalping techniques in forex?
Adapting to Changing Market Conditions
By staying informed on both fundamental and technical factors, traders can adapt to changing market conditions more swiftly and effectively. This dual approach not only helps in identifying the most opportune moments to trade but also enhances risk management by providing clearer guidelines on when to enter or exit the market based on a synthesis of economic indicators and price movements.
- Dynamic Adjustments: For instance, if a trader is long on EUR/USD based on strong economic fundamentals from the Eurozone, but technical analysis indicates an overbought condition with potential for a pullback, the trader might decide to take partial profits or tighten stop-loss orders.
- Continuous Learning: The forex market is constantly evolving, and successful traders continuously learn and adapt their strategies. By integrating both technical and fundamental analyses, traders can stay ahead of the curve and make more informed decisions.
Practicing Patience and Discipline
Setting Realistic Goals
In forex trading, setting realistic goals is crucial for maintaining discipline and managing expectations. Traders should focus on creating goals that are specific, measurable, achievable, relevant, and time-bound (SMART). For instance, instead of aiming for large, quick profits, one might set a goal to review market trends for half an hour three times a week, ensuring consistent engagement with the market without overwhelming pressure. This approach helps traders stay motivated and reduces the likelihood of impulsive decisions driven by unrealistic profit expectations. Moreover, setting achievable goals related to process rather than purely monetary outcomes can significantly enhance trading skills over time.
Sticking to the Plan
Adhering to a well-defined trading plan is crucial in forex trading for cultivating patience and discipline. The plan should include strategies for entry and exit points, risk management, and position sizing tailored to the trader’s goals and risk tolerance. Following this plan helps avoid emotional trading during volatile markets, ensuring consistency. Discipline is maintained by regularly reviewing and adjusting the plan to adapt to market changes and personal growth. This approach not only manages risks effectively but also capitalizes on opportunities, potentially increasing profitability over time.
Monitoring and Adjusting Strategies
Reviewing Trades
Regular review of trading activities is crucial for continuous improvement in forex trading. Traders should meticulously record each trade, noting the entry and exit points, strategies used, and the outcomes. This practice aids in identifying successful strategies and areas needing adjustments. Reviewing trades daily and at the end of each week allows traders to establish short-term and long-term benchmarks, providing a clear perspective on their progress and effectiveness.
Learning from Mistakes
Acknowledging and learning from mistakes is an integral part of refining a forex trading strategy. When a trade does not go as planned, it is essential to document and analyze the mistake. Traders should ask themselves key questions such as why the trade failed, what warning signs were missed, and what could have been done differently. This analysis helps in updating the trading plan, enhancing risk management, and improving overall trading tactics. Regular reflection on trading mistakes and the lessons learned helps traders evolve and avoid repeating the same errors.
Conclusion
Exploring foundational and advanced strategies highlights the critical role of precise timing in forex trading, particularly in entry and exit decisions. We emphasized understanding market cycles and trends, using technical setups, and combining technical and fundamental analysis for effective navigation. Our discussion extended to the benefits of automated trading systems to reduce emotional biases and enhance efficiency. Additionally, we stressed the importance of patience, discipline, realistic goal setting, and adhering to a well-crafted trading plan.
Reflecting on these insights reveals that forex trading success hinges not only on timing but also on continuous learning and adapting strategies to market dynamics. These techniques lay the groundwork for robust trading strategies, emphasizing disciplined approaches and flexibility in response to new insights. By integrating these practices, traders can foster both short-term success and long-term growth in trading proficiency.
What is the best time of day to trade forex?
The best time to trade forex often coincides with high liquidity periods, such as the overlap of the London and New York sessions (8 AM to 12 PM EST). During these times, major currency pairs experience higher volatility, presenting more trading opportunities.
How can I manage risk in forex trading?
Risk management in forex trading involves setting stop-loss orders, limiting leverage usage, diversifying trading instruments, and only risking a small percentage of your trading capital on any single trade. A common rule is not to risk more than 1-2% of your trading account on a single trade.
What is a pip in forex trading?
A pip (percentage in point) is the smallest price move that a given exchange rate can make based on market convention. For most currency pairs, a pip is 0.0001, except for pairs involving the Japanese yen, where a pip is 0.01.
Why do forex prices move?
Forex prices move due to changes in supply and demand, influenced by economic indicators, interest rates, geopolitical events, market sentiment, and other macroeconomic factors. Traders analyze these factors to predict future price movements.


