

A tick chart is a trading chart that prints a new bar every time a fixed number of trades—called ticks—is executed, ignoring clock time. Traders use it to see real buying/selling activity, filter low-volume periods, and time precise entries.
For traders who live and breathe intraday action, the standard 5-minute or 1-hour chart can feel like reading yesterday’s newspaper. Price action is distorted by time, cramming frantic periods of high activity into the same space as the dead, sideways drift of a lunch-hour session. The tick chart throws the clock away. Instead of painting a new candle every five minutes, it paints one every *N* transactions. This simple change offers a profound shift in perspective, revealing the market’s true pulse. This guide explores how tick charts work, why professional day traders often prefer them, and how you can integrate them into your own trading arsenal, covering everything from initial setup to advanced strategies. We’ll also explore the question of what is a tick in trading across different markets.
Key Takeaways
- Measures Activity, Not Time: A tick chart forms a new bar based on a set number of transactions, providing a clearer view of market momentum and conviction.
- Filters Market Noise: It automatically expands during high-activity periods and compresses during lulls, filtering out irrelevant, time-based chop.
- Earlier Signals: Tick charts often reveal breakouts, pullbacks, and institutional activity sooner than time-based charts, giving scalpers an edge.
- Requires a Robust Setup: They are data-intensive and can strain CPU resources. A reliable, low-latency data feed and capable platform are essential.
- Not a Magic Bullet: Successful tick chart trading depends on choosing the right settings for your market and managing the psychological pressure of faster signals.
Tick Chart Definition & How It Works
To grasp the power of a tick chart, you first have to understand its fundamental building block: the tick. It’s a term that can mean slightly different things depending on the market, but the core concept remains the same—it represents the smallest possible price movement or a single transaction.
What is a Tick? Smallest Price Change Explained
A “tick” is the most granular unit of market data. In the context of a tick chart, it refers to a single executed trade, regardless of its size. Here’s how it breaks down across major markets:
- Stocks: For most U.S. stocks, one tick is a price change of $0.01. The concept of a tick as a transaction is central here; every time shares change hands, one tick is recorded. This became standardized after the SEC’s “Tick Size Pilot Program” helped harmonize price increments.
- Futures: In futures contracts, the tick size is predetermined by the exchange (like the CME Group) and represents the minimum price fluctuation. For the E-mini S&P 500 (ES), one tick is 0.25 index points, valued at $12.50. For crude oil (CL), a tick is $0.01, valued at $10. Each trade is a tick.
- Forex: When discussing what is a tick in forex trading, it’s typically synonymous with a pip (Percentage in Point), which is usually the fourth decimal place in a currency pair’s price (e.g., 0.0001). For every transaction that occurs, a tick is generated, causing the price to update on the chart.
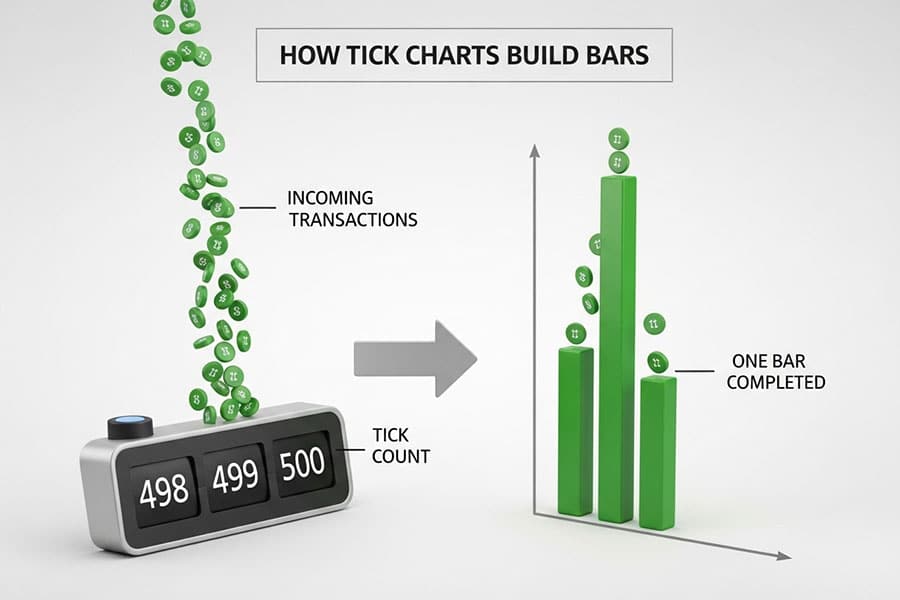
How a Tick Chart Builds Bars
Unlike a 5-minute chart that prints a new bar every 300 seconds regardless of activity, a tick chart prints a new bar after a predefined number of transactions. Let’s use an example: a 500-tick chart of Euro futures (6E).
- The platform starts counting transactions (ticks) as they come in from the data feed.
- One trade happens, the count is 1. Ten more trades happen, the count is 11. Another 489 trades fly in during a news release.
- Once the counter hits 500, the platform closes the current bar—recording its open, high, low, and close—and immediately starts a new bar, resetting the tick counter to zero.
During a volatile period like a major economic announcement, those 500 ticks might occur in just a few seconds, causing the chart to print multiple bars rapidly. Conversely, during a quiet overnight session, it might take 20 minutes or more to complete a single 500-tick bar.
Tick Chart vs. Time Chart—Quick Comparison Table
The difference in methodology leads to vastly different outputs and use cases. Understanding this is key to leveraging the tick chart effectively.
| Feature | Tick Chart | Time Chart (e.g., 5-Minute) |
| Bar Formation | Fixed number of transactions (e.g., 500 ticks) | Fixed time interval (e.g., 5 minutes) |
| Noise Filtration | High. Compresses during low-activity periods, filtering out sideways “chop.” | Low. Prints bars continuously, creating noise during slow market periods. |
| Data Load | Heavy. Requires a constant stream of transaction data, can be CPU-intensive. | Lighter. Requires only OHLC data at fixed intervals. |
| Best Use Case | Scalping, momentum trading, identifying institutional activity in real-time. | Swing trading, identifying session-based patterns, less demanding on hardware. |
Why Pro Traders Prefer Tick Charts
Many systematic and discretionary day traders gravitate towards the tick chart because it offers a more honest depiction of market dynamics. Time is a constant, but market interest is not. By removing the arbitrary constraint of the clock, traders can sync their analysis directly to the flow of transactions.
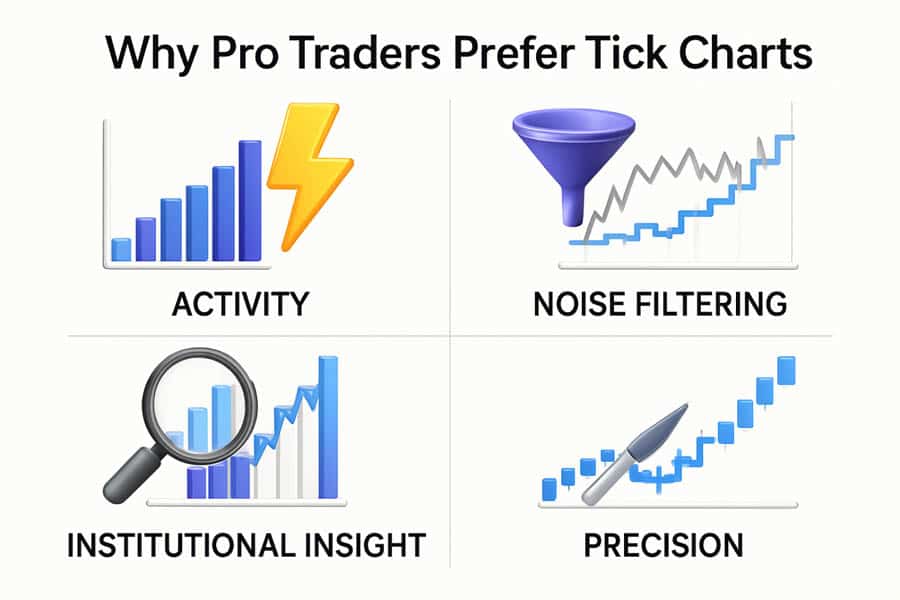
Captures True Market Activity, Not Clock Time
A time-based chart gives equal weight to a 5-minute period at the market open and a 5-minute period during the lunch lull. This is misleading. The open is characterized by a flood of orders and high conviction, while the midday session is often typified by low volume and random noise. A tick chart visualizes this difference perfectly. It will print dozens of bars during the first 30 minutes of the session but only a handful during the slow midday period. This means every bar on your chart represents a similar amount of “market commitment.”
Filters Lunch-Hour Noise & Dead Sessions
One of the biggest challenges for intraday traders is avoiding “chop”—the aimless, range-bound price action that defines low-volume periods. On a time chart, this chop appears as a frustrating series of small, overlapping candles that can trigger false signals. A tick chart elegantly solves this. When volume dries up, the chart simply slows down, printing bars very infrequently. This compression is a powerful visual cue to stay out of the market, preserving capital for when genuine opportunities arise.
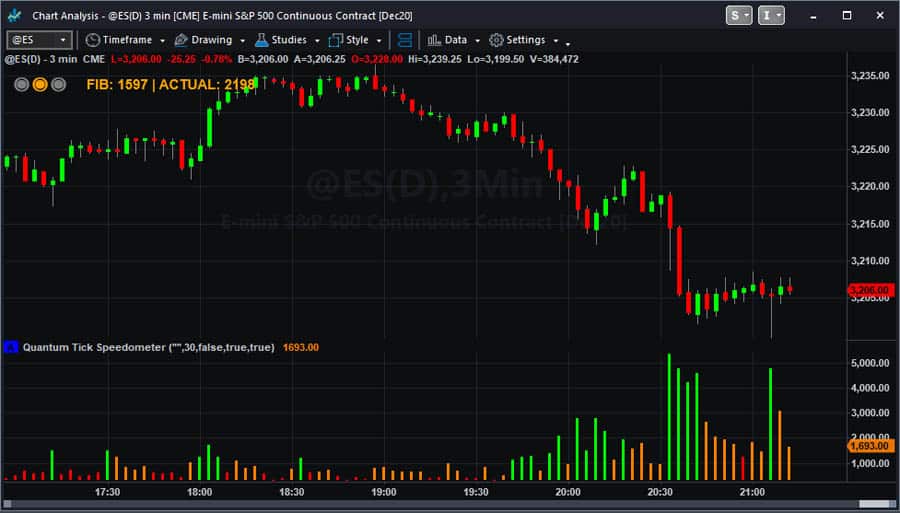
Shows Institutional “Footprints” via Volume Spikes
Institutions move markets. When a large fund executes a massive order, it’s broken into thousands of smaller trades. On a tick chart, this flood of transactions translates into a rapid succession of new bars, often accompanied by a large-bodied candle. This visual “tell” can alert a trader to the presence of big players far more quickly than a time-based chart, which might bury that activity within a single 5-minute candle. By watching for these bursts of speed, tick chart traders can ride the coattails of institutional momentum.
Earlier Breakout and Pull-Back Signals for Scalpers
For scalpers aiming for small, quick profits, timing is everything. Because a tick chart is built from transactions, it reacts instantly to surges in buying or selling pressure. A breakout from a consolidation range will appear as a series of fast-printing, directional bars, often giving a signal several seconds or even minutes before a time-based candle closes. Similarly, a pullback on a tick chart can be more clearly defined, allowing for a tighter entry as the market demonstrates it’s ready to resume the trend.
Read More: Tick Chart vs Candlestick
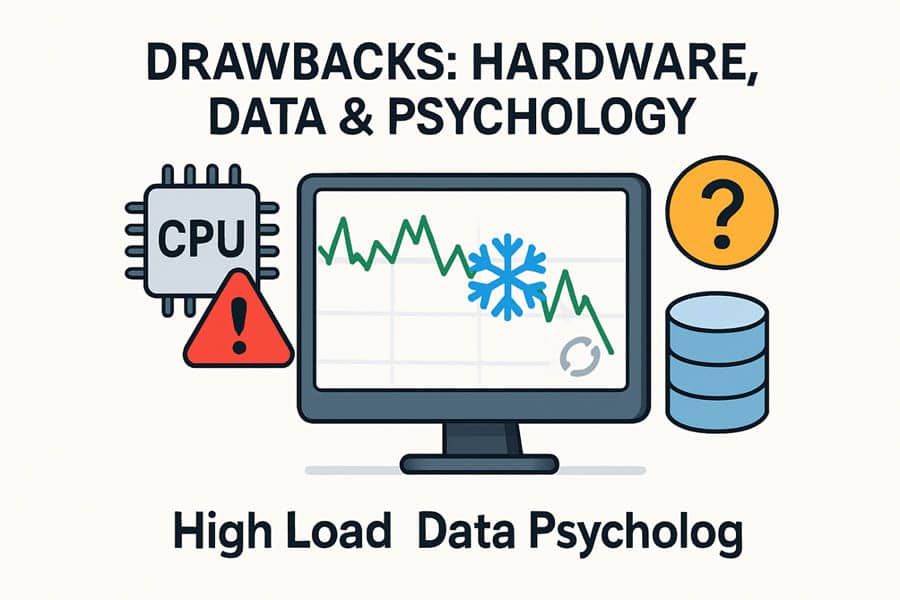
Drawbacks & Risks You Must Manage
While the tick chart is a powerful tool, it’s not without its challenges. Adopting it requires an understanding of its limitations and risks. Ignoring these can lead to technical headaches, blown accounts, and significant frustration.
Data-Feed Inconsistencies Between Platforms
This is the most critical and often misunderstood risk. A tick chart is 100% dependent on the quality and filtering of its data feed. Different data providers (e.g., Rithmic, CQG, IQFeed) and different brokers may filter or aggregate tick data differently. This means a 500-tick chart on NinjaTrader with a Rithmic feed might look slightly different from a 500-tick chart on TradeStation with its proprietary feed. These small differences can alter indicator readings and bar patterns, so it’s crucial to stick with one high-quality setup for consistency.
Heavy CPU/Memory Load; Solution: Hardware & Caching
Processing every single transaction for a busy instrument like NQ or ES futures is incredibly demanding on your computer. A tick chart can easily freeze or lag on an underpowered machine, especially during high volatility. Solutions:
- Hardware: A modern multi-core processor (like an Intel i7/i9 or AMD Ryzen 7/9) and at least 16GB of RAM are highly recommended. A solid-state drive (SSD) also helps with platform responsiveness.
- Platform Caching: Some platforms allow you to cache tick data locally, which can reduce the real-time processing load. Check your software’s performance settings.
- Limit Chart History: Don’t load 30 days of tick data if you only need two. Adjust your chart settings to load only the necessary history to keep performance snappy.
Limited Historical Back-Testing Depth
The sheer volume of tick data means that storing and accessing it is a major challenge. Most platforms and data providers only offer a limited history of tick data—often just a few weeks or months. This makes robust, long-term back-testing of strategies very difficult. While you can test your strategy over recent market conditions, you won’t be able to see how it would have performed years ago without purchasing expensive historical data packages.
Psychological Pressure of Rapid-Fire Trading
A tick chart accelerates the trading process. Signals appear faster, and bars can form in seconds. This can create a sense of urgency and lead to overtrading or “revenge trading” after a loss. The constant stream of information can be mentally exhausting. It requires immense discipline to wait for your specific setup and not get lured into low-probability trades just because the chart is moving. Managing this psychological component is as important as any technical aspect of your strategy.
Read More: Forex Charts: A Comprehensive Guide for Beginners
Best Tick Settings by Market in 2025 (Table)
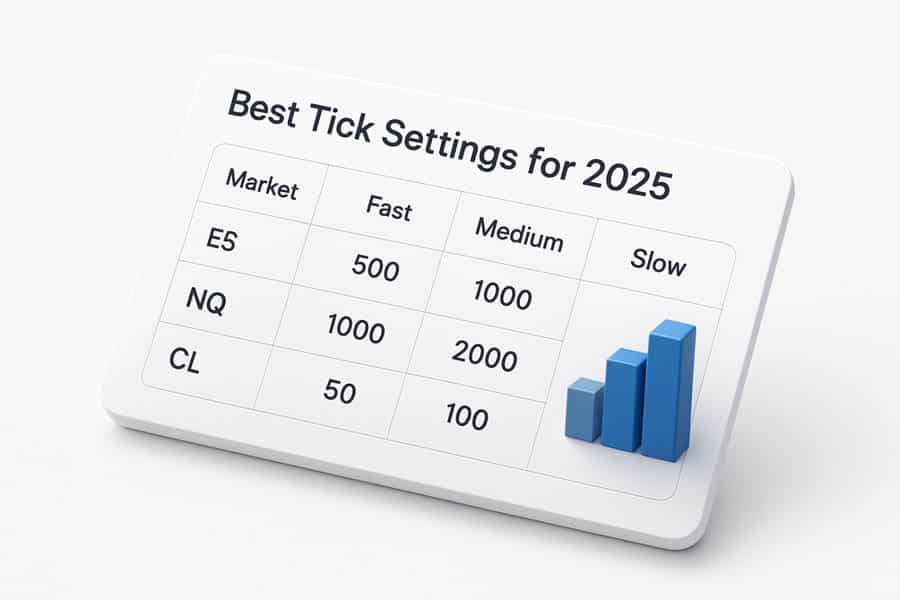
Choosing your tick value is not arbitrary. It’s a process of calibration based on a market’s volatility and volume. A setting that works for crude oil will be useless for the E-mini S&P 500. Traders typically use a “three-chart” system: a fast chart for entry timing, a medium chart for trend context, and a slow chart for the overall market structure. Below are widely accepted baseline settings for 2025, which should be adjusted based on current market conditions.
| Market | Fast Setting (Entry) | Medium Setting (Trend) | Slow Setting (Structure) |
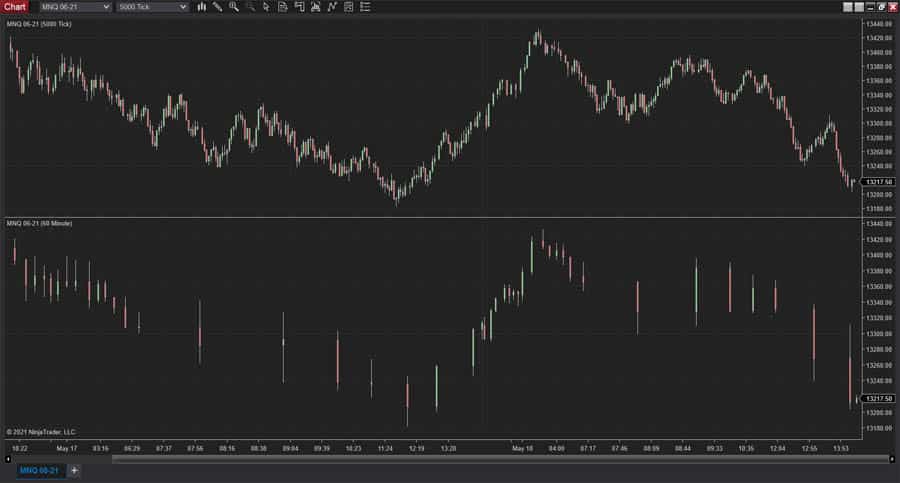
| Futures: E-mini S&P 500 (ES) | 500 ticks | 1,500 ticks | 4,500 ticks |
| Futures: E-mini Nasdaq (NQ) | 250 ticks | 750 ticks | 2,250 ticks |
| Futures: Crude Oil (CL) | 300 ticks | 900 ticks | 2,700 ticks |
| Forex Futures: Euro (6E) | 500 ticks | 1,500 ticks | 4,500 ticks |
| Forex Futures: British Pound (6B) | 250 ticks | 750 ticks | 2,250 ticks |
| Crypto: Bitcoin (BTC) Futures | 500 ticks | 1,500 ticks | 4,500 ticks |
Note: These are starting points. Always observe how many bars a setting prints during key trading hours to fine-tune it to your preference.
Platform How-Tos (Mini Guides)
Setting up a tick chart is straightforward on professional-grade platforms, but the specific steps can vary. Here’s how to do it on some of the most popular platforms for active traders.
TradeStation: Switch “Volume” from TickCount → TradeVol
TradeStation has a nuanced but powerful way to build tick-based charts. Instead of a direct “tick chart” type, you use the “Volume” chart type and tell it how to count volume.
- Open a new chart for your desired symbol.
- Right-click on the chart and select “Format Symbol…” or “Data…”.
- In the settings, set the “Base chart on” field to “Volume”.
- For “Bar’s volume,” enter your desired tick value (e.g., 500).
- Crucially, set the “Volume to be based on” dropdown to “Tick Count”. This tells TradeStation to build a bar based on the number of trades, not the number of shares.
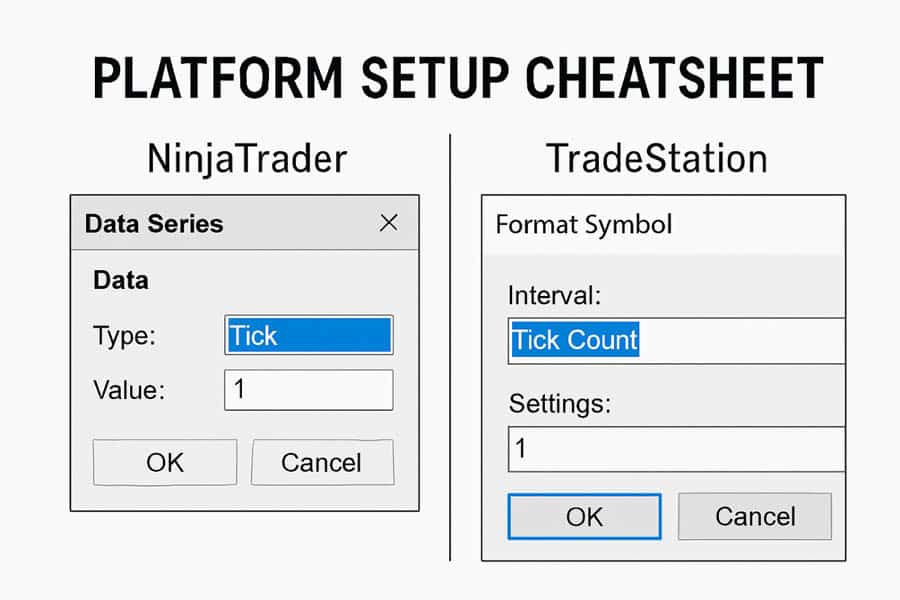
NinjaTrader: Data Series ▶ Type Tick ▶ Set Value
NinjaTrader is renowned for its excellent charting capabilities and makes setting up a tick chart very simple.
- With a chart open, right-click and select “Data Series”.
- In the Data Series window, look for the “Type” parameter on the right.
- Change the type from “Minute” to “Tick”.
- A “Value” field will appear just below. Enter your desired tick setting (e.g., 1500).
- Click “OK” or “Apply”. Your chart will immediately reload as a 1500-tick chart.
TradingView: Tick Charts Beta—Expert Tier
For a long time, TradingView lacked true tick charts, but they are now available in beta for premium subscribers. The functionality is still evolving.
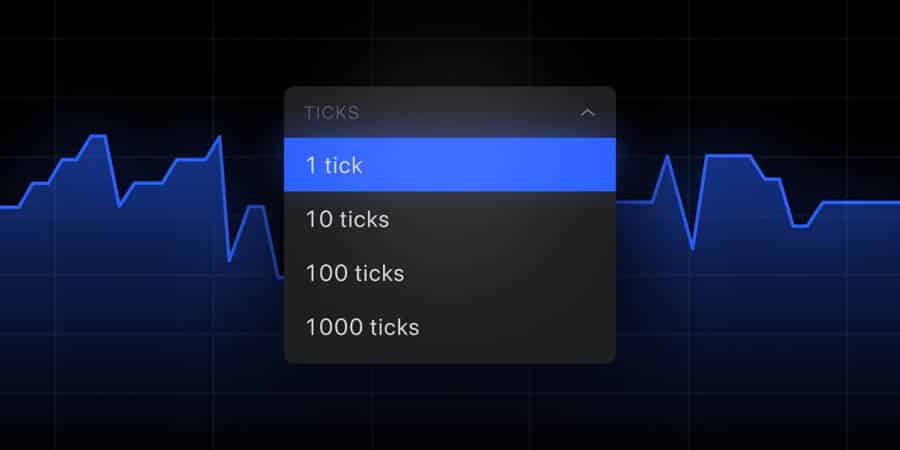
- You must have an Expert plan subscription and a supported broker providing tick data.
- Click on the time interval at the top of the chart.
- At the bottom of the interval list, you will see the “Tick” section.
- Select from predefined values (1T, 10T, 100T, 1000T) or type in your custom value.
- The chart will reload based on tick data. Availability depends heavily on the connected data feed.
Why IB & MT4/MT5 Snapshots Distort Tick Charts
Many traders wonder why they can’t get proper tick charts on platforms like MetaTrader 4/5 or a basic Interactive Brokers (IB) TWS chart. The reason is the data feed. These platforms typically use “snapshot” data. Instead of streaming every single trade, the feed provides price updates several times per second. This is an aggregation, not the raw tick-by-tick data stream required to build a true tick chart. The result is a distorted, inaccurate chart that doesn’t reflect the real transaction flow and should not be used for serious tick-based analysis.
Proven Tick-Chart Trading Strategies
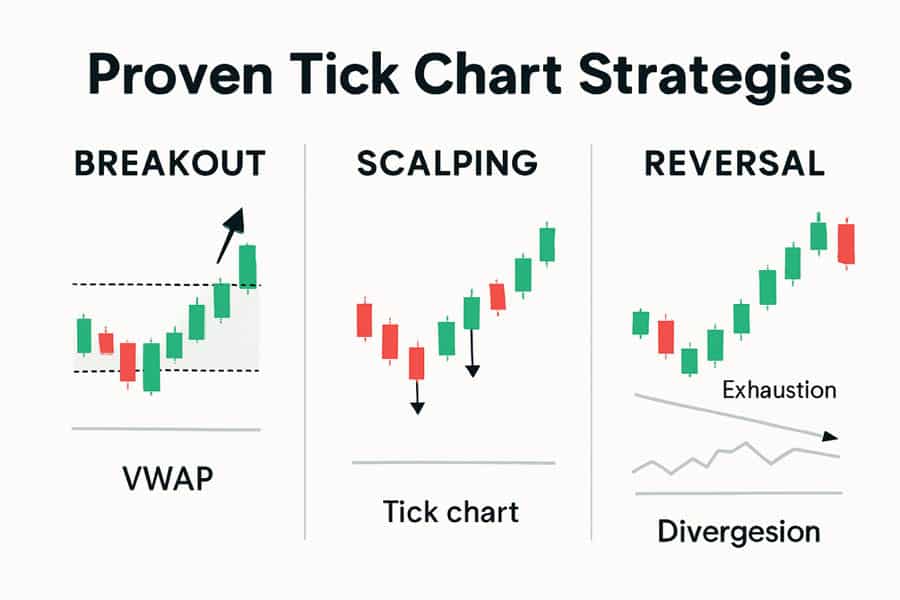
A tick chart is a lens, not a complete system. It enhances signals from your existing trading methodology. Here are three proven strategies that are particularly effective when viewed through the clarity of tick charts, combining them with other common tools.
Scalping 1-Tick Profit Bursts (High Frequency)
This is a high-speed strategy focused on capturing tiny, predictable price movements. It often involves trading for just one or two ticks of profit. On a very fast tick chart (e.g., 100-200 ticks for ES), traders look for micro-trends and use order flow tools like the depth of market (DOM) to spot absorption or iceberged orders. The chart helps visualize the immediate momentum. A trader might buy when they see a series of quick green bars and an offer being absorbed on the DOM, aiming to exit the moment the buying pressure hesitates.
Momentum Breakouts on Volume Surge (VWAP Overlay)
This is a classic day trading strategy, supercharged by the tick chart. The goal is to enter as price breaks out of a consolidation range with conviction.
- Setup: Plot the Volume-Weighted Average Price (VWAP) on your medium tick chart (e.g., 1,500 ticks for ES). Look for a period where price is coiling in a tight range near the VWAP.
- Signal: A breakout is confirmed when you see a sudden acceleration in the speed of the bars printing (a volume surge) and a large-bodied candle closing outside the range.
- Entry: Enter on the breakout bar or on a quick pullback to the breakout level, with a stop just inside the previous range. The VWAP acts as a dynamic level of support or resistance.
Reversal/Fade at Exhaustion Bars (Divergence + Order Flow)
Tick charts are exceptional at showing trend exhaustion. When a strong trend is nearing its end, you’ll often see a “climactic” move.
- Setup: On your fast tick chart, look for a trend that has become extended. Add an oscillator like the RSI or MACD.
- Signal: Look for a bar that is significantly larger than the preceding bars and prints extremely quickly—this is a potential exhaustion bar. Simultaneously, look for bearish or bullish divergence on your oscillator (e.g., price makes a new high, but the RSI makes a lower high).
- Entry: This is a counter-trend trade. Enter short after the exhaustion bar closes, with a tight stop just above its high. This “fade” strategy aims to capture the sharp reversal that often follows a buying or selling climax. Combining this with order flow tools to see if volume is trapped at the high/low adds significant confirmation.
Risk Management: Commission Impact & Tight Stops
Fast-paced trading magnifies the impact of costs. Since tick chart strategies often involve more frequent trades, commissions and slippage can quickly erode profits. It’s essential to trade on a platform with competitive commissions. Furthermore, the clarity of tick charts allows for very precise stop-loss placement—often just a few ticks below a support level or above a resistance bar—which is crucial for maintaining a healthy risk-reward ratio.
Read More: Tick Chart Scalping Strategies
Tick Size in Forex & Futures
Understanding the precise value of a tick is fundamental to calculating profit, loss, and risk. While the concept of what is a tick in trading is universal (a single move), its financial value varies dramatically between asset classes.
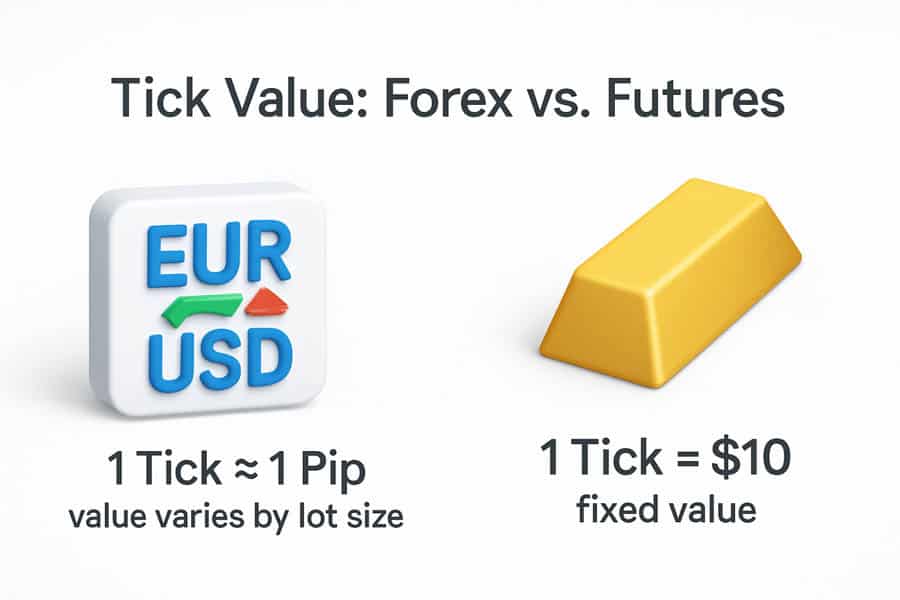
Forex: Tick ≈ 1 Pip (0.0001) But Value Varies by Lot
In the spot forex market, a tick is the smallest change in price, which is almost always a “pip.” For most major pairs like EUR/USD or GBP/USD, a pip is 0.0001. The value of that pip, however, is determined by your trade size (lot size).
- Standard Lot (100,000 units): 1 pip ≈ $10
- Mini Lot (10,000 units): 1 pip ≈ $1
- Micro Lot (1,000 units): 1 pip ≈ $0.10
So, if you are trading a mini lot of EUR/USD and the price moves 10 pips in your favor, you have made approximately $10. For a tick chart in forex, every update on the price feed constitutes one tick.
Futures Examples: ES Tick 0.25 pt worth $12.50; Gold Tick 0.1 worth $10
In futures, tick sizes and values are standardized by the exchange and are non-negotiable. This consistency is a major draw for futures traders.
- E-mini S&P 500 (ES): The minimum tick is 0.25 index points. Each 0.25 point move has a fixed value of $12.50 per contract. A full 1.00 point move in the ES is therefore worth $50.
- Gold Futures (GC): The minimum tick is $0.10 (10 cents) per troy ounce. Each $0.10 move has a fixed value of $10.00 per contract. A full $1.00 move in gold is worth $100.
This fixed value makes risk calculation straightforward. A 4-tick stop-loss on one contract of ES is always 4 x $12.50 = $50 of risk.
How to Calculate Tick Value and Profit Per Contract
The calculation is simple multiplication:
Total Profit/Loss = (Number of Ticks Captured) x (Tick Value per Contract) x (Number of Contracts)
Example: You go long 2 contracts of Crude Oil (CL). You enter at $80.00 and exit at $80.20.
- Price Move: $80.20 – $80.00 = $0.20
- Number of Ticks: The tick size for CL is $0.01. So, a $0.20 move is 20 ticks.
- Tick Value: The value of one CL tick is $10.
- Calculation: (20 Ticks) x ($10/tick) x (2 Contracts) = $400 Profit.
Elevate Your Trading with OpoFinance
Ready to apply these tick chart strategies with a world-class broker? OpoFinance provides the ultimate trading environment, empowering you with advanced tools and robust security.
- Trade on leading platforms including MT4, MT5, and cTrader.
- Gain a competitive edge with our exclusive AI Market Analyzer, AI Coach, and AI Support.
- Explore diverse opportunities with social trading and prop trading programs.
- Enjoy peace of mind with ASIC regulation and secure, zero-fee crypto deposits/withdrawals.
Join OpoFinance today and transform your trading experience.
Conclusion
The tick chart is more than just another charting method; it’s a paradigm shift. By discarding the arbitrary construct of time, it provides a purer, more direct view of the battle between buyers and sellers. It filters noise, highlights momentum, and offers earlier signals to the disciplined trader. However, it demands a professional approach—requiring robust hardware, a quality data feed, and mastery over one’s own trading psychology. For the scalper and intraday momentum trader, mastering the tick chart isn’t just an option; it’s a critical step toward reading the market in real-time.
What is a zero-plus tick?
A zero-plus tick is a term used in stock trading. It refers to a trade executed at the same price as the immediately preceding trade, but that preceding trade was at a higher price than the one before it. It indicates a pause in a downtrend and was historically relevant for rules regarding when a stock could be sold short.
Can I combine tick and range charts?
Yes, many advanced traders use multiple chart types together. For example, they might use a slow tick chart (e.g., 4500-tick) to define the main trend and a range chart (e.g., 8-range) for precise entries, as range charts are excellent at defining support and resistance levels within a trend.
Do tick charts work overnight?
Yes, they work 24/7, but their behavior changes dramatically. During low-volume overnight sessions, a tick chart will print bars very slowly, visually representing the lack of activity. This can be an effective filter, telling traders to stay out until volume returns.
What is the minimum internet speed for tick trading?
It’s less about raw speed (Mbps) and more about low latency (ping). A stable, low-latency connection (under 50ms to your broker’s server) is more important than high bandwidth. A fiber optic connection is ideal to ensure the tick data arrives without delay, which is critical for accurate chart formation.
How does a tick differ from volume?
A “tick” in a tick chart is one transaction, regardless of size. “Volume” is the total number of shares or contracts exchanged in that transaction. A single tick (one trade) could have a volume of 1 contract or 1,000 contracts. This is why some platforms differentiate between “Tick Count” and “Trade Volume” charts.


