

Are you tired of watching a currency pair bottom out and then rally aggressively without you? Spotting a true market bottom before it takes off is one of the most challenging yet rewarding skills in currency trading. The w pattern in forex, also known as the double bottom, is a powerful reversal signal that indicates a downtrend may be losing steam and buyers are about to take control. This guide provides a complete playbook for identifying and trading this pattern. With a reliable online forex broker, you can apply these techniques to spot high-probability setups and improve your trading precision.

Key Takeaways
- Pattern Definition: The W pattern is a bullish reversal formation that appears at the end of a downtrend, signaling a potential shift in market momentum from sellers to buyers.
- Core Components: It consists of two distinct troughs at roughly the same price level, separated by an interim peak. The horizontal line connecting the peaks is called the “neckline.”
- Confirmation is Crucial: A true w pattern in forex is only confirmed when the price breaks above the neckline, ideally with increasing volume, signaling that buyers have overcome resistance.
- Trading Strategy: Common entry points are either on the breakout above the neckline or on a subsequent retest of the neckline as new support. Stop-losses are typically placed below the second trough.
- Risk Management: Proper risk management, including calculated position sizing (1-2% of equity) and avoiding setups during high-impact news events, is essential for long-term success with this pattern.
What Does the W Pattern Mean in Forex?
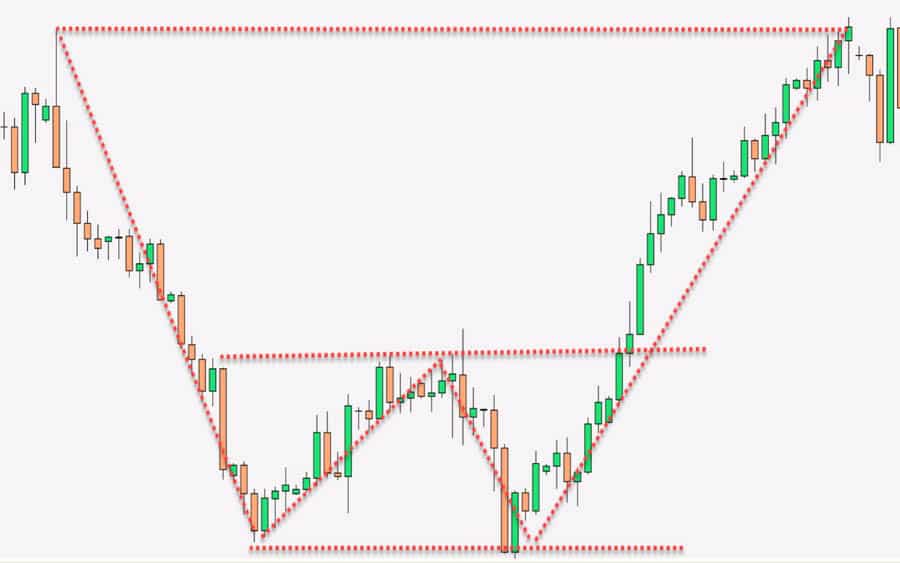
Before you can trade it, you need to understand what the w pattern mean in forex. At its core, the W pattern, or double bottom, is a story of a battle between sellers and buyers where the buyers ultimately win. It’s a classic technical analysis formation that signals the potential end of a downtrend and the beginning of a new uptrend. It’s called the “W” pattern simply because its shape on a price chart resembles the letter W. The term “double bottom” is more descriptive, as the pattern is defined by two consecutive troughs, or “bottoms,” forming at approximately the same price level.

The psychology behind this pattern is what gives it predictive power. The first trough forms as sellers push the price down to a new low, where some buyers see value and start entering the market, causing a temporary bounce. This bounce forms the middle peak of the W. However, the selling pressure isn’t completely gone. The bears attempt another push lower, but they fail to break the previous low. This second trough, forming at or slightly above the first, shows that seller momentum is exhausted. Buyers, now more confident that the support level will hold, step in with greater force, pushing the price back up toward the interim peak. The breakout above this peak (the neckline) confirms the shift in power. This is the moment I’ve learned to watch for—it’s the market telling you that the path of least resistance has changed from down to up. Understanding the w pattern mean in forex is the first step to mastering its application.
Fast Visual Checklist
When you’re scanning charts, things can get noisy. I find it helps to have a simple mental checklist to quickly qualify a potential setup. A valid w pattern in forex trading has five distinct parts that you must identify in sequence. Missing any one of these can lead to a failed pattern and a losing trade. Here’s a quick rundown to keep you on track.
- First Trough: The initial low point of the pattern, marking a significant support level where selling pressure first paused.
- Middle Peak (Rally): A temporary bounce from the first trough, forming the center point of the “W.” The high of this peak creates the initial point for the neckline.
- Second Trough: Another decline that finds support at or near the level of the first trough. This failure to create a new low is a critical sign of seller exhaustion.
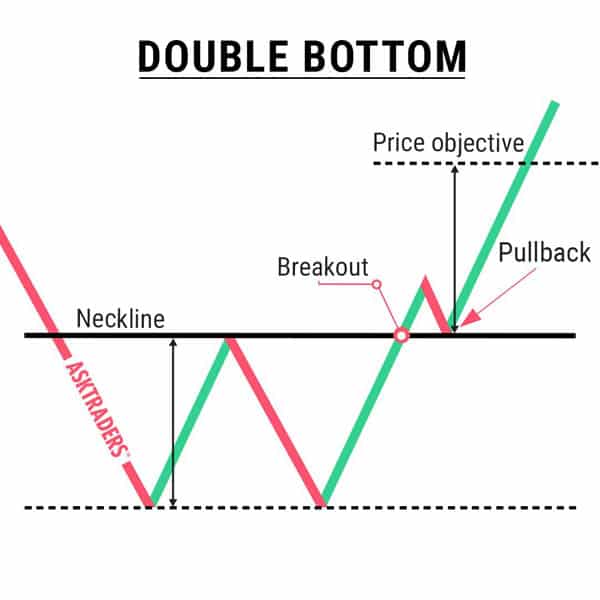
- Neckline: A horizontal resistance line drawn across the highest point of the middle peak. This is the final barrier for buyers to overcome.
- Breakout: A decisive price move where a candle closes firmly above the neckline, confirming the pattern and signaling a potential entry point for a long position.
How to Spot a High-Probability W Pattern
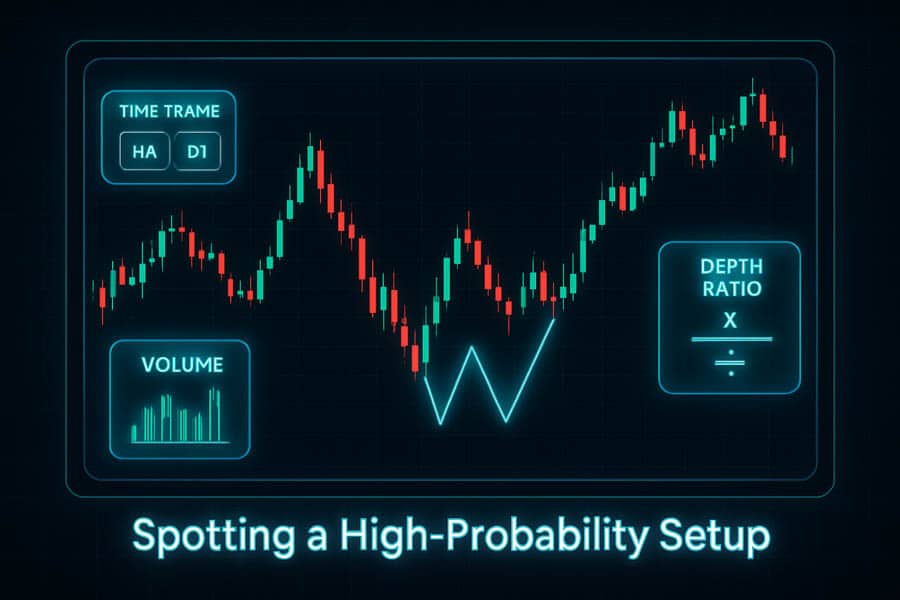
Not all W patterns are created equal. Over the years, I’ve learned that the highest-probability setups share a few key characteristics. Ignoring these can be the difference between a textbook trade and a frustrating fakeout. The context in which the w pattern in forex appears is just as important as the pattern itself. It’s about building a case for the trade, not just blindly trading a shape on the screen. Let’s break down the three critical filters I use to qualify a setup.
Time-Frame Selection
The reliability of any chart pattern, including the w pattern in forex, increases significantly on higher time frames. While you might spot W-like shapes on a 5-minute or 15-minute chart, they are often just market noise and prone to failure. In my experience, this pattern performs best on the 1-hour (H1), 4-hour (H4), and daily (D1) charts. Why? Because these time frames represent a more significant shift in market sentiment. A double bottom on a daily chart means that sellers have failed to break a key level for days or even weeks, giving the subsequent breakout much more weight and credibility. Lower time frames are susceptible to whipsaws from news events and algorithmic trading, making patterns less reliable. Stick to H1 and above to filter out the noise and focus on more meaningful market structures.
Volume & Momentum Confirmation
Price action tells you what is happening, but volume tells you the conviction behind the move. This is a crucial piece of the puzzle for a successful w pattern in forex trading. Ideally, you want to see a specific volume signature. The volume on the first trough is usually high as sellers drive the market down. During the rally to the middle peak, volume may decrease. The key is the second trough: volume should ideally be lower here than on the first trough, indicating that selling pressure is drying up. The most important signal is the breakout. A decisive close above the neckline should be accompanied by a significant spike in volume. This surge shows strong buyer commitment and confirms that the market is ready to move higher. Without this volume confirmation, a breakout is more likely to be a “fakeout.” Additionally, using momentum oscillators like the RSI or MACD can provide further confirmation through bullish divergence, which we’ll cover in the strategies section.
“Depth-to-Peak” Ratio Yardstick
The shape and proportion of the pattern matter. A shallow, compressed W pattern often lacks the power for a sustained move. To qualify as a strong setup, the pattern needs some “breathing room.” A useful rule of thumb is the “depth-to-peak” ratio. The distance from the lowest trough to the neckline should represent a meaningful price move. While there’s no magic number, I look for patterns where the height (depth) is at least 10-15% of the preceding downtrend. A more robust and well-defined pattern, where the troughs are clearly separated and the middle peak is significant, has a much higher chance of success. A pattern that is too shallow suggests that the battle between buyers and sellers was insignificant, and the resulting breakout may lack follow-through. A quality w pattern in forex has clear symmetry and depth, making it stand out on the chart.
Step-by-Step Identification Guide
Successfully trading the w pattern in forex requires a systematic approach. You can’t just guess when you see something that looks like a ‘W’. Following a clear, step-by-step process ensures you are only trading validated patterns, which significantly improves your odds. Think of it as a pre-flight checklist; you tick every box before taking the trade. Here is the exact process I follow every time I identify a potential double bottom setup.
- Confirm a Prevailing Downtrend: The W pattern is a bullish *reversal* pattern. For something to reverse, it must first be moving in a clear direction. Look for a series of lower lows and lower highs on your chosen time frame. The pattern is meaningless if it appears in a sideways or ranging market. The downtrend provides the necessary context for the pattern’s significance.
- Mark the First Low (Trough 1): Identify the point where the downtrend stalls and price makes a significant low. This level becomes a critical area of potential support. This is the first anchor point of your potential w pattern in forex.
- Trace the Rebound to the Interim High (Middle Peak): After the first low, the price will bounce. Follow this rally up to its peak before it starts to turn down again. This high point is crucial as it defines the initial level of your neckline.
- Await the Second Low (Trough 2): This is a test of the first low. The price declines again, but crucially, it fails to break below the first trough. The second low should form at or slightly above the price level of the first low. This failure to make a new low is the strongest signal yet that sellers are losing control.
- Draw the Neckline: Connect the highest point of the middle peak with a horizontal line. This line represents the key resistance level that buyers must overcome to confirm the reversal. The pattern is not complete until this line is drawn and respected.
- Wait for a Candle Close Above the Neckline: Patience is paramount here. Many traders jump the gun and enter before confirmation. A true breakout occurs only when a full candle body closes decisively above the neckline. A mere wick poking through is not enough and is often a sign of a trap. This confirmed close is your trigger to consider entering a trade.
Proven Trading Strategies with the W Pattern
Once you’ve correctly identified a high-probability w pattern in forex, the next step is execution. There isn’t just one way to trade it. Different entry strategies suit different risk appetites and market conditions. From my experience, having a few proven methods in your toolkit allows you to adapt. Below are the most effective strategies I use for w pattern in forex trading, complete with risk management considerations.
Breakout Entry Strategy
This is the most common and straightforward method. The entry trigger is the moment a candle closes decisively above the neckline. This signals that buying momentum has officially taken over.
- Entry: Place a buy order slightly above the high of the breakout candle for confirmation.
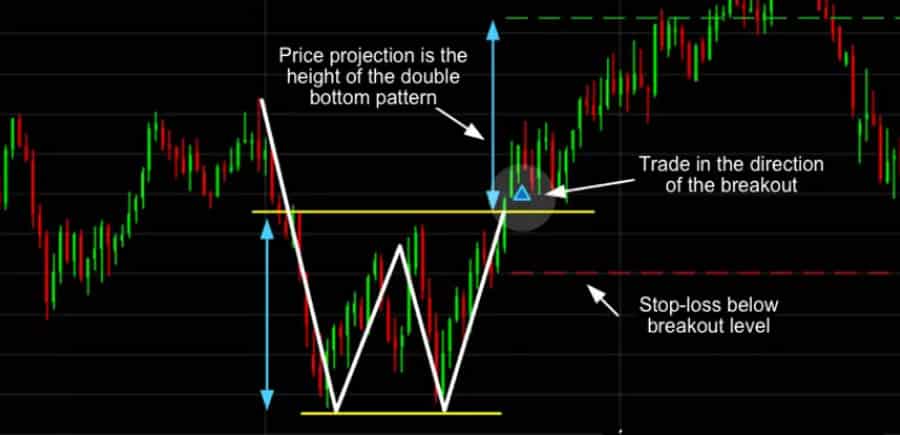
- Stop-Loss: The stop-loss is placed a few pips below the second trough (the lowest point of the ‘W’). This gives the trade room to breathe while defining your maximum risk.
- Profit Target: The classic way to set a target is to measure the height of the pattern (from the lowest trough to the neckline) and project that distance upward from the breakout point. This gives a minimum target, often referred to as a measured move.
- Risk-to-Reward: For example, if the pattern height is 100 pips, your profit target is 100 pips above the neckline. If your stop-loss below the second trough is 50 pips, your risk-to-reward ratio is a favorable 1:2. I never take a trade unless the potential reward is at least twice the risk.
Pullback-Entry Variant
This is a more conservative and often higher-probability entry method. Instead of entering on the initial breakout, you wait for the price to return and retest the broken neckline, which should now act as support.
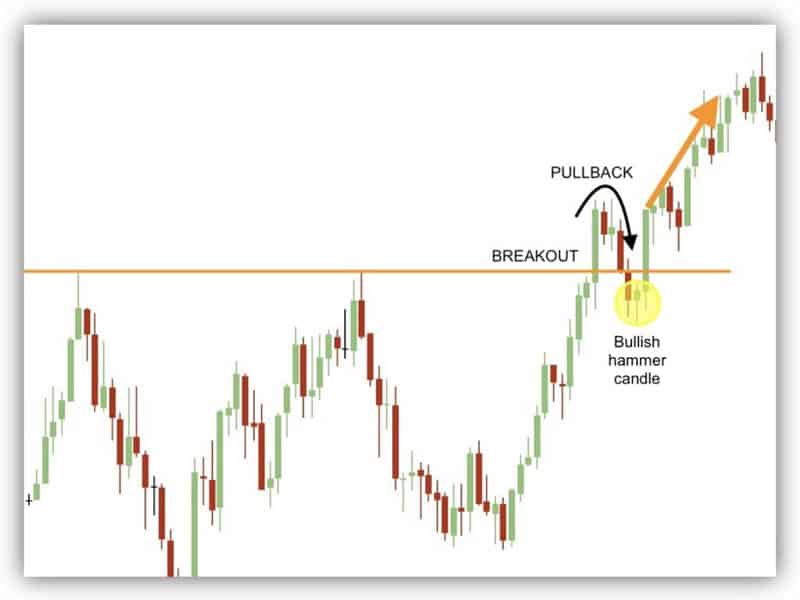
- Entry: Wait for the price to pull back to the neckline. Enter a buy order once you see a bullish confirmation candle (like a pin bar or engulfing candle) form on the neckline, confirming it as support.
- Stop-Loss: The stop-loss can be placed more tightly, typically just below the neckline or the low of the confirmation candle, reducing the overall risk in pips.
- Profit Target: The profit target remains the same as the breakout method (the measured move of the pattern’s height).
- Benefit: This method often provides a better risk-to-reward ratio because the entry point is lower and the stop-loss is tighter. The downside is that sometimes the market rallies aggressively after the breakout and the pullback never occurs, meaning you miss the trade.
Fibonacci Confluence Trade
For an added layer of confirmation, you can combine the w pattern in forex with Fibonacci retracement levels. This helps identify stronger support/resistance zones and can refine your entry and target points.
- How it works: Draw a Fibonacci retracement tool from the start of the preceding downtrend to the lowest trough of the W pattern. The neckline of the W pattern often aligns with a key Fibonacci level (e.g., 38.2% or 50.0%). A breakout above this confluent level adds significant weight to the trade. Similarly, the profit target (measured move) may align with a Fibonacci extension level, giving you more confidence in your target.
Divergence Confirmation with RSI/MACD
This is one of my favorite confirmation techniques. Bullish divergence occurs when the price makes a lower low or an equal low (as in the W pattern), but a momentum indicator like the RSI or MACD makes a higher low.
- How it works: As the price forms the second trough of the w pattern in forex trading, check your RSI or MACD. If the indicator’s low corresponding to the second price trough is higher than its low at the first price trough, it signals that downside momentum is fading, even as the price is retesting the low. This divergence is a powerful leading indicator that a reversal is imminent and adds immense confidence to the subsequent breakout trade.
Managing Risk Like a Pro

You can identify the most perfect w pattern in forex, but without disciplined risk management, you will not be profitable in the long run. Trading is a game of probabilities, and even the best setups can fail. How you manage your capital during those failures is what separates professional traders from amateurs. Protecting your account is your number one job. Here are the non-negotiable risk control rules I apply to every trade.
Position Sizing Formula
Never risk more than you can afford to lose. A common professional standard is to risk only 1% to 2% of your trading equity on a single trade. This means if you have a $10,000 account, your maximum loss on any given trade should be between $100 and $200.
- How to Calculate: First, determine your stop-loss in pips (the distance from your entry to your stop-loss level). Let’s say it’s 50 pips. Then, decide on your risk percentage (e.g., 1% of $10,000 is $100). Your position size is then calculated as: (Risk Amount) / (Stop Loss in Pips * Pip Value). This ensures that no matter how wide or tight your stop is, the dollar amount you risk remains constant.
Adjust Stop-Loss Beyond ATR
Placing a stop-loss just a few pips below the second low is a common mistake. Why? Because it makes you vulnerable to “whipsaws” or “stop hunting,” where the price briefly dips below a key level to trigger stop orders before reversing. To avoid this, I use the Average True Range (ATR) indicator. The ATR measures market volatility. I place my stop-loss at the second trough’s low minus a multiple of the ATR (e.g., 1.5x ATR). This places my stop outside the normal market “noise,” giving the trade a better chance to succeed without being stopped out prematurely. This small adjustment has saved me from countless frustrating losses. The w pattern in forex needs room to breathe.
Pre-News Filter
High-impact news events like interest rate decisions, non-farm payroll (NFP) releases, or central bank press conferences can throw any technical setup out the window. Volatility explodes, and price can move hundreds of pips in seconds, often ignoring key support and resistance levels. A beautiful w pattern in forex trading can be completely invalidated by a surprise data release. As a rule, I always check a reliable economic calendar before entering a trade. If a major event is scheduled within the next few hours for the currency pair I’m watching, I will either stay out of the market or significantly reduce my position size. It’s simply not worth the gamble. Trading the pattern is about finding a high-probability edge, and major news turns the market into a coin flip.
Common Mistakes and How to Avoid Them
Knowing the theory behind the w pattern in forex is one thing; executing it flawlessly under pressure is another. Over the years, I’ve made every mistake in the book, and I’ve seen countless other traders make them too. Recognizing these common pitfalls is the first step to avoiding them and protecting your capital. These are the top three errors that can derail an otherwise solid trading plan based on this pattern.
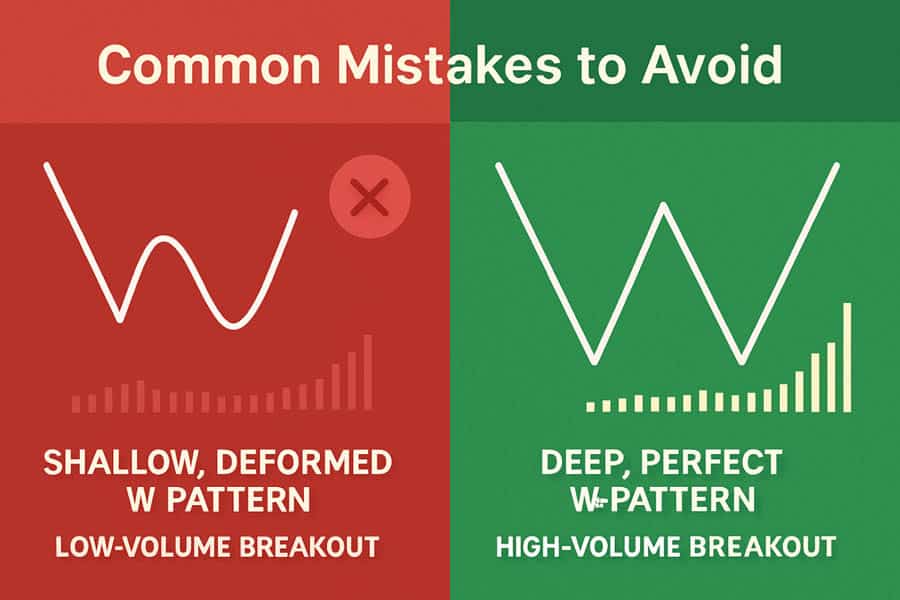
Trading Shallow or Deformed Patterns
One of the biggest mistakes is forcing a trade on a pattern that isn’t clear or well-formed. A high-quality W pattern should be symmetrical and have significant depth, as discussed earlier. A shallow pattern, where the middle peak is barely a blip, indicates weak conviction from buyers. Similarly, if the second trough is significantly lower than the first, it’s not a true double bottom but rather a continuation of the downtrend.
- How to Avoid: Be patient and selective. Don’t go looking for patterns; let them jump out at you. If you have to squint and ask yourself, “Is that a W?”, then it’s probably not a high-quality setup. Stick to the textbook examples that are obvious and clean. My rule is simple: if in doubt, stay out. There will always be another trade. The w pattern mean in forex is rooted in clear seller exhaustion, which isn’t present in a weak formation.
Ignoring Low-Volume Breakouts
As I emphasized earlier, volume is a critical confirmation tool. A breakout above the neckline on weak or declining volume is a major red flag. It suggests a lack of institutional buying pressure and a high probability that the move is a “fakeout” designed to trap eager retail traders. The price may poke above the neckline only to reverse sharply and stop you out.
- How to Avoid: Make volume analysis a mandatory part of your checklist. Most trading platforms offer a volume indicator. Look for a noticeable spike in volume as the price breaks the neckline. This surge confirms that large players are participating in the move and that the breakout has conviction. Ignoring this signal is like driving through a red light; you might get away with it once or twice, but eventually, it will lead to a disaster. This is a vital part of trading the w pattern in forex.
Falling for Confirmation Bias
Confirmation bias is the psychological tendency to see what you want to see. Once you think you’ve spotted a potential w pattern in forex, your brain will start to filter information, paying more attention to signals that confirm your belief and ignoring those that contradict it. You might overlook the fact that the downtrend is still very strong or that there’s major resistance just above the neckline.
- How to Avoid: Actively play the devil’s advocate. Before entering a trade, deliberately search for reasons *not* to take it. What could go wrong? Is there a bearish divergence? Is the overall market sentiment still heavily bearish? Is there a major news event coming up? This process of objective self-critique helps you see the setup from a neutral perspective and avoid trades based on hope rather than evidence. A trading journal is also invaluable here, as it allows you to review past trades and identify when confirmation bias led you astray.
Advanced Tips for a Professional Edge
Once you’ve mastered the basics of identifying and trading the w pattern in forex, you can begin to incorporate more advanced techniques to refine your edge. These are the nuances that can improve your timing, increase your confidence, and help you see the market in a broader context. These tips move beyond the basic mechanics and into the realm of professional market analysis.
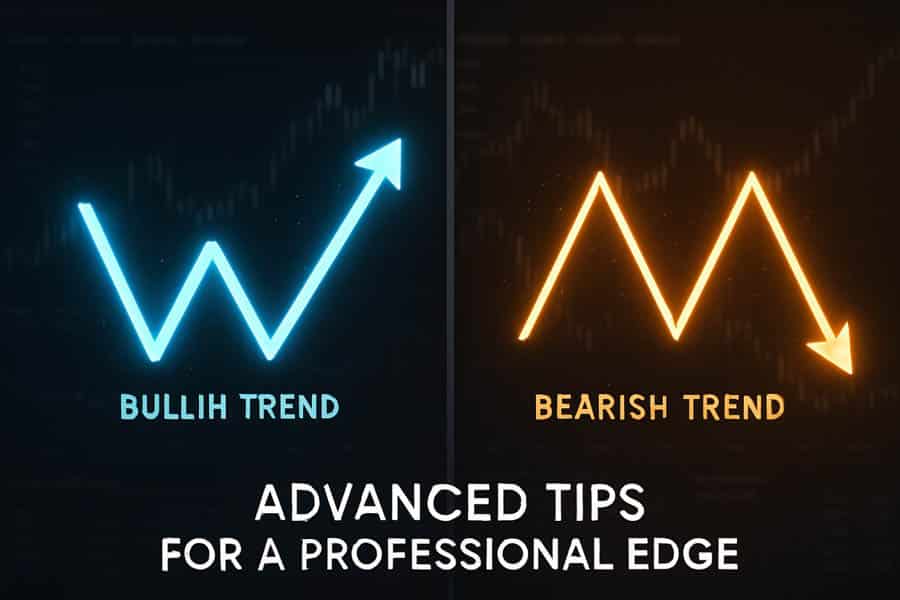
Compare W vs. M Pattern for Context
The W pattern has a bearish counterpart: the M pattern, also known as the double top. This is a reversal pattern that appears at the end of an uptrend and signals a potential move down. Understanding the M pattern is crucial because it provides context. Markets often move between these reversal structures. By being able to identify both, you develop a more complete view of market psychology. Seeing how a market transitions from a W bottom to a potential M top gives you a better feel for the entire market cycle, not just one isolated setup. It helps you recognize when a trend that started with a w pattern in forex might be nearing its exhaustion point. This is a core concept in my advanced w pattern in forex trading approach.
Analyze a Real Chart Case Study
Let’s look at a real-world example on the EUR/CHF daily chart. A few months ago, the pair was in a sustained downtrend. It formed a first low at 0.9400, rallied to a middle peak at 0.9550, and then declined again to form a second low at 0.9410. This second low, slightly higher than the first, showed strong seller exhaustion. The neckline was clearly defined at 0.9550. The subsequent breakout candle closed decisively above this level on strong volume.
- Profit Target Projection: The height of the pattern was 150 pips (0.9550 – 0.9400). Projecting this distance from the breakout point gave a minimum price target of 0.9700 (0.9550 + 150 pips). The trade played out perfectly, hitting the target within two weeks. Studying historical examples like this builds your pattern recognition skills and confidence.
Cite Macro Catalysts That Invalidate Setups
Even the most technically perfect w pattern in forex can be instantly invalidated by a major macroeconomic event. A surprise interest rate hike from a central bank, for instance, can completely change the fundamental outlook for a currency and override any technical signal.
- Key Events to Watch: Always be aware of major economic releases like Central Bank Rate Decisions, Non-Farm Payrolls (NFP) in the U.S., GDP figures, and inflation data (CPI). For example, if you see a bullish W pattern forming on EUR/USD, but the European Central Bank (ECB) signals a more dovish (interest-rate-lowering) stance, the fundamental pressure could easily overwhelm the technical buying signal. A professional trader integrates both technical and fundamental analysis. Knowing what could invalidate your w pattern in forex setup is just as important as knowing what confirms it.
Trade with Opofinance
Elevate your trading of the w pattern in forex with a broker built for performance. Opofinance, regulated by ASIC, provides the ultimate trading environment for traders who demand more.
- Advanced Trading Platforms: Choose from industry-leading platforms including MT4, MT5, cTrader, and the proprietary OpoTrade app.
- Innovative AI Tools: Gain a unique edge with our AI Market Analyzer, AI Coach, and instant AI Support to refine your strategies.
- Diverse Trading Options: Explore opportunities in Social & Prop Trading to diversify your approach.
- Secure & Flexible Transactions: Experience seamless and safe deposits and withdrawals, including crypto payments with zero fees.
Join Opofinance today and unlock your full trading potential!
Conclusion
Mastering the w pattern in forex is a journey of patience, discipline, and precision. It’s more than just spotting a shape; it’s about understanding the shift in market psychology from bearish despair to bullish optimism. The key takeaway is to always wait for confirmation: a decisive candle close above the neckline, ideally supported by a surge in volume. This confirmation is your shield against costly fakeouts. Combine this with disciplined risk management—always defining your exit before you enter—and you have a robust strategy for capturing powerful trend reversals.
Is the W pattern always bullish?
Yes, the W pattern (or double bottom) is exclusively a bullish reversal pattern. It signals the potential end of a downtrend and the beginning of a new uptrend. Its bearish counterpart is the M pattern (double top).
Which time frame is most reliable for the W pattern?
The pattern’s reliability increases with the time frame. It is considered most effective on 4-hour (H4) and daily (D1) charts, as these represent more significant shifts in market sentiment and are less prone to market noise.
How do I set profit targets for a W pattern?
The standard method is to measure the vertical distance from the lowest trough to the neckline and then project that same distance upward from the breakout point. This provides a minimum price objective for the trade.
Can the second low be lower than the first?
Ideally, the second low should be at the same level or slightly higher than the first. A significantly lower second low invalidates the pattern and suggests the downtrend is likely to continue.
What if the breakout happens on low volume?
A breakout on low volume is a significant warning sign. It indicates a lack of conviction from buyers and increases the probability of a “fakeout,” where the price quickly reverses back below the neckline. It is often best to avoid such setups.
References: + + +


