Tired of missing out on quick profits in the fast-paced world of 5-minute chart trading? Do you find yourself struggling to pinpoint those fleeting moments where you can confidently enter and exit trades? You’re definitely not alone. Many traders, especially those who are day trading or scalping, are constantly searching for a reliable tool to give them an edge. Forget complicated indicators and confusing signals. Sometimes, the most effective tools are the simplest. The Exponential Moving Average, or EMA, is a perfect example. So, what are the best EMA settings for a 5 minute chart? Often, using combinations like the 9 EMA and 20 EMA, or even the 5, 8, and 13 EMA, can give you a dynamic view of what’s happening in the short term. This article is your complete guide to understanding and using the best EMA for 5 minute chart. We’ll show you how to master EMA settings for 5 minute chart, giving you the knowledge to make better trading decisions and potentially improve your results. If you’re looking for a solid platform to put these strategies into action, consider exploring a regulated forex broker. Many reputable options are available, and finding the right broker for forex trading can make a big difference.
Understanding EMA on 5 Minute Charts
Short-term trading requires speed and accuracy. Being able to quickly spot trends and potential changes in direction is super important. This is where the Exponential Moving Average (EMA) really shines on a 5 minute chart.

What is EMA?
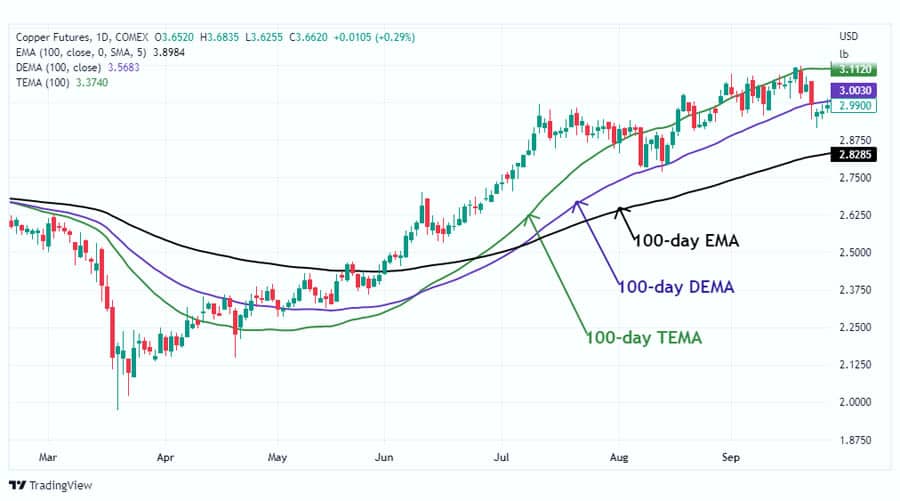
Unlike the Simple Moving Average (SMA), the EMA puts more weight on the most recent price data. This means it reacts faster to what’s happening right now in the market. Think of it this way: the SMA treats all price points equally over a certain period, while the EMA says, “What’s happened lately is more important.” For someone trading on a 5 minute chart, where prices can change quickly, this responsiveness is a big advantage. It can lead to earlier signals for potential profitable trades.
Why Use 5 Minute Charts?
Day traders and scalpers love the 5 minute chart. It gives a very detailed look at price movements, letting traders try to grab small profits frequently throughout the day. This timeframe offers lots of chances to trade, but it also means you need to make decisions fast and ignore the noise. The EMA, because it’s sensitive to recent price changes, becomes a really useful tool here. It helps traders see short-term trends and possible turning points more accurately.
Read More: Best MACD Settings for 5 Minutes Chart
Choosing EMA Settings for 5 Minute Charts
Picking the right EMA settings is like tuning an instrument. If the period is too short, you might get confused by tiny, unimportant price changes. If it’s too long, you might miss the best times to get in or out of a trade. Finding the right balance is key.
EMA vs. SMA Reaction
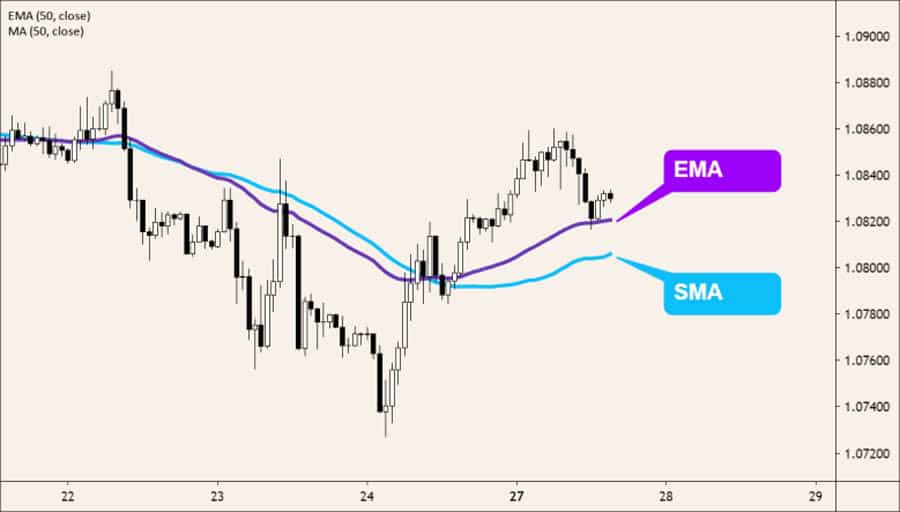
The main difference between EMA and SMA is how they weigh the data. The EMA focuses more on the latest prices, making it quicker to react to new information than the SMA. Imagine a sudden jump in price. The EMA will show this jump faster, possibly signaling a buying opportunity sooner than the SMA would. On the other hand, if the price drops quickly, the EMA will adjust faster, potentially giving sell signals earlier. This quick reaction is especially helpful on a 5 minute chart where timing is everything.
Responsiveness and Reliability
The EMA period you choose directly affects how quickly it reacts and how reliable its signals are. Shorter periods, like a 5 or 9 EMA, will stick very close to the price, giving very fast signals. However, this also means you might get more false signals, especially when the market is jumpy. Longer periods, like a 50 or 200 EMA, will be smoother and less reactive. They might give more reliable signals, but they could also lag behind short-term price movements. The goal is to find a balance that gives you timely signals without being too sensitive to every little wiggle in the price. Trying different settings and looking back at how they performed is really important to find what works best for you.
Top EMA Combinations for 5 Minute Charts
While using just one EMA can be helpful, combining a few EMAs with different periods can make your trading strategy even stronger. These combinations can help you confirm trends, spot potential crossovers, and avoid false signals.
9 and 20 EMA
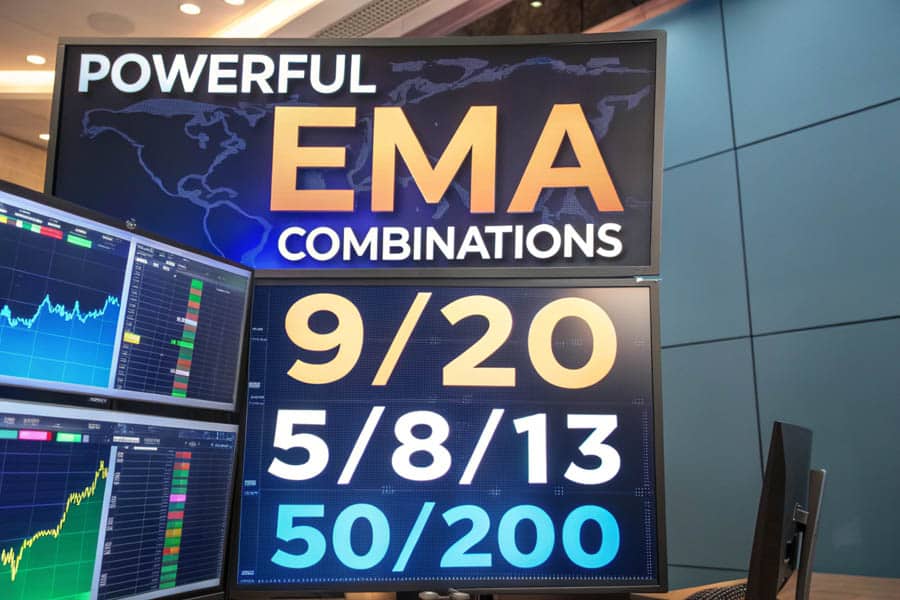
Using the 9 EMA and the 20 EMA together is a popular choice for traders on the 5 minute chart. The faster 9 EMA reacts quickly to short-term price changes, while the slower 20 EMA gives a bit of a longer-term view. When the 9 EMA crosses above the 20 EMA, it can suggest that an upward trend is starting, which could be a good time to buy. If the 9 EMA crosses below the 20 EMA, it might mean a downward trend is beginning, suggesting a possible time to sell. This EMA crossover strategy for 5 minute chart is easy to understand and use, making it a favorite for many traders.
5, 8, and 13 EMA
The combination of the 5, 8, and 13 EMA offers an even closer look at short-term price movements. This is sometimes called an “EMA ribbon” because the three lines move together. It helps to see small changes in momentum. When all three EMAs are moving in the same direction and are nicely spread out, it suggests a strong trend. Crossovers between these EMAs can also signal when to enter or exit a trade. For example, if the 5 EMA crosses above the 8 and 13 EMA, it could be a sign to buy. This combination is really good for catching short-term swings and can be useful for scalping strategies.
50 and 200 EMA
Although they are usually used for longer-term analysis, the 50 EMA and 200 EMA can still provide useful context on a 5 minute chart. The 200 EMA is often seen as a key indicator of the overall long-term trend. If the price is mostly staying above the 200 EMA, it suggests the market is generally bullish. The 50 EMA can act as a level of support or resistance within this longer-term trend. On the 5 minute chart, watching how the price interacts with these longer-term EMAs can help you avoid trades that go against the main trend and give you a better idea of potential price targets.
Read More: EMA Scalping Strategies
Using EMA Crossovers on 5 Minute Charts
The EMA crossover strategy for 5 minute chart is a fundamental part of many trading systems. It’s based on the idea that when a shorter-period EMA crosses a longer-period EMA, it signals a possible change in momentum and a potential trend change.

How to Use EMA Crossovers
The most common way to use EMA crossovers is with two EMAs of different periods. As mentioned before, the 9 and 20 EMA combination is popular. A buy signal happens when the faster 9 EMA crosses above the slower 20 EMA. A sell signal happens when the 9 EMA crosses below the 20 EMA. Traders often look for these crossovers to happen with strong price movement and volume to increase the chances of a successful trade.
Combining EMA with Other Tools
While the EMA is a powerful tool on its own for a 5 minute chart EMA trading strategy, using it with other technical indicators can make it even more effective and give you stronger confirmation signals.
EMA and MACD
The Moving Average Convergence Divergence (MACD) is a momentum indicator that shows the relationship between two moving averages of a security’s price. Using the EMA with the MACD can give you valuable information about both the direction of a trend and its strength. For example, if the 9 EMA crosses above the 20 EMA, suggesting a possible buy, and the MACD line is also crossing above the signal line, it further confirms that the momentum is bullish. If the EMA crossover signals a sell, and the MACD is also showing bearish divergence or a downward crossover, it makes the sell signal stronger.
EMA and RSI
The Relative Strength Index (RSI) is a momentum oscillator that measures how much prices have changed recently to determine if an asset is overbought or oversold. Combining the EMA with the RSI can help you spot potential reversals. For instance, if the EMA crossover signals a buy, but the RSI is getting close to overbought levels (above 70), it might suggest that the upward move is losing steam, and you should be cautious. If the EMA crossover signals a sell, but the RSI is in oversold territory (below 30), it could indicate a potential bounce back up. Also, watching for divergence between the price action and the RSI, along with EMA signals, can point to high-probability trading opportunities.
EMA and Parabolic SAR
The Parabolic SAR (Stop and Reverse) is a trend-following indicator used to identify possible changes in the price direction of an asset. When used with EMA crossovers, the Parabolic SAR can confirm trend reversals. For example, if the 9 EMA crosses above the 20 EMA, signaling a possible uptrend, and the Parabolic SAR dots flip below the price candles, it gives more confirmation of the bullish reversal. If the EMA crossover signals a downtrend, and the Parabolic SAR dots appear above the price candles, it reinforces the bearish signal.
Pros and Cons of EMA on 5 Minute Charts
Like any trading tool, the EMA has its good and bad points, especially when used on the fast-moving 5 minute chart. Knowing these pros and cons is important for using it effectively.
Advantages of Using EMA
The main advantage of using the EMA on a 5 minute chart is how quickly it reacts to price changes. This allows traders to spot potential entry and exit points relatively fast, taking advantage of short-term trends. In markets where prices are consistently moving in one direction, EMA crossovers and how the price interacts with the EMA can give reliable signals for riding the trend. Being able to react quickly to market changes is a big plus for day traders and scalpers working on this timeframe.
Disadvantages of Using EMA
The very thing that makes the EMA so useful – its quick reaction time – can also be a problem in choppy or sideways markets. When prices are moving up and down without a clear direction, the EMA can produce many false signals. The shorter-period EMA might jump back and forth across the longer-period EMA, creating multiple crossover signals that lead to losing trades. It’s crucial to be aware of the current market conditions and be careful when using EMA strategies in markets that aren’t trending. Using the EMA with other indicators that can filter out noise, like volatility indicators, can help reduce this disadvantage.
Advanced EMA Techniques
For experienced traders looking to improve their strategies, there are several advanced EMA techniques that can offer deeper insights and potentially higher probability trades.
EMA Ribbons for Trend Strength
As mentioned earlier, an EMA ribbon involves plotting multiple EMAs with closely related periods (for example, 5, 8, 13, 21). This creates a visual representation of how strong a trend is and its momentum. When the EMAs are spreading out and moving in the same direction, it indicates a strong trend. When the EMAs are getting closer together or crossing over each other, it suggests that the trend is weakening or that the price might be consolidating. Crossovers within the ribbon can also provide early signals to enter a trade. For instance, if the shortest EMA crosses above all the other EMAs in the ribbon, it could signal the start of a strong upward move.
Multi-Timeframe Analysis with EMA
A powerful way to make EMA signals on a 5 minute chart more reliable is to use multi-timeframe analysis. This means looking at the price action and EMA relationships on longer timeframes, such as the 15-minute or 1-hour chart, to get a bigger picture. For example, if the 5 minute chart shows a bullish EMA crossover, but the higher timeframe charts also show an overall uptrend with the price trading above its longer-term EMAs, it gives stronger confirmation for the long trade. If the higher timeframes suggest a downtrend, it might be wise to be more cautious with buy signals on the 5 minute chart.
Read More: 5-Minute Trading Strategy
Managing Risk with EMA Strategies
No trading strategy works perfectly all the time, and managing risk effectively is essential for long-term success, especially when trading on the volatile 5 minute chart.
Setting Stop-Loss and Take-Profit Levels
When using EMA crossover strategy for 5 minute chart, logical stop-loss levels can be placed just below the recent swing low for buy trades or just above the recent swing high for sell trades. Some traders also use the longer-period EMA as a dynamic stop-loss, exiting a buy trade if the price closes below the EMA or a sell trade if it closes above it. Take-profit levels can be set based on risk-reward ratios, previous support and resistance levels, or by watching for when the EMA relationship starts to weaken or reverse.
Using Trailing Stops and Proper Position Sizing
Trailing stops are a useful tool for protecting profits as a trade moves in your favor. For buy trades, a trailing stop can be set a certain distance below the highest price reached, automatically moving up as the price increases. For sell trades, it would be set above the lowest price reached. Proper position sizing is also crucial. Never risk more than a small percentage of your trading capital on any single trade. This helps protect your capital and allows you to handle inevitable losing streaks.
Common Mistakes to Avoid
Even with a good understanding of EMA strategies, traders can make common mistakes that hurt their performance. Being aware of these mistakes can help you avoid them.
Don’t Rely Only on EMA
While the EMA is a valuable tool, it shouldn’t be the only thing you look at. Relying solely on EMA signals without considering other technical indicators, price action patterns, or volume can lead to more false signals and losing trades. As discussed earlier, combining the EMA with indicators like the MACD, RSI, or Parabolic SAR can give you stronger confirmation and filter out noise.
Consider Market Conditions
Market volatility can greatly affect how well EMA strategies work. During times of high volatility, EMA crossovers might happen more often and be less reliable. It’s important to know the current volatility levels and adjust your trading approach accordingly. Also, ignoring important economic news and events can be harmful. Major economic announcements can cause big price swings that override technical indicators. Staying informed about market-moving events is crucial for making smart trading decisions.
Opofinance Services
Looking for a reliable and regulated online forex broker to implement your 5 minute chart EMA trading strategy? Consider Opofinance, an ASIC regulated broker for forex committed to providing a secure and efficient trading environment.
- ASIC Regulated: Trade with confidence knowing Opofinance adheres to the stringent regulatory standards of the Australian Securities and Investments Commission (ASIC).
- Social Trading: Leverage the knowledge of experienced traders through Opofinance’s social trading platform, potentially gaining insights and strategies to enhance your own trading.
- Officially Featured on MT5 Brokers List: Opofinance is recognized as a reputable broker for forex trading and is officially listed on the popular MetaTrader 5 platform.
- Safe and Convenient Deposits and Withdrawals: Enjoy hassle-free transactions with a variety of secure deposit and withdrawal methods.

Ready to take your best EMA for 5 minute chart trading to the next level? Explore the opportunities with.Opofinance.
Conclusion: Mastering EMA for 5 Minute Charts
The Exponential Moving Average is a powerful and versatile tool for navigating the fast-paced world of 5 minute chart trading. By understanding its details, trying out different settings and combinations, and using it with other technical indicators, you can greatly improve your ability to spot short-term trends and potential trading opportunities.
We’ve looked at various best EMA settings for 5 minute chart, including the popular 9 and 20 EMA, the 5, 8, and 13 EMA ribbon, and the longer-term 50 and 200 EMAs. We’ve discussed the EMA crossover strategy for 5 minute chart, how to use it for entry and exit signals, and the benefits of combining the EMA with indicators like the MACD, RSI, and Parabolic SAR. Remember, the key to mastering the best EMA for 5 minute chart is to practice consistently and adapt. What works in one market situation might not work in another.
The information here gives you a strong starting point, but becoming a skilled 5 minute chart trader takes ongoing learning and improvement. Don’t be afraid to experiment with different EMA settings for 5 minute chart and combinations to find what works best for your trading style and the specific markets you trade. Testing your strategies on past data is crucial for seeing how well they work and identifying any weaknesses. Embrace the learning process, adapt to changing market conditions, and you’ll be well on your way to unlocking the potential of EMA on the 5 minute chart.
Key Takeaways
- The best EMA settings for 5 minute chart often involve combinations like the 9 and 20 EMA for quick trend identification or the 5, 8, and 13 EMA for capturing short-term movements.
- EMA crossovers can provide valuable entry and exit signals, especially when confirmed by other indicators.
- Combining **EMA with MACD, RSI, or Parabolic SAR** can enhance signal reliability and filter out noise.
- Risk management, including setting stop-loss and take-profit levels, is crucial when using EMA strategies on the 5 minute chart.
- Avoid **over-reliance on EMA** and always consider market volatility and broader economic conditions.
How can I determine if an EMA crossover is a genuine signal and not a false one?
To increase the probability of a genuine EMA crossover signal, look for confluence with other factors. Consider the volume during the crossover – higher volume often indicates stronger conviction. Also, check if the crossover aligns with the overall trend on higher timeframes and if other indicators, like the MACD or RSI, are confirming the signal. Avoid trading crossovers in choppy or sideways markets where false signals are more frequent.
What is the best way to backtest EMA strategies for the 5 minute chart?
The most effective way to backtest EMA strategies is by using a trading platform that offers historical data and backtesting capabilities. Manually reviewing charts and noting the outcomes of potential trades based on your chosen EMA settings can also be helpful, though more time-consuming. Focus on a significant sample size of trades to get a statistically relevant understanding of the strategy’s performance, considering different market conditions and time periods.
Can EMA settings be optimized for specific currency pairs or assets?
Yes, different currency pairs and assets can exhibit varying levels of volatility and trending behavior. Therefore, EMA settings that work well for one asset might not be optimal for another. It’s advisable to backtest and potentially optimize your EMA settings for the specific currency pairs or assets you intend to trade. Pay attention to how the EMA reacts to price movements for each asset and adjust the periods accordingly to find the best fit.


