In the high-stakes arena of trading, predicting market movements with precision is essential for achieving consistent success. Imagine having a strategy that not only identifies the direction of the market but also pinpoints exact entry and exit points. Elliott Wave Theory and trendline analysis are two powerful tools that, when combined, offer traders unparalleled insights into market behavior. This comprehensive guide delves deep into integrating Elliott Wave Theory with trendline analysis, empowering intermediate to advanced traders to refine their forecasting skills and enhance trading outcomes.

Developed by Ralph Nelson Elliott in the 1930s, Elliott Wave Theory is rooted in the belief that market movements are driven by collective investor psychology, manifesting in predictable wave patterns. On the other hand, trendlines are fundamental visual tools that help traders identify and confirm the direction of price movements, acting as dynamic support and resistance levels. By merging these approaches, traders can achieve a higher level of accuracy in their market predictions, making informed decisions that align with both wave patterns and trend directions.
Whether you’re a forex trading broker professional seeking to elevate your analysis techniques or a seasoned trader looking to incorporate advanced strategies, this guide offers the foundational concepts, practical applications, and sophisticated methods necessary to harness the full potential of Elliott Wave and trendline integration. Unlock the secrets of the markets and take your trading strategy to the next level.
Elliott Wave Theory: Fundamentals
Basic Structure of Elliott Waves
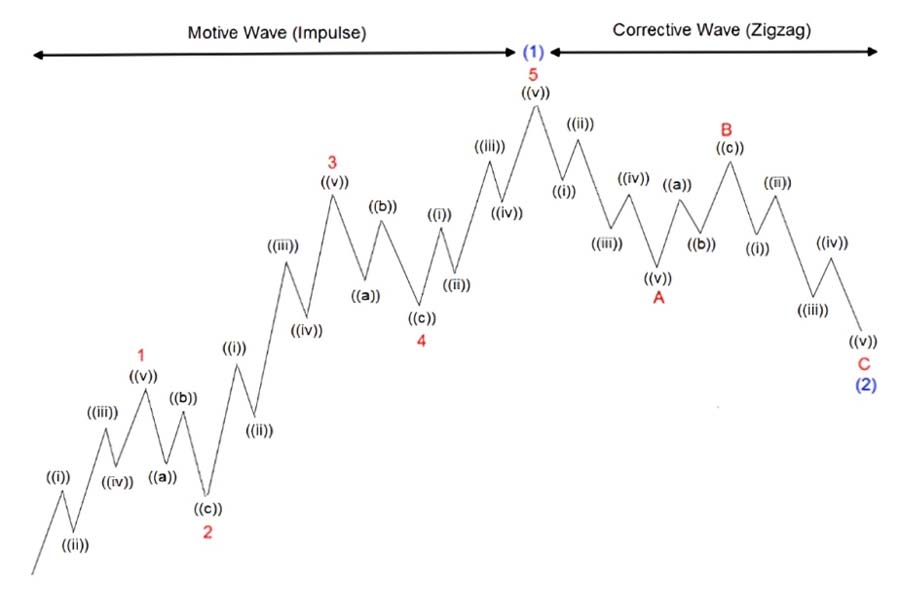
Elliott Wave Theory posits that market prices move in repetitive cycles, driven by investor sentiment and psychology. These cycles are broken down into impulse waves and corrective waves, each with distinct characteristics.
Impulse Waves
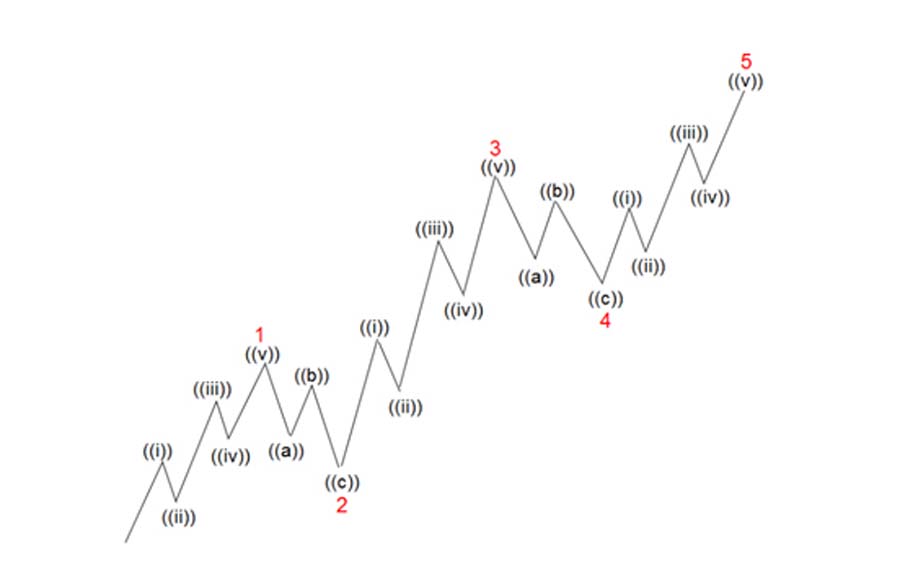
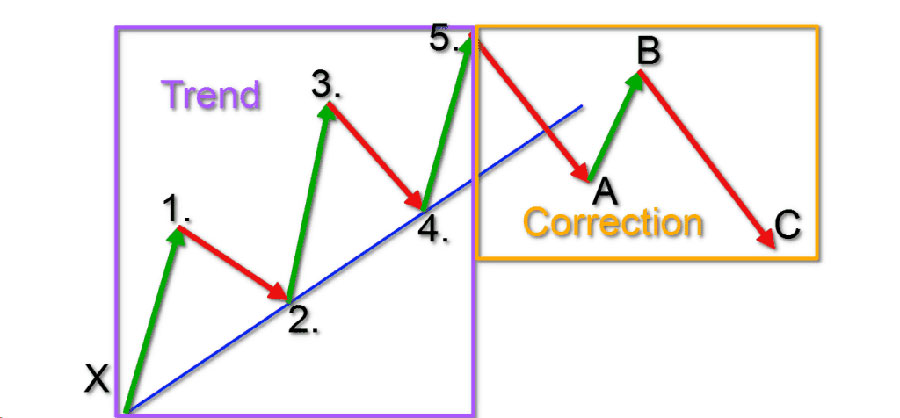
Impulse waves are the backbone of Elliott Wave Theory, consisting of a five-wave pattern that moves in the direction of the main trend. These waves are labeled as waves 1 through 5:
- Wave 1: The market begins to move upward as initial investors enter.
- Wave 2: A minor pullback occurs, but it does not exceed the start of Wave 1.
- Wave 3: Typically the longest and strongest wave, driven by widespread investor enthusiasm.
- Wave 4: Another pullback, often less severe than Wave 2.
- Wave 5: The final push upward, sometimes characterized by exuberance and overextension.
Read More: elliott wave and rsi
Corrective Waves
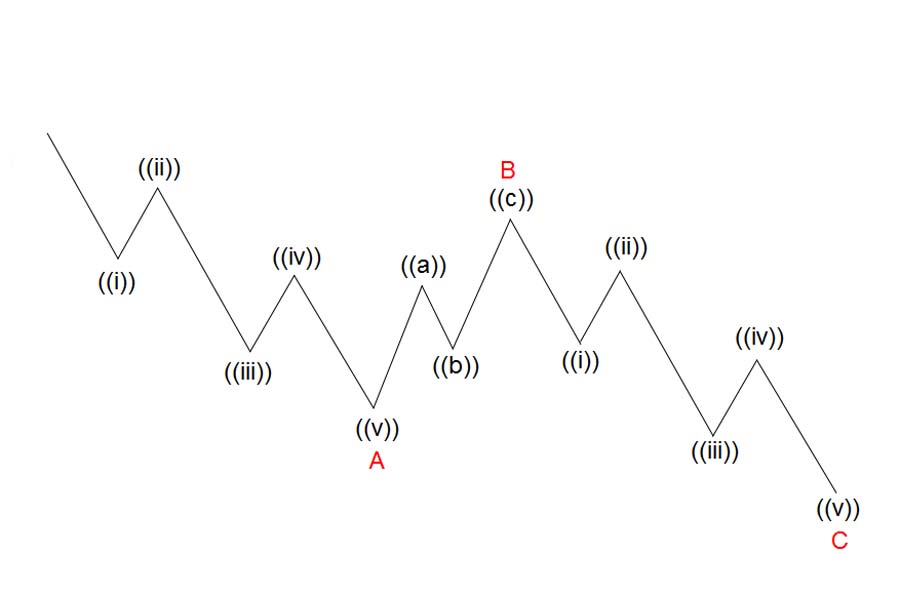
Corrective waves move against the main trend and typically follow a three-wave pattern labeled as waves A, B, and C:
- Wave A: The initial move against the trend.
- Wave B: A temporary reversal, often misleading traders into believing the original trend will continue.
- Wave C: A decisive move that confirms the trend reversal.
Wave Degrees and Fractals
Elliott Wave Theory operates on multiple time frames, known as wave degrees, allowing for multi-level analysis. Each wave can be broken down into smaller sub-waves, creating a fractal pattern. This fractal nature ensures that wave patterns are consistent across different scales, providing a comprehensive framework for market analysis.
Significance of Elliott Wave Theory in Predicting Market Cycles
Elliott Wave Theory is invaluable for predicting market cycles as it reflects the underlying crowd psychology. By understanding the emotional states driving market participants, traders can identify potential market tops, bottoms, and reversals. For instance, Wave 3 often coincides with a surge in bullish sentiment, while Wave C may indicate the culmination of bearish sentiment.
Common Patterns and Variations in Wave Formation
Elliott Wave patterns are not always straightforward. Understanding common corrective structures and complex wave patterns is crucial for accurate wave counting.
- Common Corrective Structures:
- Zigzag: A sharp three-wave correction (A-B-C) often seen after a strong impulse wave.
- Flat: A sideways correction where Wave B exceeds the start of Wave A.
- Triangle: A consolidation pattern consisting of five waves, typically occurring in Wave C.
- Diagonal and Complex Wave Patterns:
- Leading Diagonals: Found in the first wave of an impulse sequence, characterized by overlapping waves.
- Ending Diagonals: Occur in the fifth wave, signaling the end of the impulse sequence.
- Complex Corrections: Involving combinations of zigzags, flats, and triangles, often requiring nuanced analysis.
Trendlines: A Closer Look
Types of Trendlines and Their Purposes
Trendlines are essential tools for visualizing market direction and sentiment. They come in three primary forms:
- Upward Trendlines: Connect higher lows, indicating a bullish market sentiment.
- Downward Trendlines: Connect lower highs, signaling a bearish outlook.
- Horizontal Trendlines: Indicate consolidation or a lack of clear trend direction.
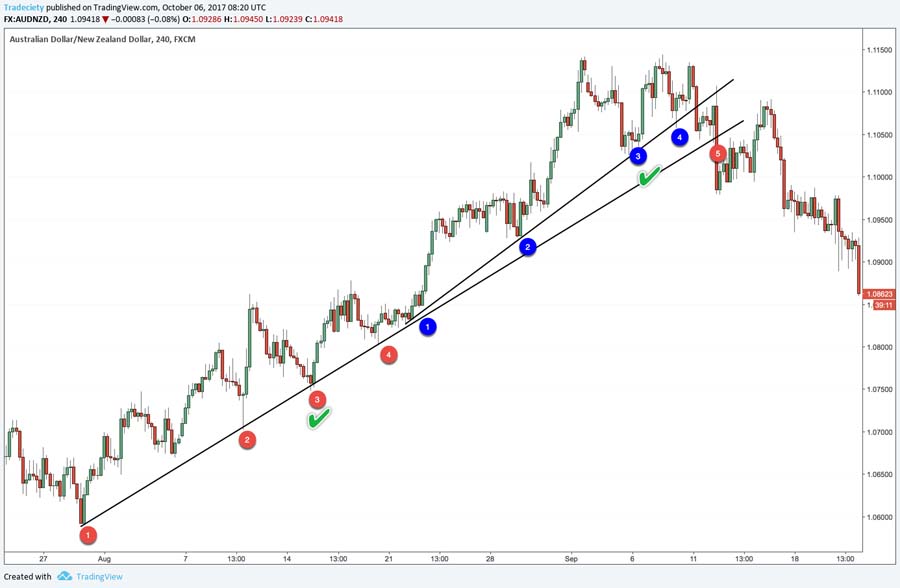
Each type of trendline helps traders understand the prevailing market sentiment and anticipate future price movements.
Read More: Elliott Wave and Fibonacci
Methods for Drawing Effective Trendlines
Drawing accurate trendlines requires precision and attention to key price points.
- Identifying Accurate Points to Connect:
- Use significant swing highs and lows.
- Ensure that the trendline touches at least two or three points for validation.
- Common Mistakes and How to Avoid Them:
- Overfitting: Connecting too many points, leading to unreliable trendlines.
- Ignoring Context: Failing to consider overall market conditions.
- Incorrect Angle: Drawing trendlines that are too steep or too flat, misrepresenting the trend.
Trendlines in Identifying Support and Resistance Levels
Trendlines serve as dynamic support and resistance levels, where price action often reacts.
- Dynamic Support and Resistance:
- In an uptrend, the trendline acts as support.
- In a downtrend, it serves as resistance.
- Validating Trendline Breaks:
- Confirm trend reversals or continuations by observing multiple touches and reactions to the trendline.
- Use volume analysis to strengthen the validity of a trendline break.
Integrating Trendlines with Elliott Wave Analysis
Using Trendlines to Define Elliott Wave Patterns
Trendlines enhance Elliott Wave analysis by providing clear boundaries for wave structures.
- Marking Start and End Points:
- Use trendlines to delineate the beginning and conclusion of impulse and corrective waves.
- Confirming Wave Counts:
- Trendlines act as a sanity check, ensuring that wave counts align with the established trend.
Applying Trend Channels to Forecast Wave Targets
Trend channels, formed by parallel trendlines, help set potential price targets.
- Building Channels Around Impulse and Corrective Waves:
- Create channels that encompass the wave movements, providing a range within which future waves may unfold.
- Adjusting for Extensions and Truncations:
- Modify channels to account for waves that extend beyond typical patterns or terminate prematurely.
Recognizing Key Wave Patterns with Trendline Intersections
Intersecting trendlines can highlight critical areas where impulse and corrective waves interact.
- Pinpointing Areas of Confluence:
- Identify zones where trendlines intersect, signaling potential reversal or continuation points.
- Identifying Entry and Exit Points:
- Use trendline intersections with wave structures to determine optimal trade entry and exit points.
Practical Application: Constructing Trendlines for Elliott Wave Analysis
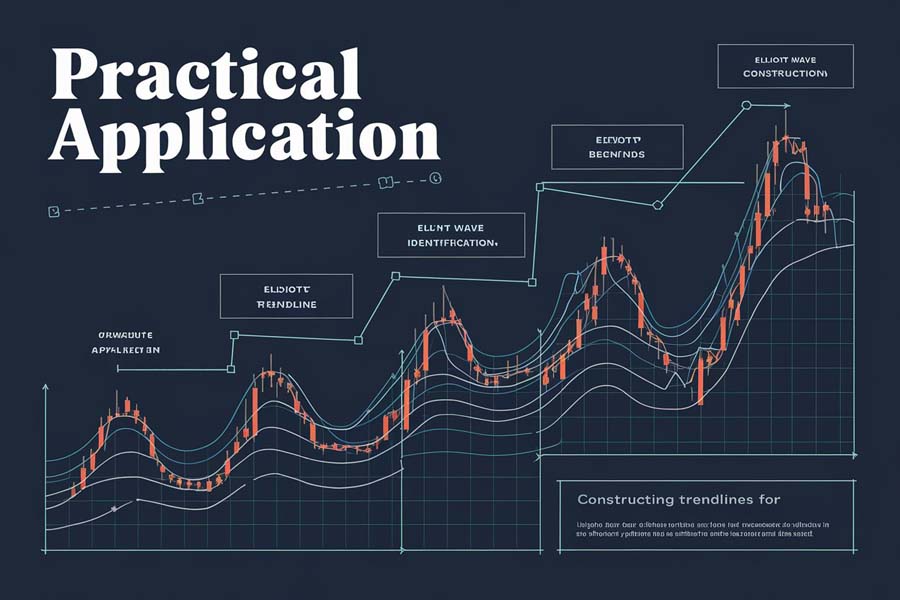
Step-by-Step Guide to Drawing Trend Channels for Impulse Waves
- Identify the Impulse Wave:
- Locate the five-wave pattern in the direction of the main trend.
- Plot the Upward or Downward Trendline:
- Connect the first and last points of the impulse wave.
- Draw the Parallel Trendline:
- Mirror the primary trendline to form a channel around the wave.
- Adjust for Extensions:
- Modify the channel to accommodate extended waves, particularly Wave 3 or Wave 5.
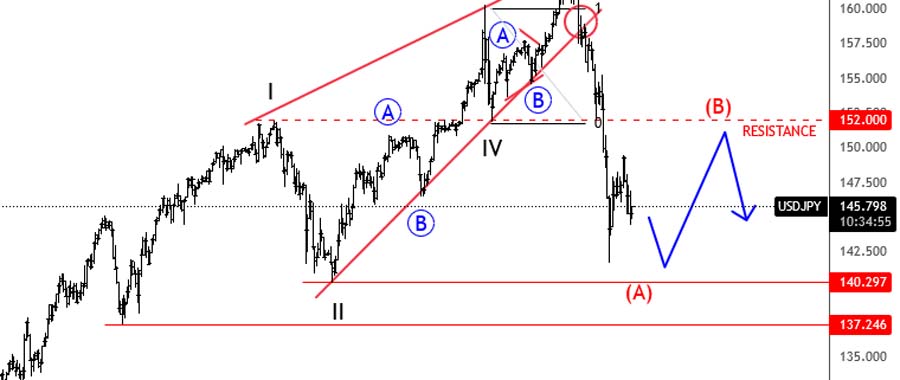
Using Trendlines to Spot Corrective Waves
- Identify the Corrective Pattern:
- Look for three-wave structures (A-B-C) moving against the main trend.
- Draw the Corrective Trendline:
- Connect the peaks and troughs of the corrective waves.
- Analyze the Pattern:
- Use the trendline to confirm the type of correction (zigzag, flat, triangle).
Read More: elliott wave and macd
Case Studies and Real-World Examples
Illustrative examples from Forex, stock, and crypto markets demonstrate the practical application of combining Elliott Wave and trendline analysis.
- Forex Example:
- Annotated charts showing impulse and corrective waves aligned with trendlines, highlighting potential trade setups.
- Stock Market Example:
- Analysis of a major stock’s price movements, demonstrating wave patterns and trendline confirmations.
- Crypto Example:
- Cryptocurrencies’ volatile movements analyzed through Elliott Wave and trendline integration, showcasing precise entry and exit points.
These real-world examples illustrate how integrating Elliott Wave Theory with trendline analysis can lead to more informed and strategic trading decisions.
Common Challenges and Solutions
Subjectivity in Wave Counting and Trendline Placement
Elliott Wave analysis can be highly subjective, leading to inconsistent wave counts and trendline placements.
- Common Pitfalls and Biases:
- Overlooking alternative wave counts.
- Anchoring bias towards initial wave interpretations.
- Techniques to Reduce Errors:
- Utilize Fibonacci retracements and volume analysis to add objectivity.
- Regularly reassess wave counts against new price data.
Strategies for Validating Wave Counts Using Trendline Analysis
Trendlines provide an objective framework to validate wave counts.
- Trendline Confirmation:
- Ensure wave counts align with trendline support or resistance.
- Re-evaluating Trends:
- Adjust wave counts based on trendline validity, maintaining flexibility in analysis.
Tips to Avoid Common Pitfalls
- Recognize False Breaks:
- Use multiple confirmations before acting on trendline breaks.
- Ensure Accurate Trendline Placement:
- Base trendlines on significant swing points, avoiding arbitrary connections.
- Maintain Patience and Discipline:
- Wait for clear confirmations before making trading decisions based on Elliott Wave and trendline analysis.
Advanced Techniques for Combining Elliott Waves and Trendlines

Using Fibonacci Levels in Conjunction with Trendlines and Elliott Waves
Fibonacci levels enhance the precision of Elliott Wave and trendline analysis.
- Fibonacci Retracement Levels:
- Apply retracement levels to identify potential support and resistance within wave structures.
- Fibonacci Extensions:
- Use extension levels to set price targets for impulse waves, particularly Wave 3 and Wave 5.
Incorporating Momentum Indicators
Momentum indicators provide additional confirmation for wave and trendline analysis.
- RSI and MACD:
- RSI (Relative Strength Index): Identifies overbought or oversold conditions.
- MACD (Moving Average Convergence Divergence): Signals trend strength and potential reversals.
- Example Setups:
- A bullish wave pattern confirmed by a rising MACD and RSI levels, indicating strong momentum.
Diagonal Patterns and Their Unique Implications in Trendline Analysis
Diagonal patterns, such as leading and ending diagonals, offer unique trading opportunities.
- Recognizing Leading and Ending Diagonals:
- Leading Diagonals: Found in Wave 1 of an impulse, characterized by overlapping wave patterns.
- Ending Diagonals: Appear in Wave 5, signaling the final wave in the impulse sequence.
- Trading Diagonals:
- Apply trend channels to diagonal formations, identifying precise trade entries and exits based on wave and trendline intersections.
Integrating Volume Analysis
Volume is a critical component in confirming wave patterns and trendline validity.
- Volume Spikes:
- Confirm the strength of impulse waves when accompanied by increasing volume.
- Volume Divergence:
- Identify potential reversals when volume decreases during an impulse wave or increases during a corrective wave.
Utilizing Multiple Indicators for Confirmation
Combining Elliott Wave and trendline analysis with multiple indicators can enhance trade accuracy.
- Bollinger Bands:
- Use to identify volatility and potential reversal points within wave structures.
- Moving Averages:
- Confirm trend direction and support/resistance levels in conjunction with trendlines.
By integrating these advanced techniques, traders can develop a more nuanced and robust analysis framework, leading to higher prediction accuracy and trading success.
Real-World Trading Strategy: Combining Elliott Wave, Trendline, and Momentum Analysis
Detailed Example of a Trading Strategy
Scenario: A trader identifies a five-wave impulse pattern in a major forex pair, supported by an upward trendline. The RSI indicates overbought conditions, while the MACD shows a bearish crossover.
Trade Setup:
- Entry Point: At the intersection of the downward-sloping MACD and the trendline within Wave 5.
- Exit Point: At the expected end of Wave 5, based on Fibonacci extension levels.
- Stop-Loss Placement: Below the recent swing low to manage risk.
This strategy leverages the combined insights from Elliott Wave Theory, trendline analysis, and momentum indicators to make informed trading decisions.
Sample Risk Management Guidelines
- Manage Trade Size:
- Allocate only a small percentage of the trading capital to each trade.
- Set Stop-Loss Levels:
- Place stop-loss orders below key support or trendline levels to limit potential losses.
- Use Risk-Reward Ratios:
- Aim for a minimum risk-reward ratio of 1:2, ensuring potential profits outweigh potential losses.
Effective risk management is crucial for preserving capital and ensuring long-term trading success.
Common Challenges and Solutions (Continued)
Addressing Subjectivity in Wave Counting
To mitigate the inherent subjectivity in Elliott Wave counting:
- Use Multiple Time Frames:
- Analyze wave patterns across different time frames to confirm consistency.
- Incorporate Additional Indicators:
- Utilize volume and momentum indicators to validate wave counts objectively.
Enhancing Trendline Accuracy
Improving trendline accuracy involves:
- Regular Reassessment:
- Continuously update trendlines based on new price data.
- Avoid Overfitting:
- Ensure trendlines are based on significant and reliable swing points rather than every minor price fluctuation.
Pro Tips for Advanced Traders
- Stay Flexible with Wave Counts:
- Be prepared to adjust wave counts as new price data emerges to maintain accuracy.
- Combine Multiple Analysis Tools:
- Integrate Elliott Wave and trendline analysis with other technical tools like Fibonacci levels, volume indicators, and momentum indicators for a comprehensive strategy.
- Practice on Multiple Markets:
- Apply your strategies across different markets (Forex, stocks, crypto) to enhance adaptability and proficiency.
- Maintain a Trading Journal:
- Document your wave counts, trendline drawings, and trade outcomes to identify patterns and improve future analysis.
- Stay Informed on Market Sentiment:
- Keep abreast of news and events that may influence market psychology and disrupt wave patterns.
- Use Volume-Weighted Trendlines:
- Enhance the accuracy of your trendline analysis by incorporating volume data, ensuring trendlines are supported by trading activity.
These pro tips provide advanced traders with actionable strategies to refine their analysis and trading techniques further.
Opofinance Services
When it comes to executing your advanced trading strategies, choosing the right broker is crucial. Opofinance stands out as an ASIC regulated forex broker, ensuring a secure and transparent trading environment. Their social trading service allows you to follow and replicate the strategies of successful traders, enhancing your trading potential. Additionally, Opofinance is officially featured on the MT5 brokers list, offering a robust and versatile trading platform. With safe and convenient deposit and withdrawal methods, managing your funds has never been easier. Join Opofinance today and leverage their advanced trading platforms to maximize your Elliott Wave and trendline strategies. Trust Opofinance to support your trading journey with reliability and excellence.

Conclusion: Unlock the Power of Combining Elliott Wave Theory with Trendline Analysis
Integrating Elliott Wave Theory with trendline analysis creates a dynamic synergy that significantly enhances your ability to predict market movements with precision. This powerful combination allows you to identify clear wave patterns, confirm trend directions, and pinpoint optimal entry and exit points, giving you a competitive edge in the trading arena. By mastering the interplay between wave structures and trendlines, you can navigate market complexities with greater confidence and achieve sustained trading success.
Recap of Critical Benefits
- Enhanced Market Forecasting: Merging wave patterns with trend direction provides a more reliable foundation for predicting future price movements.
- Improved Trade Timing: Trendlines validate wave counts, ensuring that your entry and exit points are strategically timed for maximum profitability.
- Comprehensive Analysis: Utilizing Fibonacci levels and momentum indicators alongside Elliott Waves and trendlines offers a multi-faceted approach to market analysis.
- Reduced Subjectivity: Trendlines add an objective layer to wave counting, minimizing the inherent subjectivity of Elliott Wave analysis.
Take Action to Elevate Your Trading Strategy
Embrace the synergy of Elliott Wave Theory and trendline analysis to transform your trading approach. Regular practice, continuous learning, and disciplined application of these concepts are essential for mastering this integrated strategy. By committing to refine your skills and leveraging the advanced techniques outlined in this guide, you can unlock the full potential of your trading strategies and achieve consistent market success.
Final Thoughts
Mastering the combination of Elliott Wave Theory and trendline analysis empowers you to make informed, strategic decisions in the financial markets. This integrated approach not only enhances your market forecasting capabilities but also fosters a deeper understanding of market psychology and price action. Stay committed to learning, practice diligently, and leverage the tools and strategies discussed to elevate your trading success to new heights.
Key Takeaways
- Integration Power: Combining Elliott Wave Theory with trendline analysis offers a robust framework for market forecasting.
- Enhanced Accuracy: The synergy between wave patterns and trendlines improves prediction precision and trading success.
- Advanced Strategies: Utilizing Fibonacci levels, momentum indicators, and volume analysis further refines trading strategies.
- Practical Application: Real-world examples and step-by-step guides facilitate the effective implementation of these concepts.
- Risk Management: Effective risk management strategies are essential for preserving capital and ensuring long-term trading success.
- Continuous Learning: Staying flexible, combining multiple tools, and maintaining a trading journal are key practices for ongoing improvement.
By understanding and applying these critical points, traders can navigate market complexities with greater confidence and effectiveness.
How can trendlines help in identifying potential market reversals not covered by Elliott Wave Theory?
Trendlines can reveal key support and resistance levels that, when broken, signal potential reversals. By monitoring how price interacts with these trendlines, traders can identify breakout points or bounces, providing additional confirmation beyond wave patterns.
Can Elliott Wave Theory and trendline analysis be applied to short-term trading strategies?
Yes, both Elliott Wave Theory and trendline analysis can be adapted for short-term trading. By focusing on lower wave degrees and shorter time frames, traders can apply these tools to intraday or swing trading strategies effectively.
What role does market volatility play in the accuracy of Elliott Wave and trendline analysis?
Market volatility can impact the formation and clarity of wave patterns and trendlines. High volatility may lead to more erratic price movements, making wave counts and trendlines less reliable. Conversely, low volatility can result in clearer patterns, enhancing analysis accuracy.


