In the dynamic realm of forex trading, technical analysis is indispensable for traders aiming to decode and anticipate market movements. Among the plethora of analytical tools, the combination of Elliott Wave and MACD stands out as a formidable duo for predicting price trends with remarkable accuracy. Elliott Wave Theory delves into the cyclical patterns of price movements, while the MACD (Moving Average Convergence Divergence) focuses on momentum, providing a comprehensive view of the market’s behavior. Understanding how to identify Elliott Wave using MACD, in conjunction with selecting the right forex trading broker, not only enhances trading strategies but also equips traders with the insights needed for more precise market predictions. This article explores the intricate relationship between Elliott Wave and MACD, demonstrating how their synergy can significantly improve your trading outcomes.

Overview of Elliott Wave Theory
Historical Background
Elliott Wave Theory, introduced by Ralph Nelson Elliott in the 1930s, revolutionized technical analysis by proposing that market prices move in predictable patterns driven by investor psychology. Elliott observed that these patterns, or “waves,” reflect the collective emotions and behaviors of traders, leading to repetitive cycles in market movements. This theory integrates the concept that human emotions, such as optimism and pessimism, manifest in distinct wave patterns that can be analyzed to forecast future price actions.
Core Principles of Elliott Wave Theory
- Fractal Nature of Markets: Markets exhibit fractal patterns, meaning that wave structures repeat across various timeframes, from minutes to decades.
- Five-Wave Impulse Pattern: Represents the primary trend’s progression through five distinct waves.
- Three-Wave Corrective Pattern: Follows the impulse waves with three waves that counter the main trend.
- Fibonacci Ratios: Fibonacci sequences are integral, determining wave lengths and retracement levels to ensure wave structures adhere to natural mathematical relationships.
Detailed Analysis of Wave Types
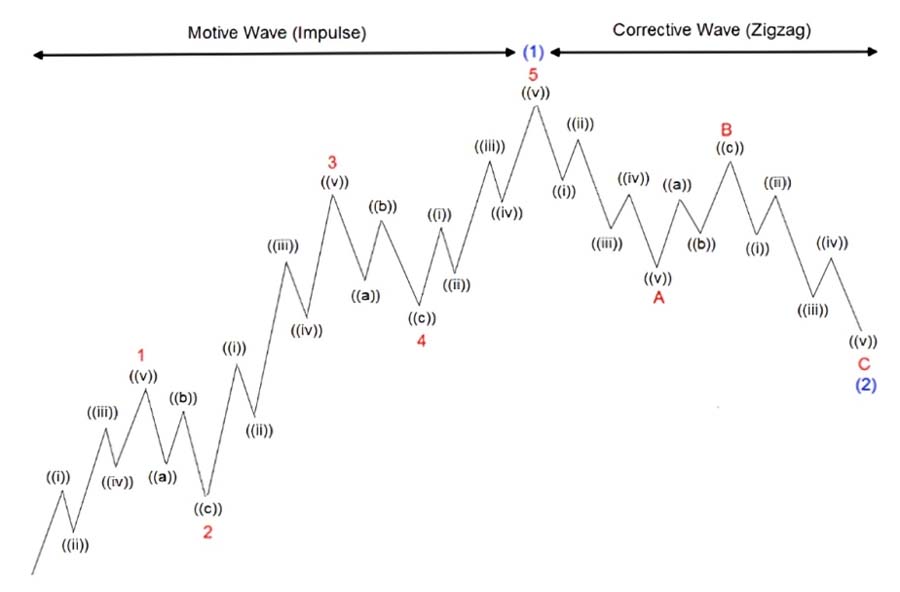
Impulse Waves
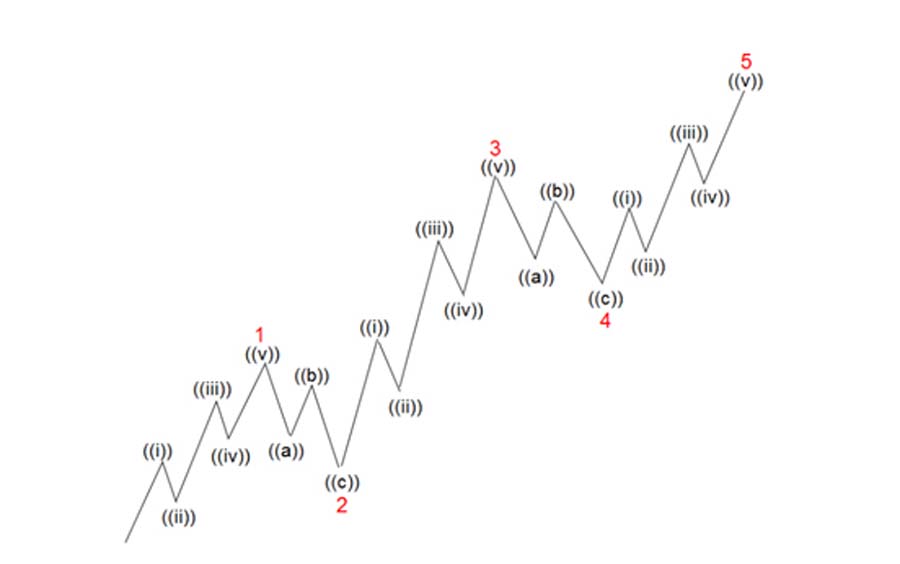
Impulse waves consist of five sub-waves, each representing a specific phase of market psychology:
- Wave 1: Initiation of the trend.
- Wave 2: Minor retracement, not exceeding Wave 1.
- Wave 3: The most powerful and extended wave.
- Wave 4: Another retracement, typically less severe than Wave 2.
- Wave 5: Final push in the trend’s direction.
Corrective Waves
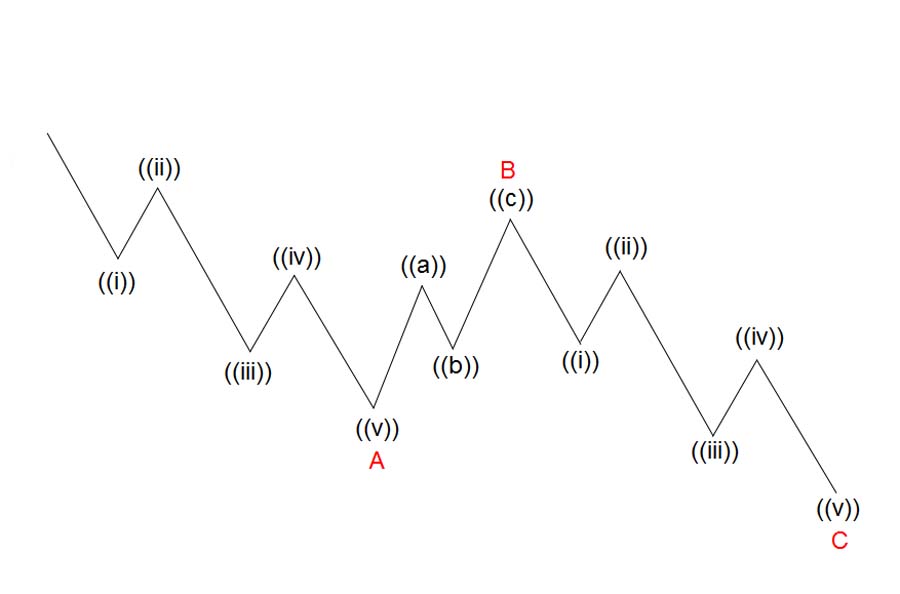
Corrective waves counteract the primary trend and come in three primary forms:
- Zigzags: Sharp three-wave patterns indicating strong corrections.
- Flats: Horizontal corrections with equal wave lengths.
- Triangles: Consolidation patterns signaling the next move’s direction.
Using Elliott Waves in Practice
- Identifying Wave Patterns: Recognizing wave structures in real-time markets requires experience and keen observation.
- Common Challenges: Misinterpretation and subjectivity can hinder accurate wave counting. Enhancing accuracy involves adhering to strict wave rules and practicing consistently.
- Different Timeframes: Elliott Waves can be applied across various timeframes, making them versatile for different trading strategies.
Read More: Elliott Wave vs Neo Wave
Guide to MACD (Moving Average Convergence Divergence)
What is MACD?
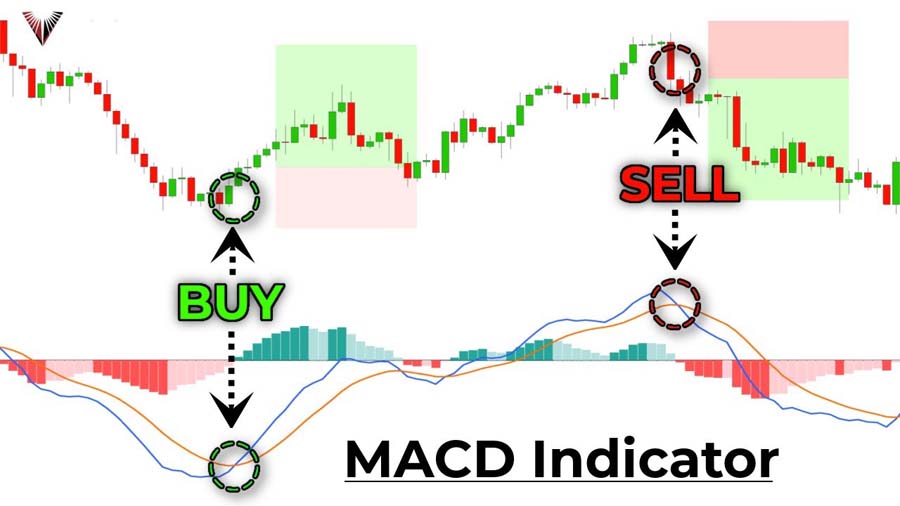
The MACD is a trend-following momentum indicator that illustrates the relationship between two moving averages of a security’s price. Developed by Gerald Appel in the late 1970s, MACD is widely used to identify potential buy and sell signals based on the convergence and divergence of moving averages.
Detailed Components of MACD
- Signal Line: A 9-period EMA of the MACD line, used for identifying crossover signals and momentum shifts.
- MACD Line: Reflects short-term momentum changes, tracking the convergence and divergence of the moving averages.
- Histogram: Visualizes momentum strength by displaying the distance between the MACD line and the signal line.
Interpreting MACD Signals
- Crossover Signals: When the MACD line crosses above the signal line, it generates a bullish signal; a bearish signal occurs when it crosses below.
- Zero Line Crossovers: Indicates a shift in the trend direction when the MACD line moves above or below the zero line.
- MACD Divergence: Occurs when the price moves in the opposite direction of the MACD, signaling potential reversals.
Practical Limitations
- Lagging Nature: As a trend-following indicator, MACD may lag behind price movements, causing delayed signals.
- False Signals: In choppy or sideways markets, MACD can produce misleading signals.
- Managing Issues: Combining MACD with other indicators and confirming signals can mitigate false signals.
Synergizing Elliott Wave and MACD for Enhanced Analysis
Why Elliott Wave and MACD Make a Powerful Combination
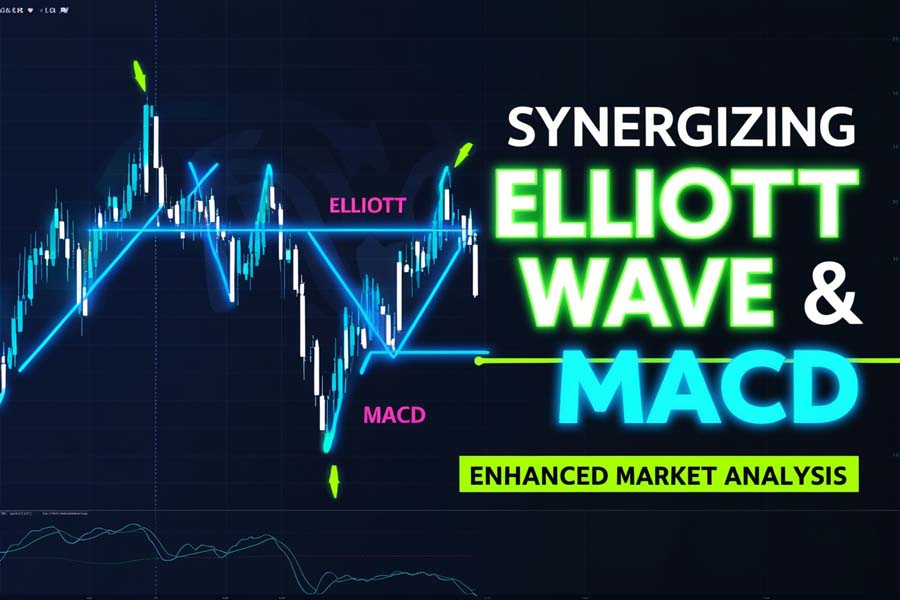
Elliott Wave’s focus on price structure complements MACD’s momentum insights, providing a dual perspective on market movements. While Elliott Wave Theory identifies the underlying wave patterns and cyclical trends, MACD confirms the strength and direction of these trends through momentum analysis. This synergy allows traders to:
- Enhance Accuracy: Combining structural analysis with momentum confirmation leads to more precise market predictions.
- Increase Confidence: Mutual validation between Elliott Wave and MACD signals boosts trader confidence in their decisions.
- Diversify Insights: Leveraging both price patterns and momentum indicators offers a comprehensive understanding of market dynamics.
Situations Where the Combination Excels
- High Probability Trades: Utilize Elliott Wave to pinpoint the trend direction and MACD to confirm momentum, increasing trade confidence.
- Potential Reversals: MACD divergence at the end of a wave sequence can indicate an impending reversal, allowing timely exit or entry.
Limitations of the Combined Approach
- Mixed Signals: Analyzing markets with conflicting Elliott Wave counts and MACD signals requires careful judgment.
- Experience Required: Mastery of both tools demands practice and experience, as they are not foolproof.
Read More: Elliott Wave vs SMC
Step-by-Step Guide: Conducting Trade Analysis with Elliott Wave and MACD
Step 1: Initial Market Assessment Using Elliott Wave
Identify Market Cycle Phase
Begin by determining the current phase of the market using Elliott Wave Theory. This involves:
- Wave Counting: Analyze the price chart to identify the ongoing wave patterns. Look for the five-wave impulse or the three-wave corrective patterns to understand the primary trend.
- Primary Trend Direction: Establish whether the market is in a bullish or bearish trend based on the wave structure.
Example: In a bull market, identifying an impulse wave indicates a continuation of the upward trend. Recognizing the formation of Wave 3, typically the strongest wave, can signal a prime entry point for long positions.
Practical Application
- Analyze Historical Data: Examine past price movements to spot recurring wave patterns.
- Draw Wave Structures: Use charting tools to delineate the impulse and corrective waves accurately.
- Confirm Wave Rules: Ensure that each wave adheres to Elliott Wave principles, such as Wave 3 not being the shortest impulse wave.
Read More: elliott wave and rsi
Step 2: Confirming with MACD
Analyze Momentum Direction
Once the wave patterns are identified, use MACD to confirm the momentum direction. This step involves:
- MACD Line and Signal Line: Observe the relationship between the MACD line and the signal line. A bullish crossover (MACD line crossing above the signal line) confirms upward momentum, aligning with the impulse wave.
- Histogram Analysis: Evaluate the MACD histogram for momentum strength. A growing histogram indicates strong momentum supporting the identified wave.
Example: At the completion of Wave 3, a bullish MACD crossover can validate the continuation of the trend, reinforcing the decision to hold or enter a long position.
Practical Application
- Overlay MACD on Price Chart: Ensure that the MACD indicator is visible alongside the price chart for simultaneous analysis.
- Identify Crossovers: Look for MACD line crossovers with the signal line that coincide with key wave points.
- Monitor Divergences: Watch for MACD divergences that may signal potential reversals, providing an opportunity to exit or adjust trades.
Step 3: Setting Entry and Exit Points
Determine Entry Points
Use Elliott Wave to identify optimal entry points within the trend. This involves:
- Wave Retracements: Enter trades during corrective waves (Wave 2 or Wave 4) when the market retraces, offering better entry prices.
- Wave Completions: Enter at the beginning of new impulse waves (Wave 3 or Wave 5) when the trend is confirmed.
Example: Entering a long position at the start of Wave 3 after confirming a bullish MACD crossover ensures that the trade aligns with the strong momentum of the trend.
Optimize Exit Timing
Rely on MACD for signaling optimal exit points. This includes:
- Histogram Changes: Exit trades when the MACD histogram starts to shrink, indicating weakening momentum.
- Signal Line Crossovers: Use bearish crossovers (MACD line crossing below the signal line) as signals to exit long positions or enter short positions.
Example: Exiting a trade when the MACD histogram begins to decline during Wave 5 suggests that the upward momentum is fading, allowing the trader to secure profits before a potential reversal.
Realistic Scenario: Mock Trade Setup
Imagine a bullish trade setup where Elliott Wave identifies a 5-wave impulse pattern. The trader spots Wave 1, followed by Wave 2’s retracement. As Wave 3 begins, the MACD confirms strong momentum with a bullish crossover. The trader enters the market at the start of Wave 3, anticipating the powerful upward movement. As the trade progresses into Wave 4, the MACD histogram continues to grow, reinforcing the trend. Upon approaching Wave 5, the MACD starts showing divergence, indicating weakening momentum. The trader exits the trade based on the MACD signals and wave structure analysis, securing profits before the anticipated reversal.
Enhanced Practicality and Validity
To ensure the Step-by-Step Guide is both practical and valid:
- Use Real-Time Data: Apply the steps to live charts, ensuring that the analysis is grounded in current market conditions.
- Incorporate Risk Management: Always include stop-loss orders and position sizing strategies to protect against adverse market movements.
- Backtest Strategies: Validate the effectiveness of the combined Elliott Wave and MACD approach by backtesting on historical data.
- Stay Flexible: Adapt the strategy based on evolving market conditions and personal trading experiences.
Practical Tips and Advanced Strategies for Traders
Avoiding Common Mistakes
Misidentifying Waves
- Personal Bias: Avoid letting personal biases influence wave counts. Stick to objective criteria and wave rules.
- Market Noise: Distinguish between genuine wave patterns and random price fluctuations by focusing on significant movements that adhere to Elliott Wave principles.
- Overcomplication: Keep wave analysis straightforward. Avoid overcomplicating the wave structure with unnecessary subdivisions.
Over-relying on MACD
- Validation: Always validate MACD signals with wave structures to ensure accuracy. Relying solely on MACD can lead to false signals.
- Contextual Analysis: Consider the broader market context when interpreting MACD signals to avoid misinterpretation.
Advanced Strategies
Using Fibonacci Levels with Elliott Wave and MACD
Integrate Fibonacci retracements and extensions with Elliott Wave and MACD to enhance trade precision:
- Entry Points: Use Fibonacci retracement levels to identify potential support and resistance zones for entering trades during corrective waves.
- Exit Points: Apply Fibonacci extensions to determine target levels for exiting trades, aligning with Wave 5 projections.
Adding Additional Indicators
Combine MACD and Elliott Wave with other technical indicators to cross-verify analysis:
- Relative Strength Index (RSI): Helps identify overbought or oversold conditions, complementing MACD divergence signals.
- Stochastic Oscillator: Enhances momentum analysis by indicating potential reversals through its overbought and oversold readings.
Risk Management Advice
Position Sizing
- Allocate Capital Wisely: Determine the appropriate amount of capital to allocate to each trade based on risk tolerance and market volatility.
- Diversify Trades: Spread risk across multiple trades and asset classes to minimize exposure to any single position.
Stop-Loss Placement
- Protect Against Losses: Use stop-loss orders to automatically exit trades if the market moves against your position beyond a predefined threshold.
- Dynamic Stop-Losses: Adjust stop-loss levels based on evolving market conditions and wave progression to lock in profits and limit losses.
Recommendations for Beginners vs. Advanced Traders
- Beginners:
- Start Simple: Focus on mastering basic Elliott Wave and MACD concepts before integrating advanced strategies.
- Use Demo Accounts: Practice trading without financial risk to build confidence and proficiency.
- Advanced Traders:
- Employ Complex Strategies: Utilize multiple indicators and advanced wave patterns to enhance analysis.
- Optimize Indicators: Customize MACD settings and wave counts to better fit specific trading styles and market conditions.
Pro Tips for Advanced Traders
- Refine Wave Counting Skills: Continuously practice identifying waves across different markets and timeframes.
- Optimize MACD Settings: Experiment with different MACD parameters to better fit specific trading styles and assets.
- Diversify Indicators: Incorporate a variety of technical indicators to create a robust and multi-faceted trading strategy.
- Stay Updated: Keep abreast of market news and developments that could impact wave patterns and momentum signals.
Case Study: Real-Life Application of Elliott Wave and MACD Combination
Example 1: Bull Market Trade Setup
Scenario Description
In a bullish market scenario, Elliott Wave Theory identifies a classic 5-wave impulse pattern indicating a strong upward trend. The trader observes:
- Wave 1: Initial price increase driven by early adopters.
- Wave 2: Minor retracement, adhering to Elliott Wave rules.
- Wave 3: Significant upward movement, confirmed by a bullish MACD crossover.
- Wave 4: Consolidation phase with a slight retracement.
- Wave 5: Final push upward, accompanied by MACD histogram expansion.
Trade Execution
- Entry Point: The trader enters a long position at the start of Wave 3, following the bullish MACD crossover that confirms strong momentum.
- Monitoring: Throughout Wave 3 and Wave 4, the trader monitors the MACD histogram for signs of weakening momentum.
- Exit Strategy: As Wave 5 begins and the MACD histogram shows divergence, indicating declining momentum, the trader exits the position, securing profits before a potential trend reversal.
This approach ensures that the trader capitalizes on the strong trend while mitigating risks associated with momentum fading.
Example 2: Bear Market Reversal
Scenario Description
During a bearish trend, Elliott Wave Theory detects a corrective three-wave pattern signaling a potential reversal. The trader observes:
- Wave A: Initial downward movement, establishing the bearish trend.
- Wave B: Partial retracement, showing temporary bullish sentiment.
- Wave C: Continuation of the bearish trend, confirmed by bearish MACD divergence.
Trade Execution
- Entry Point: The trader initiates a short position at the completion of Wave C, following the bearish MACD divergence that signals weakening downward momentum.
- Monitoring: The trader watches for signs of trend exhaustion, such as diminishing MACD histogram bars and potential Elliott Wave pattern completions.
- Exit Strategy: Upon detecting a bullish MACD crossover or the identification of a new impulse wave in the opposite direction, the trader exits the short position and considers re-entry opportunities aligned with the new trend.
This method allows the trader to effectively navigate trend reversals, capitalizing on bearish momentum while preparing for potential upward movements.
Advanced Technical Analysis Tips for Mastering Elliott Wave and MACD
When to Rely on Each Tool Separately
Elliott Wave Alone
- Trending Markets: Effective in markets exhibiting clear and strong wave patterns, where structural analysis provides significant insights.
- Long-Term Analysis: Useful for identifying major market cycles and long-term trends, making it ideal for position traders and long-term investors.
MACD Alone
- Range-Bound Markets: Suitable for identifying momentum shifts in sideways or consolidating markets where wave patterns may be less pronounced.
- Short-Term Trading: Ideal for day traders and swing traders who rely on quick momentum changes and short-term trend confirmations.
Developing a Trading Routine
Daily Chart Analysis
- Regular Monitoring: Analyze charts daily to stay updated on emerging wave patterns and MACD signals.
- Consistent Timing: Establish a specific time each day dedicated to reviewing market charts and updating wave counts.
Maintain Trading Logs
- Document Trades: Keep detailed records of all trades, including entry and exit points, wave counts, MACD signals, and outcomes.
- Analyze Performance: Regularly review trading logs to identify strengths, weaknesses, and areas for improvement.
Review Past Trades
- Learn from Successes and Mistakes: Analyze past trades to understand what worked and what didn’t, refining strategies accordingly.
- Adjust Strategies: Use insights from past trades to adapt and optimize your trading approach, ensuring continuous improvement.
Building Confidence in Your Analysis
Paper Trading
- Practice Without Risk: Engage in paper trading to test strategies and build proficiency without financial risk.
- Refine Techniques: Use paper trading to experiment with different wave counts and MACD settings, honing your analytical skills.
Historical Data Practice
- Backtesting: Analyze historical price data to identify wave patterns and MACD signals, validating the effectiveness of your strategies.
- Pattern Recognition: Enhance your ability to recognize recurring wave structures and momentum shifts through extensive historical analysis.
Gradual Integration
- Step-by-Step Approach: Slowly incorporate Elliott Wave and MACD into your trading routine, ensuring comfort and mastery before fully relying on them.
- Build Gradually: Start with simple wave counts and basic MACD signals, gradually advancing to more complex patterns and multi-indicator strategies.
Opofinance Services
Experience trading excellence with Opofinance, a trusted ASIC regulated forex broker. Opofinance offers a cutting-edge social trading service, enabling you to connect with and replicate the strategies of top traders effortlessly. This feature allows both novice and experienced traders to learn from successful trading approaches, enhancing their own trading performance. Additionally, Opofinance is proudly featured on the MT5 brokers list, ensuring access to one of the most advanced and reliable trading platforms available. With safe and convenient deposit and withdrawal methods, Opofinance provides a secure and seamless trading experience, allowing you to focus on executing your strategies without worrying about financial logistics. Join Opofinance today to elevate your trading journey with unparalleled support and innovative services.
Conclusion
Combining Elliott Wave and MACD offers traders a robust framework for analyzing and predicting market movements. By leveraging the structural insights of Elliott Waves and the momentum signals of MACD, traders can achieve greater accuracy and confidence in their trading decisions. This synergistic approach not only enhances market predictions but also provides a comprehensive understanding of market dynamics, empowering traders to navigate the complexities of forex and stock markets with enhanced precision. Embrace this powerful combination to elevate your trading strategy and achieve superior trading outcomes.
Key Takeaways
- Elliott Wave Theory and MACD are powerful tools that, when combined, offer comprehensive market analysis.
- Elliott Waves help identify price structures, while MACD confirms momentum direction.
- Synergizing both tools enhances trading accuracy, enabling better entry and exit decisions.
- Practical application involves a step-by-step approach, integrating wave identification with momentum confirmation.
- Advanced strategies and risk management are essential for maximizing trading success.
- Opofinance provides a secure and innovative trading platform, enhancing your ability to implement these strategies effectively.
How can Elliott Wave and MACD be used in cryptocurrency trading?
Combining Elliott Wave and MACD in cryptocurrency trading allows traders to identify market cycles and confirm momentum, enhancing the prediction of price movements in highly volatile crypto markets. This combination helps in discerning the underlying wave patterns amidst rapid price fluctuations, providing clearer entry and exit signals.
Can Elliott Wave and MACD be applied to long-term investment strategies?
Yes, Elliott Wave and MACD can be effectively used in long-term investment strategies by analyzing multi-timeframe charts to understand overarching trends and momentum shifts. This approach aids in identifying major market cycles and aligning investments with long-term trend directions, optimizing portfolio performance.
What are the best timeframes to use Elliott Wave and MACD together?
The optimal timeframes for combining Elliott Wave and MACD depend on the trading style, but generally, daily and weekly charts provide a balanced view for identifying significant wave patterns and momentum signals. These timeframes offer sufficient data for accurate wave counts and reliable MACD signals, suitable for both swing and position traders.


